
Abstract
Context: Both frailty and multimorbidity are strong predictors of clinical endpoints for older people. In Italy, the interventions targeting chronicity are mainly based on the treatment of diseases: sufficient epidemiological literature is available about these strategies. Less is known about the territorial distribution of the frailty status.
Aims: To estimate the prevalence of frailty in older people (65+) and to evaluate the relationship between frailty and multimorbidity.
Methods and material: A group of general practitioners working in Veneto (Italy) was enrolled on a voluntary basis. Older individuals were both community dwelling and institutionalized patients, that is, the older people normally followed by Italian general practitioners. A centrally randomized sample was extracted from the pool of physician-assisted elderly. Each doctor evaluated the frailty status through the CSHA Clinical Frailty Scale and the multimorbidity status through the Charlson score (Frailty = CSHA Clinical Frailty Scale’s score >4; serious multimorbidity = Charlson score ≥4). Prevalence and its confidence interval (CI) 95% were evaluated through the Agresti’s method for proportions. The relation between frailty and multimorbidity was studied through a logistic regression model adjusted for age and sex.
Results: Fifty-three physicians were enrolled, whose population of elderly individuals (N = 82919) was highly representative of the population of Veneto. The prevalence of frailty in the randomized sample of 2407 older people was 23.18% (CI 95%: 21.53%–24.91%). Sex was shown to be a strong predictor of frailty (female status OR = 1.58 p < .0001) and multimorbidity was shown to be an independent predictor only for individuals <85 years of age.
Conclusions: In Veneto, more than 20% of elderly people are frail. Physicians should pay close attention to frailty and multimorbidity because both are important prognostic factors toward clinical endpoints relevant to territorial care. The CSHA Clinical Frailty Scale (easy and quick) should become part of their professional routine.
Introduction
Frailty and multimorbidity represent the more important hallmarks of aging and they are a primary concern about the care of older adultsCitation1. Today, there is an unanimous agreement that frailty should be considered a condition in its own right. Frailty represents an independent risk factor for numerous endpointsCitation2,Citation3 and it must be clearly distinguished from the conditions of disability and multimorbidity, equally important and independent but often superimposed on itCitation4.
The frequent overlap of the three conditions makes the classification of these patients very complex. For example, in a Canadian study of 740 elderly the frail subjects (7.4%) 29.1% were disabled on the ADL scale and 92.7% on the IADL scale and 81.8% were characterized by significant multimorbidityCitation4.
The conceptual and operational definition of frailty and the respective models are very different. Although some authors point out the relative independence between frailty and multimorbidityCitation4, the issue is complex. For example, many definitions of frailty also take into account the presence of multimorbidity or disability. These conditions can to be independent endpoints but at the same time can themselves predispose to a greater risk of frailtyCitation3. So, the debate on whether incorporating multimorbidities or disabilities in the scales is still open.
In fact, the multimorbidity as a frailty item generally represents a share of irreversible frailty (eg: stroke, osteoporosis): that does not conform to the concept of a reversible and dynamic condition, accepted by other authorsCitation5.
Furthermore, the frailty models adopted by researches are extremely heterogeneous, while in some researches disability is considered as an outcome and in others as a determinant of the frailty status.
The prevalence of frailty shows to be so very heterogeneous, depending on the definition adopted and the tools used for measuring itCitation6–9. Few data are available about the Italian territorial settingCitation10–17. LiottaCitation10 evaluated a random sample of 1331 community-dwelling older adults resident in the Lazio-Region of Italy. In this study, a validated questionnaire (the Functional Geriatric Evaluation questionnaire) was administered by trained public health nurses. Prevalence of frail (FS ≥ 10, ≤50) and very frail (FS < 10) individuals was 13.9% and 7.6%, respectively.
RoppoloCitation11 examined 267 community-dwelling older adults trough Cardiovascular Health Study (CHS) index and the Tilburg Frailty Indicator (TFI), showing that frailty prevalence rate was strictly dependent on the index used (CHS = 12.7%; TFI = 44.6%). Other Italian experiences investigated the prevalence in the general population of particular forms of frailty (Cognitive FrailtyCitation12,Citation13; Osteoporotic Criteria for frailtyCitation14,Citation15) or investigated the prevalence of frailty in particular clinical conditions (dementiaCitation16) or in hospital settingsCitation17.
The study of the territorial distribution of frailty and multimorbidity is essential for important welfare implications. In Italy, the interventions targeting chronicity are mainly based on the treatment of diseases: sufficient epidemiological literature is available about these strategies.
For example, for the Veneto-Region, prevalence data on the entire population are available for 50 types of cancer, for chronic renal failure, diabetes, Chronic Obstructive Pulmonary Disease (COPD), rare diseases, celiac diseaseCitation18.
Much less is known about the territorial distribution of social factors that are important determinants of frailty and that are not necessarily associated with diseases. To our knowledge, prevalence studies on frailty based on representative samples of the territorial setting in Italy are very fewCitation10,Citation11.
The primary objective of our research was to estimate the prevalence of frailty in the older population (i.e. 65+ years) normally assisted by 53 general practitioners in Veneto (Italy). Our study evaluated both community-dwelling and institutionalized people, since Italian general practitioner follow both these kinds of patients.
Secondary objectives were to estimate that prevalence in subgroups categorized by age and sex. Third objective was to explore the relationship between frailty and multimorbidity in order to test the extent to which multimorbidity can in itself be a prognostic factor of frailty.
Subjects and methods
Our research is an observational cross-sectional study.
Some general practitioners who work in Veneto have been enrolled on a voluntary basis. Everyone had to use the same professional software (MillewinR)Citation19.
The 53 doctors involved in the initiative were members of the Scientific Society “Societa’ Italiana di Medicina Generale e delle Cure primarie” (SIMG) or sympathizers.
Data of recruited patients were anonymously collected (only the physicians knew the identity of the patients – see below) and were treated in compliance with the laws that regulate privacy and execution of observational research in Italy.
In Veneto, the general practitioners assist this type of older adults: 1. patients who are able to autonomously reach the doctor's office 2. home-dwelling patients who are unable to walk (followed up with home visits) 3. institutionalized patients in nursing homes. All these seniors (i.e. aged 65 and over) constituted the research population of our study.
Each researcher received and decrypted a list of centrally randomized patients. If codes were of deceased patients or for other reasons no longer assisted by the doctor, the researcher had to replace them in casual mode in the manner described in Appendix C.
Frailty was measured through the CSHA Clinical Frailty ScaleCitation20, particularly suitable for the professional routine in a general practice. The CSHA Clinical Frailty ScaleCitation20 scale allows to calculate a score ranging from one to seven (one: best state, seven: worst state), being the frailty status defined by a score >4. This instrument was well validated both in reliability and in predictive valueCitation6.
The multimorbidity was evaluated through the Charlson Index (CCI)Citation21, defined by the presence/absence of 23 conditions characterized by different prognostic weights; a CCI ≥4 characterizes a condition of multimorbidity with clinical significanceCitation22.
The research took place in two phases.
In the first phase, a unique dataset was constructed, represented by the whole population in charge of the recruited physicians.
Anonymized data were extracted from records of individual physicians through a custom SQL query (details on request). This was built to obtain, in addition to the personal data of all assisted patients (sex, date of birth), also the data relevant to the 23 conditions necessary to calculate the Charlson IndexCitation21. Each condition was defined through ICD-9 codesCitation23,Citation24 (see also Appendix B). The individual patient data were rigorously anonymous in compliance with the current Italian legislation. To judge whether the population assisted by the physicians involved was representative of the general population of Veneto, we compared the composition in sex and age-decades with the official data provided by the regionCitation25. The comparison was made using both graphic methods and formal statistical tests.
In the second phase, we extracted a random sample of 65+ people from the dataset that we constructed as described for the first phase using a randomization stratified by sex and three classes of age (65–74; 75–84; ≥85). Then, we assigned to physicians their randomized patients identified by an anonymous code. Each doctor decrypted the codes using a utility that we provided and assessed each patient's frailty status using the CSHA Clinical Frailty ScaleCitation20 (details on request). We evaluated the quality of the randomization process comparing the distribution of three classes of age (65–74; 75–84; ≥85) between the entire 65+ aged population and the randomized sample of patients evaluated through the CSHA Clinical Frailty ScaleCitation20. The comparison was made both graphically and through statistical approach.
Researchers agreed to participate to our research on voluntary basis; therefore, we did not know the quality of their medical records. This problem does not concern the information of frailty status (because all of them received the same instructions) but rather the coding of the necessary 23 conditions for the calculation of the Charlson scoreCitation21, that we had to use for evaluating the relationship between frailty and multimorbidity. For this reason, we evaluated the quality of medical input using an indirect way (Appendix D).
Statistical analysis
We calculated the sample size accepting a usual level of confidence (95%) and programming a relative precision of ±30%. The expected prevalence of frailty that we used in the calculations referred to the proportions of frail individuals detected in three age strata by a cross-sectional study cited by RockwoodCitation26,Citation27. After correction for finite populationCitation28 the theoretical sample size corresponded so to 1808 65+ aged individuals. We took into account a drop-out of 20% of physicians, increasing so the sample size to 2260 individuals. The prevalence of 65+ age-stratum in an epidemiological dataset of primary-care medical records in Veneto region is 25.47% (MilleinReteCitation29) so the general population capable of generating 2260 elderly was 8873 units. Assuming that a doctor could not examine more than a tenth of his elderly pool, the population necessary to research amounted to 88732 individuals. That is, admitting that an Italian general practitioner assists 1500 patients on average, 59 general practitioners seemed to be necessary for our research.
We compared the distribution of age-strata between different populations using both graphic methods and formal (Kolmogorov and Smirnov) statistical testsCitation30,Citation31.
We evaluated the prevalence of the frailty and its CI 95% in our randomized sample through the Agresti’s method for proportionsCitation32.
We standardized the frailty prevalence by sex and five classes of age (≥65 < 70, ≥70 < 75, ≥75 < 80, ≥80 < 85, ≥65) using the official data provided by the Veneto regionCitation25.
We studied the relation between frailty and multimorbidity through a logistic regression model considering as covariates age, sex and comorbidity.
All analyses were done using STATA14 SE software.
Results
The first phase of the research took place in 18 days; the second in 13 days (for details see Appendix E).
Fifty-eight general practitioners agreed to be recruited; 53 doctors completed the research, so the general drop-out rate corresponded to 8.6% (i.e. less than half as expected).
The whole population assisted corresponded to 82919 individuals, with a prevalence of 26.32% of subjects aged 65+ (N = 21825). The distribution of five age classes of this population was almost perfectly comparable to that of the Veneto population illustrated by the official ISTAT dataCitation25 (Kolmogorov–Smirnov test p = .979 – details on request).
The researchers evaluated the frailty status in 2407 individuals ().
Table 1. Characteristics of the analyzed sample.
In detail, 2191 elderly patients were randomized; however, were finally evaluated through CSHA Fraity Scale 2407 subjects. Of these, 2072 had been selected through central randomization; other 335 were not randomized but were evaluated anyway: 119 replaced patients initially randomized but unavailable since dead or no longer assisted (they were chosen by the doctors as described above); the other 216 represented extra selections made in the presence of some ambiguous identification codes (they were selected in the same way).
Forty-nine of the 53 physicians were characterized by good quality of data-input (Appendix D); 2280 of the 2407 evaluated were patients of those (Appendix A). The sex and age-distributions in the whole sample of 65+ aged and in the evaluated and randomized subgroups were well balanced (Appendix A).
Of the 2407 individuals included in our research, 1393 (57.87%) were females; the proportions of women in the three classes of ages were: 54.76% (n = 621) for the stratum ≥65 < 75; 56.20% (n = 503) for the stratum ≥75 < 85; 71.16% (n = 269) for the stratum ≥85.
The distribution of CSHA Clinical Frailty Scale’sCitation20 scores in that sample is illustrated in ; the distribution of these values shows to be roughly bimodal.
Figure 1. Distribution of the Rockwoods scores in the 2407 65+ evaluated. For each category, the sum of the percentages gives 100.00%. The distribution of the values of the Rockwood’s frailty score shows to be approximately bimodal.
The crude prevalence of Frailty (CSHA Clinical Frailty ScaleCitation20 score >4) stratified by sex and three age-strata is illustrated in ; for the full sample corresponds to 23.18% (21.53%-24.91%): this estimation can be considered as primary result of our study.
Table 2. Age and sex distribution of the prevalence of Frailty Status Status (so definied by a Rockwoods score >4) in the sample of 2407 elderly individuals evaluated with the Rockwoods Clincal Frailty Scale (% value and 95% confidence Intervals).
Frailty shows to be more frequent in women respect to men both in the whole sample and in the age-strata. The crude prevalence in the whole sample (n = 2407) is 28.06% for women and 16.46% for men, while the values for age-strata are: F = 4.21% M = 2.88% for the age-stratum ≥65 < 70 (n = 587), F = 10.26% M = 8.94% for the age-stratum ≥70 < 75 (n = 547), F = 17.79% M = 14.29% for the ≥75 < 80 stratum (n = 536), F = 45.85% M = 28.57% for the ≥80 < 85 stratum (n = 359), F = 73.98% M = 55.05% for the ≥85 stratum.
The standardized prevalence of frailty using as standard population the official data of Veneto region (ISTAT 2017Citation25) and sex and five age-classes as covariates corresponds to 22.63% (21.24%–24.02%); see also Appendix F.
The prevalence of frailty status in some frequent clinical conditions are illustrated by .
We examined the relationship between frailty and multimorbidity after exclusion of four physicians, so the relationship was examined in a subsample of 2280 evaluated patients characterized by optimal data input in their medical records. This subsample was also used to estimate the prevalence of the clinical conditions illustrated in and to estimate the prevalence of the frailty in these conditions ().
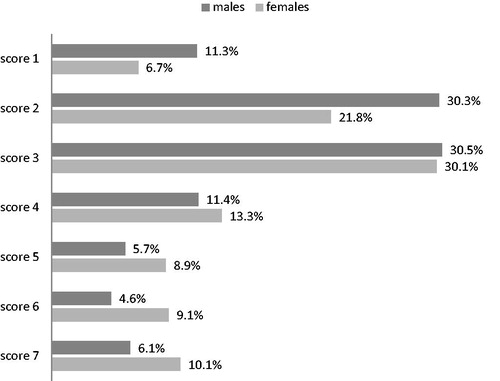
The prevalence of significant multimorbidity (i.e. of a Charlson Score ≥4) regards 21.62% of these 2280 elderly patients. The values of the Charlson Index measured in this subgroup ranged from 0 to 12. The proportions of the individual scores were as follows: score 0: 13.99%; score 1: 24.56%; score 2: 23.46%; score 3: 16.36%; score 4: 10.44%; score 5: 5.79%; score 6: 2.5%; score 7: 1.18%; score 8: 0.83%; score 9: 0.61%; score 10: 0.04%; score 11: 0.13%; score12: 0.09% .
illustrates the prevalence of five mutually exclusives categories. As can be seen, the prevalence of frailty shows to increase with age, while the prevalence of significant multimorbidity tends to decrease.
Figure 2. Prevalences of mutually exclusive combinations of frailty and serious comorbidity. Standardization for sex of five classes of age (standard population: Veneto’s official dataCitation25) – the combinations of frailty and multimorbidity illustrated by the graph are mutually exclusive: so, for each stratum of age the sum of the percentages gives 100.00%.
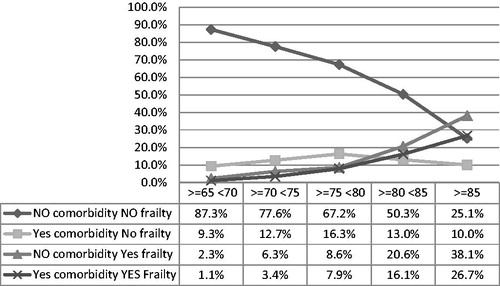
In detail, the proportions of patients without frailty and without significant multimorbidity (that is with Charlson score < 4 and Frailty score ≤4) showed a strong and progressive decrease with the advance in age. At the same time, the proportions of frail/not multimorbid patients (that is, with Charlson score <4 and Frailty score > 4) and frail/multimorbid patients (Charlson Score ≥4 and Frailty score >4) shows to increase with the advance in age. On the other hand, the proportions of multimorbid/not frail patients (Charlson Score ≥4 and Frailty score ≤4) show to increase with age up to the age group ≥75 < 80 and then to decrease ().
Of the 1787 patients characterized by a not significant multimorbidity (Charlson score <4) 311 (17.40%) were frail; conversely, of the 493 patients characterized by significant multimorbidity (Charlson Score ≥4) 279 (56.59%) were not.
We explored the details of the relationship between frailty and multimorbidity through three models of logistic regression () in which the condition of frailty was the outcome and age, sex and multimorbidity were the predictors. The model with interaction shows the best goodness of fit and the best response to model-diagnostics (). To be a female shows to be strongly associated to the frailty status (OR = 1.58 p < .0001). Also, multimorbidity status (i.e: a Charlson score ≥4) shows to be an independent frailty-predictor but not in the most advanced ages: the variable “age” acts in fact as an important confounder toward multimorbidity. The statistical study of the interaction age/multimorbidity demonstrates for the multi-morbid subjects (i.e. with Charlson score ≥4) OR of frailty = 4.21 (p < .0001) for <85 people and OR = 1.42 (p = 0.149) for ≥85 people (see footnote of for details).
Table 3. Univariate and multivariate logistic regression models exploring the relationship between frailty (i.e.: Rockwood score >4) and comorbidity (i.e.: Charlson Score ≥4).
illustrates the prevalence of the state of fragility in some common chronic diseases.
Discussion
By our knowledge, this research represents the first Italian experience in which the prevalence of the frailty was examined through the CSHA Clinical Frailty ScaleCitation20 in a random sample of older people representative of the general population.
These seniors are geriatric patients normally followed by the general practitioners in office, at home or in nursing home.
Few Italian studies evaluated the territorial distribution of the frail elderly patientsCitation10–14,Citation17. Instead there is a wide variety of literature about the prevalence of chronic diseases; for the Veneto region, for example, very solid data are availableCitation18. Nevertheless, the identification of frail patients appears essential, insofar as the determinants of frailty can be also very different from those of the multimorbidityCitation3,Citation5. So, the activation of territorial assistance networks based only on the management of the chronic diseases may be insufficient, being the frailty a risk factor of death and institutionalizationCitation3,Citation5.
Our research has attempted to contribute to the dissemination of knowledge in this field using a toolCitation20 validated in terms of predictability and reproducibility but at the same time very simple, usable without excessive loss of time during the daily care practice.
We did not find Italian experiences in the territorial setting that have used the CSHA Clinical Frailty ScaleCitation20, but we found two international studies conducted through that tool on similar classes of ages,Citation33,Citation34.
In our experience, more than a fifth of the older people (23.18%) shows to be frail.
Nongeriatric physicians are more familiar with the problems related to multimorbidity compared to the problems related to the frailty, because the frailty is often associated with psycho-social determinantsCitation5: these determinants do not belong to the physical domain, which is the main object of the medical profession. For this reason, territorial epidemiological researches have more focused on the prevalence of diseases compared to the prevalence of frailty.
In our opinion, the choice to generate a random sample from the pool of people assisted by physicians recruited in our research is a good compromise between the need to work with a representative sample and to avoid the problems of compliance that inevitably arise with other better methods of investigation for a prevalence study, such as evaluations of people sampled from electoral lists: the big sample that constitutes the population assisted by the doctors is very similar to that of Veneto in terms of distribution of the two sexes and of the five age classes taken into consideration.
In fact, one of the more important problems linked to a low compliance to medical or telephone interviews is a type of selection bias known as healthy user biasCitation35. Data from sicker or more depressed patients can be missing due to unavailability (such as for institutionalized patients) or due to their refusal of the interview. This bias in our case could severely underestimate the prevalence of frailty.
This consideration could explain the difference in the results between our research and other studies conducted with the CSHA Clinical Frailty ScaleCitation20 Ge and collCitation33 assessed the prevalence of frailty in a random sample of families in the Central region of Singapore: trained interviewers evaluated 520 older people (mean age: 70.46) through the CSHA Clinical Frailty ScaleCitation20 .The prevalence of frailty was 13.07% (10.43%–16.26%), but 46.7% of eligible patients dropped-out. ChangCitation34 assessed the frailty status via telephonic interview in a random sample of 845 older people (mean age 70.9 years). The estimated prevalence of frailty was 11.0% (95%CI 9.06, 13.3) but compliance reached only 29.1% (drop out: 70.9%).
We instead obtained a compliance of 100% of the sample because the frailty of each patient was evaluated by her own physician, well informed about the physical and psycho-social problems of his patients, all important determinants of frailty status.
The level of compliance reached in our study could reasonably rule out the presence of healthy user bias.
It is noteworthy that our sample shows a higher prevalence of depressive status (17.82% vs 9.26%Citation33: it is possible that depressed patients, characterized by a prevalence of frailty of 32.4% () refused interview more often than nondepressed subjects. Moreover, we noted a bimodal distribution trend of the Frailty Score of the CSHA Clinical Frailty ScaleCitation20 (), like other AuthorsCitation20. This distribution could suggest the presence of two distinct groups in the population: a group of community-dwelling older adults and a group of institutionalized older peopleCitation20. The risk of being frail and dropping out the interviews is differential in the two groups, being higher in institutionalized than in community-dwelling patients. This could have biased the estimate of frailty in studies based on interviews.
Table 4. The table illustrates the prevalence of frailty in some clinical condition in 2280 elderly people evaluated for frailty status and with optimal data input (see main text, see Appendix D).
In our study, frailty status shows to be more frequent in female (28.06% vs. 16.46%, prevalence ratio = 1.67 - ). This is coherent with the results of other studies (despite heterogeneous prevalence estimates): FriedCitation36 and SyddalCitation37 report for example a Female/Male prevalence ratio of 1.48 and 2.07, respectively.
Frailty status shows to be more frequent in older elderly persons, especially after 75y.
We noted a prevalence of 6.52%, 25.13% and 68.51%, respectively, in the ≥65-<75, ≥75-<85 and ≥85 age-stratum. In the ≥85 stratum 55.04% of males and 73.97% of females showed to be frail ().
Our observation is coherent with results of other studies. Fried reports prevalences of 3.2% in 65–70 years old patients, 9.5% in 75–79 years old patients, and 25.7% in 85–89 years old patientsCitation36. GeCitation33 reports prevalences of frailty (=CSHA Clinical Frailty ScaleCitation20 score >4) of 5.9% in 65–74 years old and 23.14% in over 75 years old patients in a subsample of 520 65+ older people. ChangCitation34 reports a prevalence of 4.59%, 11.60% and 18.42%, respectively, in 65–68 years old, in 69–73 years old and in 74–79 years old patients.
Our data () seem to suggest both a progressive increase of the prevalence of frailty and a trend to decrease of the prevalence of multimorbidity with advancing age; however, these results must be interpreted with caution.
Frailty and multimorbidity are in fact related in a complex way. Frailty develops with multisystem physiological decline, but it is possible that an individual is phenotypically frail without comorbidities. However, the effects of a single severe disease, either manifest or undiagnosed, could add further complexityCitation38. In our study, a significant multimorbidity status (Charlson score ≥4) shows to be an independent predictor of frailty only in people aged ≤85 years.
The cross-sectional design of our study limits after all the conceivable consideration about the true relationship between frailty and comorbility. Anyway, if both frailty and co-morbidity are important and independent prognostic factors for death, a severe co-morbidity could play a role, because sicker patients in the oldest strata could already be dead.
The condition of multimorbidity can moreover to be associated with a prognosis quoad vitam more serious than the condition of frailty.
In our experience (), frailty status shows to be particularly frequent in some common chronic clinical conditions. About a quarter of hypertensive patients are frail, as well as about one-third of diabetics and of patients affected by cerebrovascular/coronary disease or depression. Moreover, about half of patients affected by chronic heart failure and about 90% of patients with dementia shows to be frail.
For this reason, it is important that care networks are developed to address both clinical determinants of disease and psycho-social determinants of frailty.
Strength of our research
We analyzed a stratified random sample that is highly representative of a population that was representative in turn of the general population of Veneto, so we are reasonably confident about our inferences.
The tool we used for estimating frailty (CSHA Clinical Frailty ScaleCitation20) is very simple to apply (only few seconds for every known patient), it provides reproducible results and it is well predictive of important geriatric outcomes. Our not sponsored study was simply to implement, so it was executed quickly and with motivation by all recruited Physicians, with very low rates of medical drop-out.
Limitations of our research
The best approach for a cross-sectional study of prevalence should consider a random sample directly extracted from the general population (i.e. by means of electoral or telephone directories), but this can be very expensive and exposes to problems like poor compliance and healthy user bias.
We used a tool that was rarely applied in prevalence studies of frailty status. For this reason, our results could be compared only with those of two other experiences. However, we believe that our contribution could be extended to other settings, since the CSHA Clinical Frailty ScaleCitation20 tool is easy to use in the real world of the primary care.
The historical data that we used to calculate the Charlson Score can be biased by heterogeneity in the quality of the input of the physicians that we enrolled. Nevertheless, we tried to select the best data comparing the prevalence of the diseases with those of a validated benchmarking.
We are planning a second phase of the research aimed at evaluating the individual frailty determinants in the sample we have recruited; in this occasion we will take into account also other important covariates (i.e. admission to a nursing home).
Conclusions
Our research shows that one in five elderly people in Veneto is affected by frailty. Often physicians focus more on morbidity than on psychosocial factors of older people. Nevertheless, the individuation of frail individuals is important because frailty is a predictor of death and other geriatric endpoints but often it is a reversible condition.
Physicians should pay close attention both to frailty and comorbidity. Frailty is easy to measure with the scale we used. The use of the CSHA Clinical Frailty ScaleCitation20 should become part of the routine of the general practitioners.
Transparency
Declaration of funding
There is no funding to declare for this study.
Declaration of financial/other relationships
The authors have no financial or other relationships to disclose. JDA peer reviewers on this manuscript have no relevant financial or other relationships to disclose.
We thank the following general practitioners for actively participating as researchers of the Veneto Study Group on the Elderly:
Pirolo Giulio, Balzan Corrado, Barilla Giuseppe, Buzzatti Agostino, Cassol Maria Antonia, Mazzorana Michela, Scarrocchia Luisa, Zollino Maria Luciana, Cabri Giovanni, Dolci Alberto, Tonello Paolo, Franchini Carlo Andrea, Fracasso Isabella, Casalena Michele, Dima Catia, Givanni Silvana, Marrocchella Raffaella, Menini Ernesto, Micchi Alessio, Pastori Caterina, Sciortino Maurizio, Cancian Maurizio, De Conto Umberto, Antiga Gianluigi, Camarotto Antonio, Camerotto Antonio, Dalla Zentil Giovanni, Mulato Giuseppe, Pantaleoni Nicola, Peccolo Franco, Penco Claudio, Pieropan Franco, Pregnolato Umberto, Redetti Marina, Zorgno Nadia, Musto Martina, Michieli Raffaella, Bergamasco Giulio, Blundetto Emanuela, De Zan Antonio, Moressa Maria Pia, Ongaro Andrea, Severi Sandro, Spinardi Francesco, Franco Novelletto Bruno, Bordin Anna, De Gobbi Riccardo, Fanton Livio, Fraccaro Bianca Maria, Franzoso Federico, Merola Gennaro, Bordin Anna, Simioni Giuliana
Acknowledgements
We are grateful to the following people for the important contribution of recruiting researchers:
Musto Martina, Carraro Alessandro, Pirolo Giulio, Ioverno Enrico, Franchini C Andrea, De Conto Umberto.
References
- Weiss CO. Frailty and chronic diseases in older adults. Clin Geriatr Med. 2011;27:39–52. https://www.ncbi.nlm.nih.gov/pubmed/21093721
- Hogan DB, MacKnight C, Bergman H. Steering committee. Canadian initiative on frailty and aging. Models, definitions, and criteria of frailty. Aging Clin Exp Res. 2003;15:1–29. https://www.ncbi.nlm.nih.gov/pubmed/14580013
- Abellan van Kan G, Rolland Y, Houles M, et al. The assessment of frailty in older adults. Clin Geriatr Med. 2010;26:275–286. https://www.ncbi.nlm.nih.gov/pubmed/?term=assessment%5Bti%5D+and+275%5Bpg%5D+and+frailty%5Bti%5D
- Wong CH, Weiss D, Sourial N, et al. Frailty and its association with disability and comorbidity in a community-dwelling sample of seniors in Montreal: a cross-sectional study. Aging Clin Exp Res. 2010;22:54–62. https://www.ncbi.nlm.nih.gov/pubmed/?term=wong%5Bau%5D+and+frailty%5Bti%5D+and+54%5Bpg%5D&report=docsum&format=text
- de Vries NM, Staal JB, van Ravensberg CD, et al. Outcome instruments to measure frailty: a systematic review. Ageing Res Rev. 2011;10:104–114. https://www.ncbi.nlm.nih.gov/pubmed/?term=%22Outcome+instruments+to+measure+frailty%3A+A+systematic+review%22+and+104%5Bpg%5D
- Ravaglia G, Forti P, Lucicesare A, et al. Development of an easy prognostic score for frailty outcomes in the aged. Age Ageing. 2008;37:161–166. https://www.ncbi.nlm.nih.gov/pubmed/18238805
- Ensrud KE, Ewing SK, Taylor BC, et al. Comparison of 2 frailty indexes for prediction of falls, disability, fractures, and death in older women. Arch Intern Med. 2008;25:168382–168389. https://www.ncbi.nlm.nih.gov/pubmed/?cmd=HistorySearch&querykey=46
- Rothman MD, Leo-Summers L, Gill TM. [Database] Prognostic significance of potential frailty criteria. J Am Geriatr Soc. 2008;56:2211–2216. https://www.ncbi.nlm.nih.gov/pubmed/19093920
- Hilmer SN, Perera V, Mitchell S, et al. The assessment of frailty in older people in acute care. Australas J Ageing. 2009;28:182–188. https://www.ncbi.nlm.nih.gov/pubmed/?term=hilmer%5Bau%5D+and+acute%5Bti%5D+and+182%5Bpg%5D
- Liotta G, O’Caoimh R, Gilardi F, et al. Assessment of frailty in community-dwelling older adults residents in the Lazio region (Italy): a model to plan regional community-based services. Arch Gerontol Geriatr. 2017;68:1–7. https://www.ncbi.nlm.nih.gov/pubmed/?term=liotta%5Bau%5D+and+1%5Bpg%5D+and+2017%5Bdp%5D
- Roppolo M, Mulasso A, Gobbens RJ, et al. A comparison between uni- and multidimensional frailty measures: prevalence, functional status, and relationships with disability. Clin Interv Aging. 2015;22:10:1669–1678. https://www.ncbi.nlm.nih.gov/pubmed/?term=Roppolo%5Bau%5D+and+1669%5Bpg%5D+and+2015%5Bdp%5D
- Solfrizzi V, Scafato E, Lozupone M, et al. Italian longitudinal study on aging working group. additive role of a potentially reversible cognitive frailty model and inflammatory state on the risk of disability: the Italian longitudinal study on aging. Am J Geriatr Psychiatry. 2017;25:1236–1248. https://C.nih.gov/pubmed/?term=solfrizzi%5Bau%5D+and+1236%5Bpg%5D+and+2017%5Bdp%5D
- Roppolo M, Mulasso A, Rabaglietti E. Cognitive frailty in Italian community-dwelling older adults: prevalence rate and its association with disability. J Nutr Health Aging. 2017;21:631–636. https://www.ncbi.nlm.nih.gov/pubmed/?term=roppolo%5Bau%5D+and+631%5Bpg%5D+and+2017%5Bdp%5D
- Bilotta C, Casè A, Nicolini P, et al. Social vulnerability, mental health and correlates of frailty in older outpatients living alone in the community in Italy. Aging Ment Health. 2010;14:1024–1036. https://www.ncbi.nlm.nih.gov/pubmed/?term=bilotta+%5Bau%5D+and+1024%5Bpg%5D+and+2010%5Bdp%5D
- Bilotta C, Bergamaschini L, Nicolini P, et al. Frailty syndrome diagnosed according to the Study of Osteoporotic Fractures criteria and mortality in older outpatients suffering from Alzheimer's disease: a one-year prospective cohort study. Aging Ment Health. 2012;16:273–280. https://www.ncbi.nlm.nih.gov/pubmed/?term=bilotta%5Bau%5D+and+273%5Bpg%5D+and+2012%5Bdp%5D
- Solfrizzi V, Scafato E, Frisardi V, Italian Longitudinal Study on Aging Working Group, et al. Frailty syndrome and all-cause mortality in demented patients: the Italian Longitudinal Study on Aging. Age (Dordr). 2012;34:507–517. https://www.ncbi.nlm.nih.gov/pubmed/?term=solfrizzi+%5Bau%5D+and+507%5Bpg%5D+and+2012%5Bdp%5D
- Perna S, Francis MD, Bologna C, et al. Performance of Edmonton Frail Scale on frailty assessment: its association with multi-dimensional geriatric conditions assessed with specific screening tools. BMC Geriatr. 2017;17:2. https://www.ncbi.nlm.nih.gov/pubmed/?term=perna%5Bau%5D+and+2%5Bpg%5D+and+2017%5Bdp%5D
- Saugo M, Pigato M, Avossa F, et al. Relazione Socio Sanitaria della Regione del Veneto – anno 2015 https://www.ser-veneto.it/public/RSSR_Veneto_2015.pdf
- Millennium SRL (access 15 June 2018) https://www.millewin.it/
- Rockwood K, Song X, MacKnight C, et al. A global clinical measure of fitness and frailty in elderly people. CMAJ. 2005;173:489–495. https://www.ncbi.nlm.nih.gov/pubmed/16129869?report=docsum&format=text[Mismatch]
- Charlson ME, Charlson RE, Peterson JC, et al. The Charlson comorbidity index is adapted to predict costs of chronic disease in primary care patients. J Clin Epidemiol. 2008;61:1234–1240. https://www.ncbi.nlm.nih.gov/pubmed/?term=The+Charlson+comorbidity+index+is+adapted+to+predict+costs
- Johnston MC, Marks A, Crilly MA, et al. Charlson index scores from administrative data and case-note review compared favourably in a renal disease cohort. Eur J Public Health. 2015;25:391–396. https://www.ncbi.nlm.nih.gov/pubmed/?cmd=HistorySearch&querykey=2
- Charlson ME, Pompei P, Ales KL, et al. A new method of classifying prognostic comorbidity in longitudinal studies: development and validation. J Chronic Dis. 1987;40:373–383. https://www.ncbi.nlm.nih.gov/pubmed/?term=charlson%5Bau%5D+and+pompei%5Bau%5D+and+1987%5Bdp%5D+and+373%5Bpg%5D
- Deyo RA, Cherkin DC, Ciol MA. Adapting a clinical comorbidity index for use with ICD-9-CM administrative databases. J Clin Epidemiol. 1992;45:613–619. https://www.ncbi.nlm.nih.gov/pubmed/?term=deyo%5Bau%5D+and+ciol%5Bau%5D+and+1992%5Bdp%5D+and+613%5Bpg%5D
- Statistiche Demografiche ISTAT http://demo.istat.it/pop2017/index.html
- Rockwood K, Howlett SE, MacKnight C, et al. Prevalence, attributes, and outcomes of fitness and frailty in community-dwelling older adults: report from the Canadian study of health and aging. J Gerontol A Biol Sci Med Sci. 2004;59:1310–1317. https://www.ncbi.nlm.nih.gov/pubmed/?cmd=HistorySearch&querykey=32
- Hogan DB, Fox RA. A prospective controlled trial of a geriatric consultation team in an acute-care hospital. Age Ageing. 1990;19:107–113. https://www.ncbi.nlm.nih.gov/pubmed/?cmd=HistorySearch&querykey=2
- West Chester University WCU Courses Server Roger Bove, Berenson directory (access: 15 June 2018) http://courses.wcupa.edu/rbove/Berenson/10th%20ed%20CD-ROM%20topics/section8_7.pdf
- Scuola Veneta di Medicina generale MilleinRete – il database della Medicina Generale del Veneto (access: 15 June 2018). https://www.svemg.it/milleinrete-il-database-della-medicina-generale-del-veneto/
- Kolmogorov AN. On the empirical determination of a law of distribution. Giornale Dell' Istituto Italiano Degli Attuari. 1933;4: 83–91.
- Smirnov NV. 1933. Estimate of deviation between empirical distribution functions in two independent samples. Bulletin Moscow University, 2:3–16 [cited by American Journal of Sports Science and Medicine. 2014, Vol. 2 No. 1, 6-16 DOI: 10.12691/ajssm-2-1-2]
- Agresti A, Coull BA. Approximate is better than “exact” for interval estimation of binomial proportions. Am Stat. 1998;52:119–126. http://www.math.unm.edu/∼james/Agresti1998.pdf
- Ge L, Yap CW, Heng BH. Prevalence of frailty and its association with depressive symptoms among older adults in Singapore. Aging Ment Health. 2018;16:1–6. https://www.ncbi.nlm.nih.gov/pubmed/?cmd=HistorySearch&querykey=41
- Chang CI, Chan DC, Kuo KN, et al. Prevalence and correlates of geriatric frailty in a northern Taiwan community. J Formos Med Assoc. 2011;110:247–257. https://www.ncbi.nlm.nih.gov/pubmed/21540007
- Shrank WH, Patrick AR, Brookhart MA. Healthy user and related biases in observational studies of preventive interventions: a primer for physicians. J Gen Intern Med. 2011;26:546–550. https://www.ncbi.nlm.nih.gov/pubmed/21203857
- Fried LP, Tangen CM, Walston J, et al. Cardiovascular Health Study Collaborative Research Group, Frailty in older adults: evidence for a phenotype. J Gerontol A Biol Sci Med Sci. 2001;56:M146–M156. https://www.ncbi.nlm.nih.gov/pubmed/?term=Sci+Med+Sci+2001%3B56%3AM146%E2%80%9356.
- Syddall H, Roberts HC, Evandrou M, et al. Prevalence and correlates of frailty among community-dwelling older men and women: findings from the Hertfordshire Cohort Study. Age Ageing. 2010;39:197–203. https://www.ncbi.nlm.nih.gov/pubmed/?cmd=HistorySearch&querykey=71
- Clegg A, Young J. The frailty syndrome. Clin Med (Lond). 2011;11:72–75. https://www.ncbi.nlm.nih.gov/pubmed/?term=clegg%5Bau%5D+and+frailty%5Bti%5D+and+72%5Bpg%5D
Appendices
Index
Appendix A – Age-distribution in the sample that was evaluated with CSHA Clinical Frailty Scale
Appendix B – Icd9-Codes For Charlson Comorbidity Index
Appendix C – Randomization And Selection Of Patients To Evaluate
Appendix D – Evaluation Of The Quality Of The Historical Data Registered By Researchers In Their Medical Record
Appendix E – Timing Of The Research Analysed Through Kaplan-Meier Estimator
Appendix F – Standardized Prevalence Of Frailty Status
Note: Bibliographical references refer to those mentioned in the main text unless otherwise specified
Appendix A
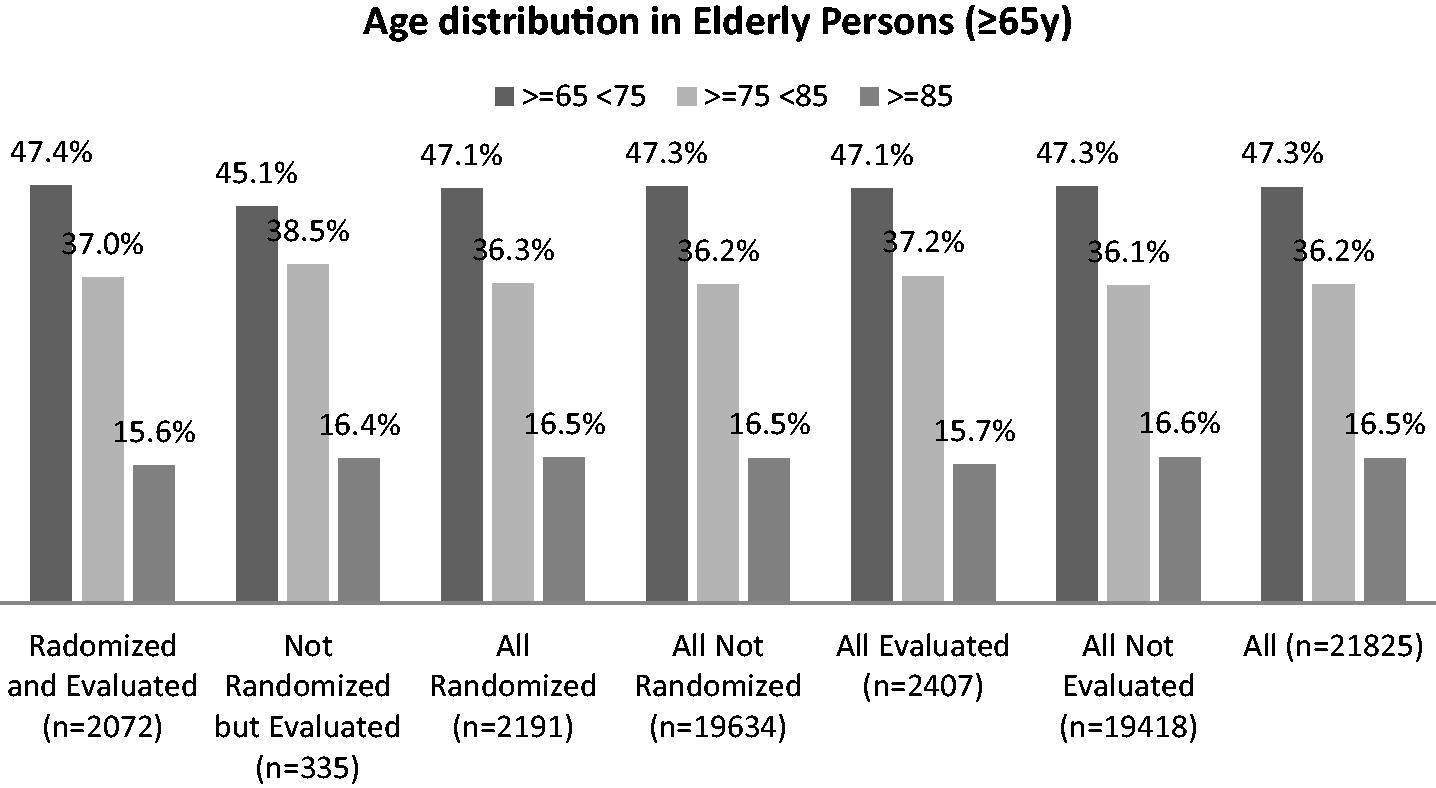
Appendix A– Age-distribution in the sample that was evaluated with CSHA Clinical Frailty Scale: comparison between the age classes of some groups of 65+ aged people
All age-distributions are similar: Kolmogorov-Smirnov tetst: Randomized and Evaluated vs Non randomized and Evaluated p = 0.997; Randomized vs Not randomized p = 1.00; Evaluated vs Not Evaluated p = 0.998. So, we can reasonably infer that the sample of evaluated patients is representative
Appendix B – ICD9-CODEfS or charlson comorbidity index
Twenty three codified conditions are necessary for the calculation of the Charlson Comorbidity Index in the version validated for primary care medicineCitation21. Each condition was defined for the 19 items pertinent to old version of the Charlson IndexCitation23 through the ICD-9 codes defined by DejoCitation24.
We report below the codes that we used for identify the other 4 conditions necessary for the calculation of Charlson Comorbidity Index in the version validated for primary care medicineCitation21 that were not cited by the original article of CharlsonCitation23
Depression: ICD-9: 311% 296.2% 296.3% 296.5% 300.4%
Use of warfarin ATC: B01AA03
Hypertension: ICD-9: 401-405.X
Skin ulcers/cellulitis ICD-9 707% 707.% 440.24 682.9 785.4
Appendix C – RANDOMIZATION and selection of patients to evaluate
The second phase of the research concerned the randomization of a sample of 65+ elderly people and the evaluation of their frailty status through the Rockwood scale. We extracted the random sample from the dataset that we constructed as described for the first phase (see text). Then, we assigned to physicians their randomized patients identified by the anonymous code. For this procedure, each doctor has initially extracted in an Excel sheet his entire population of 65+ aged through a second SQL query provided by us. Then, each doctor decrypted the codes of the patients assigned by the randomization using a utility that we also provided (as Excel worksheet) and assessed each patient's frailty status using the Rockwood scale. After the evaluation, he returned the list of his randomized patients, deleting the sensitive data and using the same anonymous code we used when sending. If some of the codes concerned deceased patients or for other reasons no longer assisted by the doctor, the researcher had to replace them with the adjacent 65-year-old patients in the list provided by us, first in the lower row and then in the upper row if the patient in the lower row was not analysable for any reason, and so on.
SQL syntax used for the selection of 65+ individuals
[SQL]
select distinct
p.codice codice,
n.pa_medi id_medico,
p.nascita data_nascita,
p.cognome cognome,
p.nome nome
from
pazienti p,
nos_002 n,
cart_pazpbl c
where p.nascita< '1952-06-30'and
p.codice = n.codice and
p.codice = c.codice and
p.pa_convenzione not like '%l%' and
(
p.decesso is null or p.decesso > '2017-12-31'
) and
(
n.pa_drevoca is null or n.pa_drevoca > '2017-12-31'
) and
n.pa_medi='DEMO_3Q'
order by codice;
Appendix D – EVALUATIONo f the quality of the historical data registered by researchers in their medical records
Researchers agreed to participate to our research on voluntary basis; so we did not know the quality of their medical records. This problem does not concern the relevant information of frailty status, (because all of them received the same instructions) but rather the coding of the necessary 23 conditions for the calculation of the Charlson comorbidity score, that we had to use for evaluating the relationship between frailty and comorbidity (see text). For this reason, we evaluated the quality of medical input using an indirect way. Firstly, we calculated for every physician the prevalence of each of the 23 conditions in his dataset. Secondly, for each physician we calculated the decile position for each of these prevalences among the entire pool of prevalences of all recruited physicians. Thirdly, for each physician we calculated the median of his 23 decile positions, assuming that physicians with lower < median score > were also characterized by the worst input. Fourthly, we ranked in deciles these < median scores > into the pool of all recruited physicians. Finally, for each class (=decile) of < median score > we compared the prevalence of significant comorbidity status (ie of a Charlson Score ≥4) in five age-classes with the same prevalences found in a benchmarcking-dataset of ∼140000 medical records (MilleinRete 2014Citation29) characterized by known high quality of input (i.e. of a median ITOT D1 score =0.74). Then we excluded the physicians belonging to the categories of < deciles of median score > where the difference in the distribution of the prevalence of a Charlson Score ≥4 was significant to the distribution statistics (see below). A total of 2,280 patients were assisted by the other (nonexcluded) 49 physicians characterized by good quality of data-input
Appendix D references not reported by main document
D1 Health Search
Istituto di ricerca della SIMG: Societa’ Italiana di Medicina Generale e delle Cure Primarie
VIII Rapporto Health Search anno 2013/2014
(access: 15 June 2018)https://healthsearch.it/documenti/Archivio/Report/VIIIReport_2013-2014/VIII%20Report%20HS.pdf
Appendix E - TIMINGo f the research analysed through kaplan-MEIER estimator
Appendix E - The first phase of the research took place in 18 days.
58 general practitioners agreed to be recruited; on the fourth day we received soon 50% of the individual datasets. Three doctors did not respond even after being solicited. So, 55 physicians began the second phase. Of them, 2 did not respond.
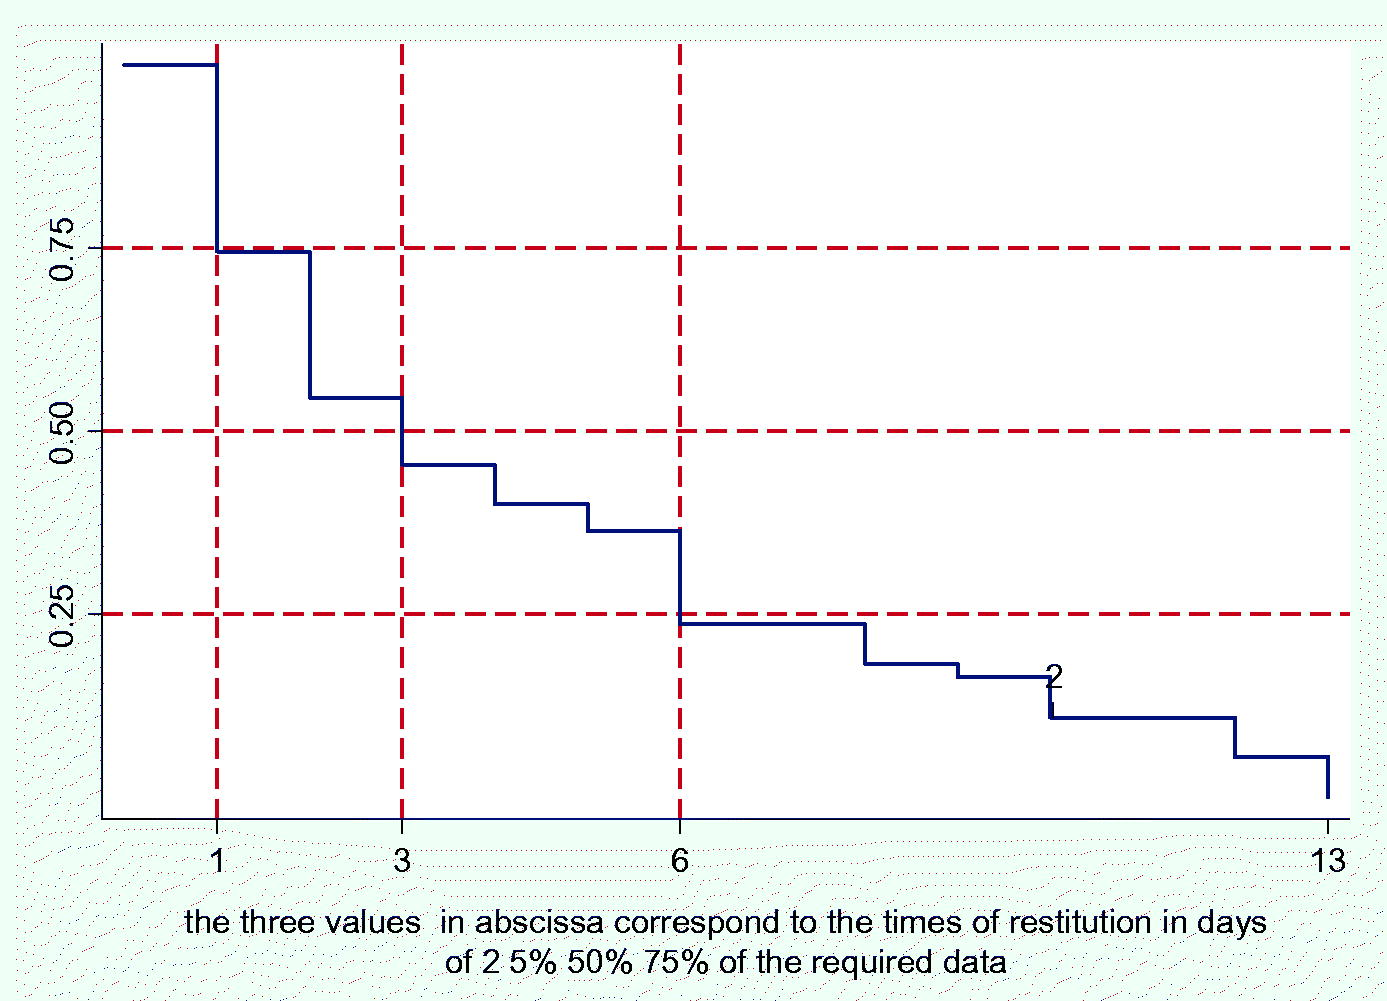
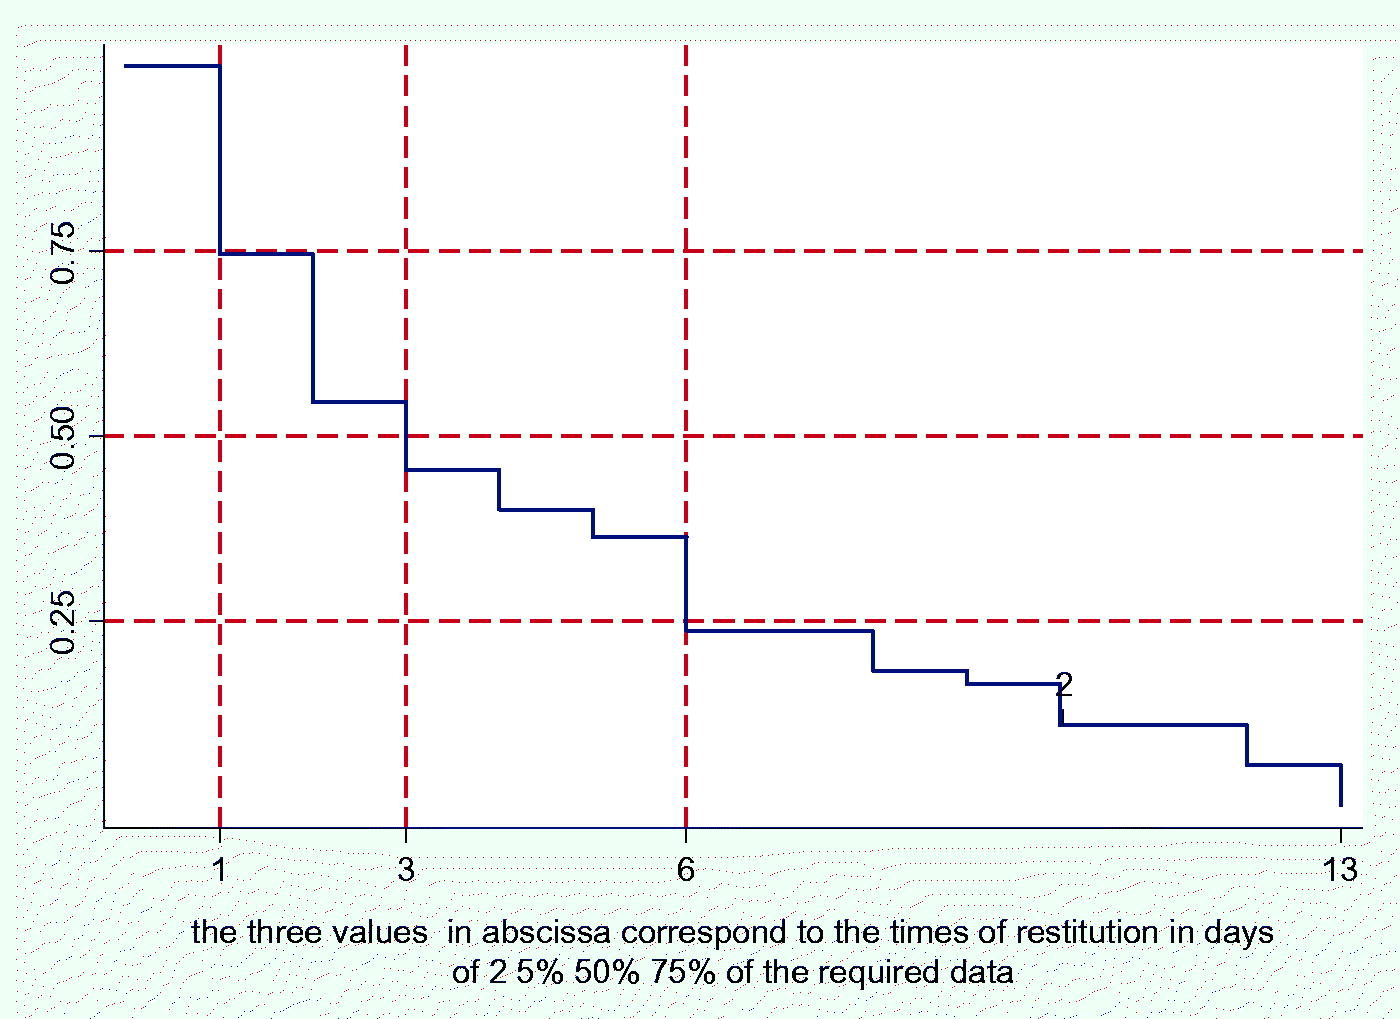
Appendix E – The second phase took place in 13 days; on the third day we received soon 50% of the individual frailty-evaluations.
So, 53 physicians completed our research.
Appendix F – STANDARDIZED prevalence of frailty status
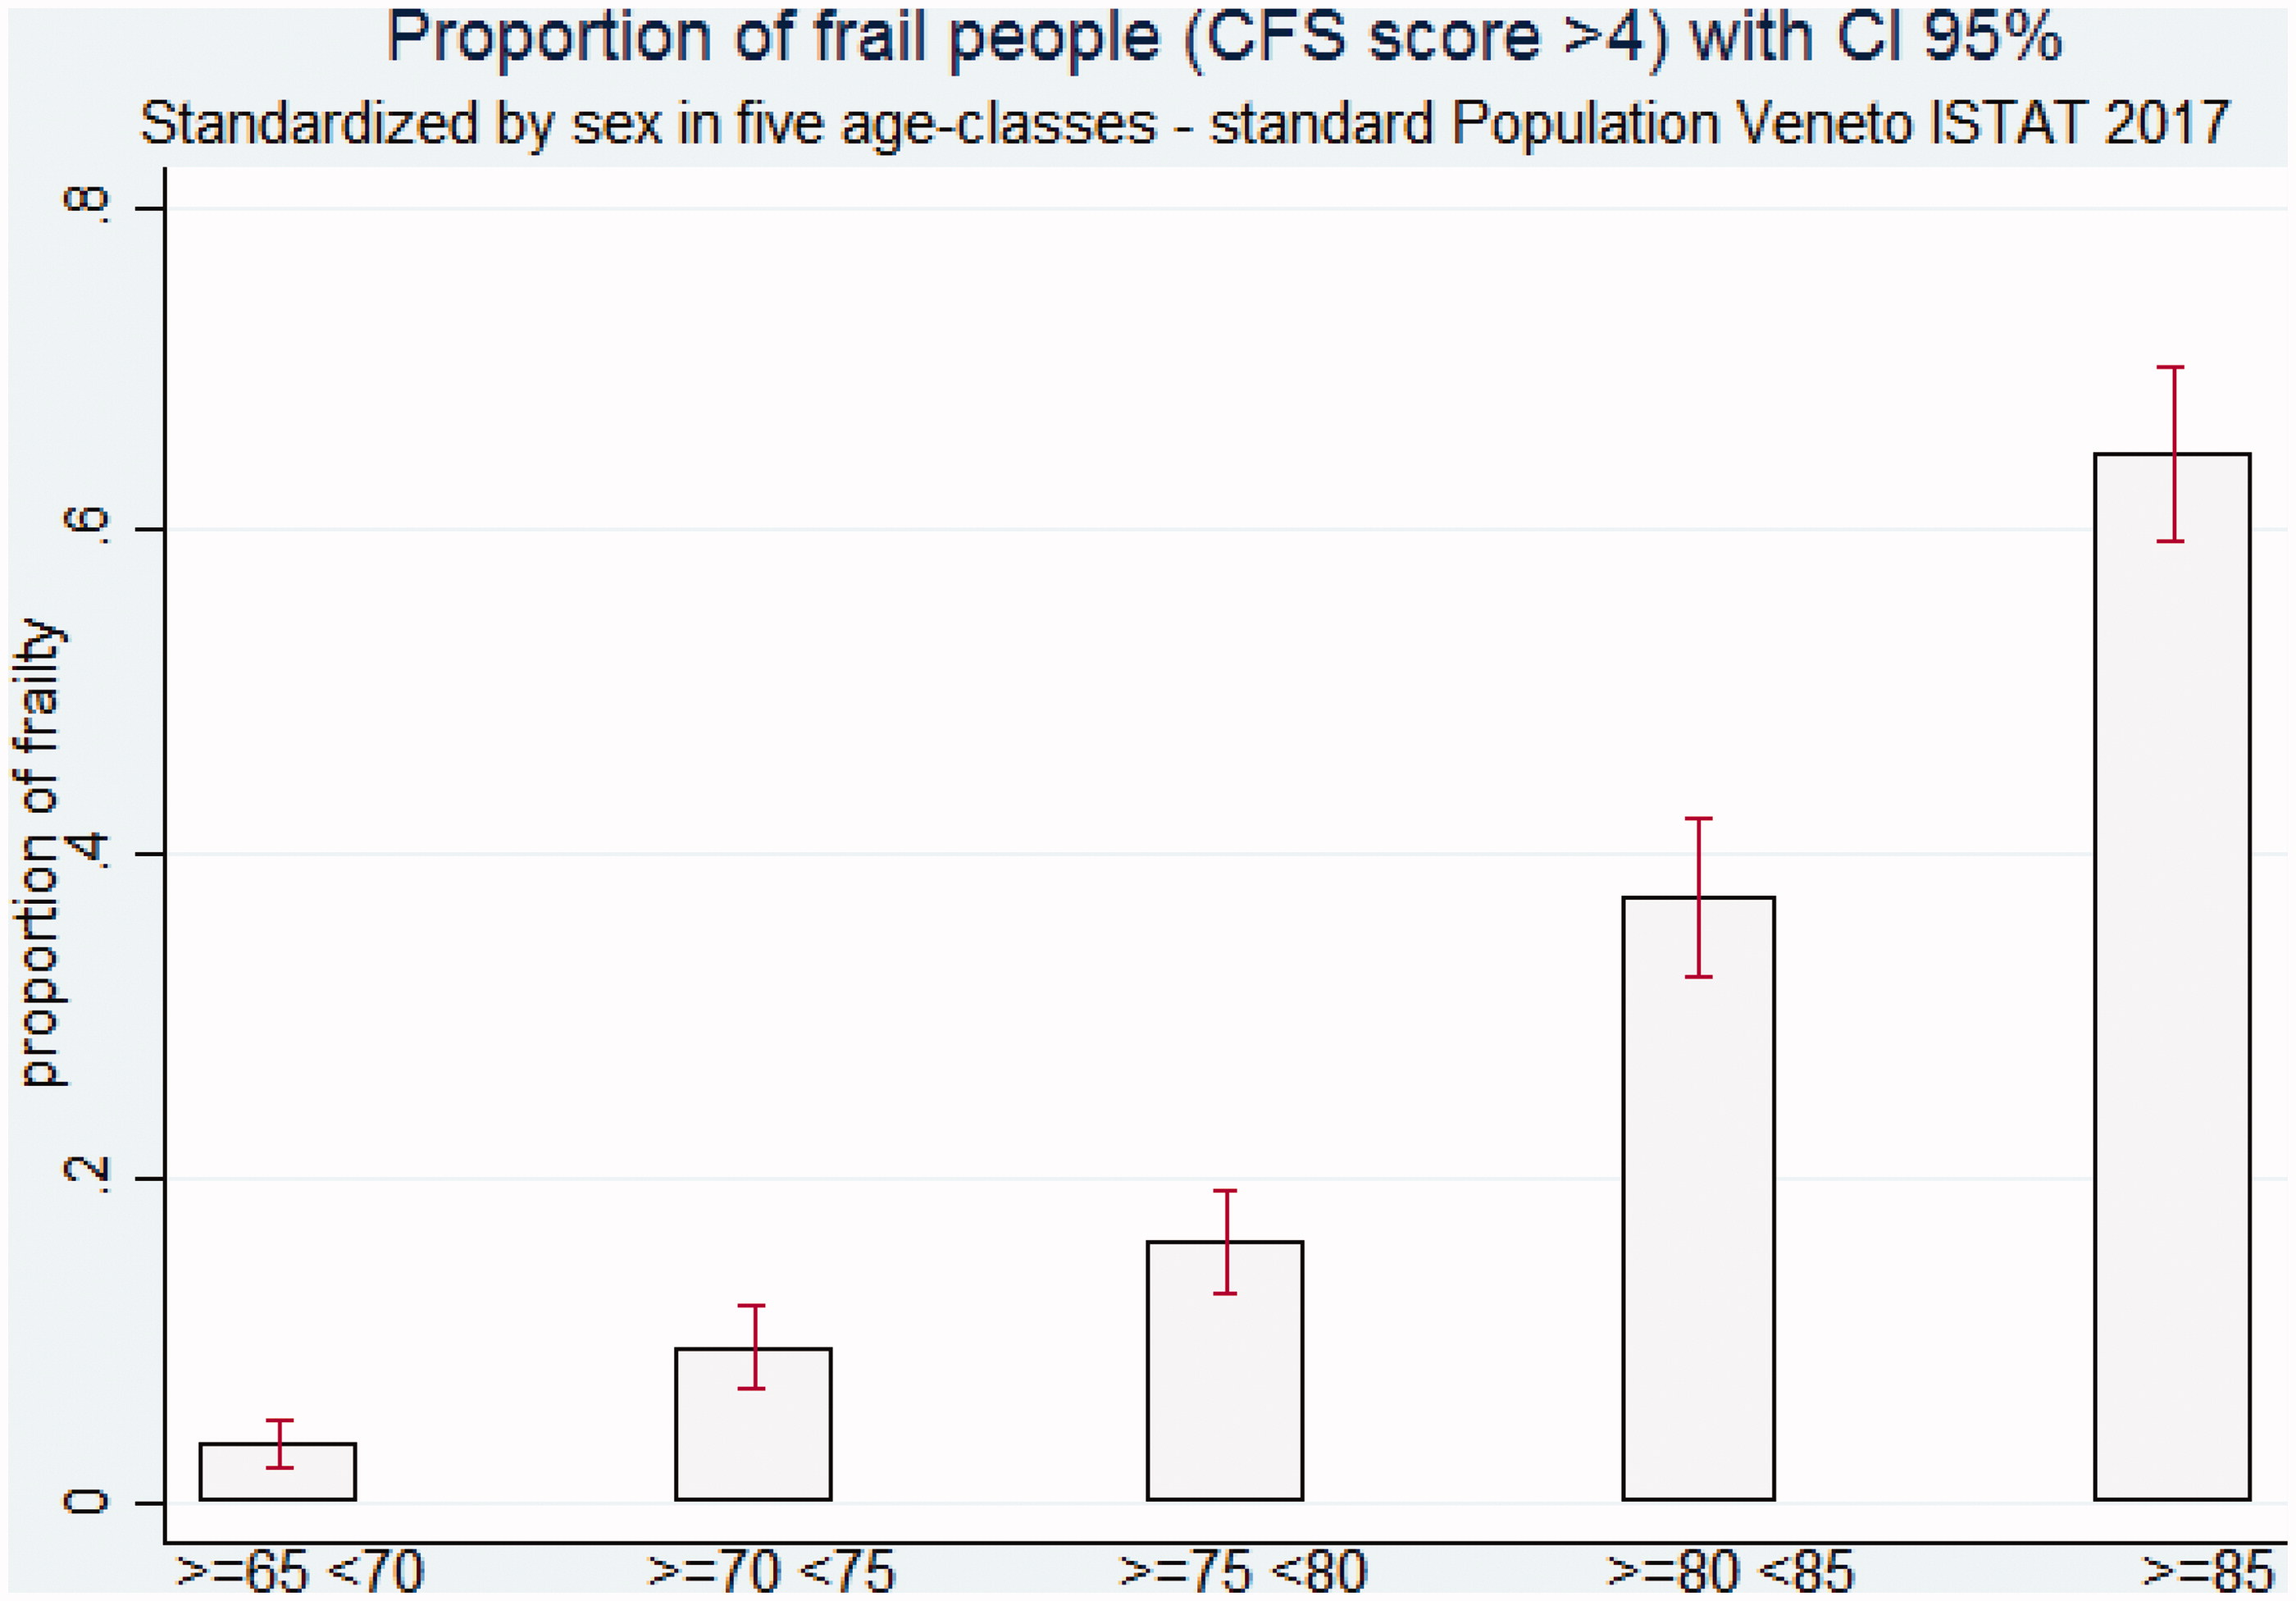
Appendix F (Table And Figure) prevalence of frailty (ie of Rockwood Score >4) standardised by sex in five strata of age (Standard population: official data of Veneto Region 2017(Veneto ISTAT 2017)Citation25