
Abstract
Objective: This study was conducted to determine the incremental healthcare resource utilization (HRU) and costs associated with relapse or recurrence (R/R) in patients with major depressive disorder (MDD) treated with antidepressants (AD) in US clinical practice.
Methods: In this retrospective cohort study, adult patients with MDD treated with a branded AD were selected from the Truven Health Analytics MarketScan Databases (January 1, 2004–March 31, 2015). Time to first indicator of R/R was described. Characteristics, HRU, and costs were compared between patients with and without R/R. Among patients with R/R, HRU and costs were also compared between the pre- and post-R/R period.
Results: From the 22,236 selected patients, 5,541 had ≥ 1 indicator of R/R and 16,695 did not. The 3-year R/R rate varied between 21.3% and 36.4% based on pattern of AD use (continuous, switch/augmentation, or early discontinuation). Patients with and without R/R presented different characteristics—notably, more intensive prior AD use and a higher comorbidity burden. HRU and costs were high in both patients with and without R/R but substantially higher among those with R/R ($20,590 vs $12,368 per-patient-per-year (PPPY); adjusted difference [aDiff] = $7,037), mainly driven by increased inpatient (IP) services (adjusted incidence rate ratio IP days = 3.95; aDiff IP costs = $3,433 PPPY). Among patients with R/R, emergency department visits, IP days, and IP admissions were over 2-times higher during the post-R/R period and total costs increased by over 50% from $19,267 to $29,419 in the post-R/R period.
Conclusions: The economic burden in MDD patients is substantial, but is significantly higher among those who experience R/R.
Introduction
Major depressive disorder (MDD) is one of the most common psychiatric disorders in the US. In 2016, ∼ 16.2 million Americans (6.7% of the total population) experienced at least one episode of MDD, according to the National Survey on Drug Use and Health (NSDUH)Citation1. MDD is a highly disabling disorder affecting both mental and physical functioningCitation2. In 2010, MDD was the second leading cause of global disability, accounting for 8.2% of global years lived with a disability in the USCitation3.
MDD has been shown to impose a substantial economic burden on all levels of society. The economic burden of MDD was estimated at $210.5 billion in 2010 in the USCitation4. While approximately half of this amount was due to direct medical costs, the other half was attributable to indirect costs related to absenteeism, presentism, and suicide, further underscoring the toll that MDD imposes on a patient’s lifeCitation4.
Treatment for MDD focuses on alleviating symptoms and functional impairments to improve patients’ quality-of-lifeCitation5,Citation6. Functional recovery is the ultimate treatment goal for patients with MDDCitation7. Guidelines recommend treatment for MDD to be personalized based on many factors that include disease symptoms and severity, medical history (e.g. presence of previous episodes of MDD), and patients’ preferencesCitation7. Management of MDD typically includes both psychotherapy and pharmacotherapy, with antidepressants (ADs) being the most commonly used pharmacological therapyCitation8,Citation9. Based on practice guidelinesCitation7, treatment plans should typically include three phases—(1) an acute phase, which aims to induce remission and restore normal functioning, (2) a continuation phase, during which patients who respond or achieve remission undergo continuation therapy to prevent relapses (i.e. the return of symptoms during the period of remission but before recovery), and (3) a maintenance phase to prevent disease recurrence (i.e. appearance of new episodes of MDD after recovery) in patients with chronic and/or recurrent MDD. However, not all patients receiving treatment achieve remission, and a substantial proportion of patients with MDD experience disease relapse or recurrence (R/R)Citation10–12. In fact, within 10 years after the first depressive episode, rates of recurrence have been reported to be as high as 85%Citation13.
Patients who experience R/R are likely to have a more complex disease profile due to an increased risk of suicidality and the presence of other comorbidities such as substance abuse, anxiety, and additional depressive disordersCitation13,Citation14 that require intensive healthcare resource utilization (HRU). As a result, the increased HRU is likely to increase the economic burden in this patient population. With the increasing prevalence of patients with MDD over the past decade and the high proportion of patients who experienced R/R, the economic burden associated with R/R is becoming a topic of greater concernCitation13. However, the economic burden of R/R in patients with MDD has not been assessed in the literature. Therefore, the objectives of this study were to describe and compare patient characteristics between those who did and did not experience R/R, and to estimate the incremental HRU and costs associated with R/R in patients with MDD who receive branded AD therapy in US clinical practice.
Methods
Data source
This study used data from the Truven Health Analytics MarketScan Databases (MarketScan) (January 1, 2004–March 31, 2015). The MarketScan databases include patient-level demographics, enrollment, and medical and pharmacy claim information on more than 50 million covered beneficiaries annually, including employees and their dependents, and Medicare-eligible retirees with employer-provided Medicare supplemental plans. Data are de-identified and fully compliant with the Health Insurance Portability and Accountability Act, thus, institutional review board approval was not necessary to conduct this study.
Sample selection
A diagnostic algorithm was used to define the sample population. To be included in this study, patients were required to have initiated one of the studied ADs and to have ≥ 2 claims of MDD (Internal Classification of Disease, Ninth Revision, Clinical Modification [ICD-9-CM] codes: 296.2x, 296.3x) within 6 months, with ≥ 1 claim for MDD within the 30 days preceding, or including the first prescription fill for, the studied AD (index date). Because the cost of ADs varies substantially between generic and branded agents, to select a sample of patients with a more homogenous cost structure, the list of studied ADs was limited to branded agents in 2015—that is, vortioxetine (Trintellix), levomilnacipran (Fetzima), vilazodone (Viibryd), and desvenlafaxine (Pristiq). Selected patients were also required to have continuous healthcare plan enrollment for at least 12 months before and after the index date, and be at least 18 years of age as of the index date. Patients were selected regardless of their line of therapy (e.g. first-line or second-line) at the time they were initiated on the studied AD and regardless of whether the AD was indicated as a monotherapy or part of a combination treatment regimen. The AD initiated on the index date was defined as the index AD (Supplementary Figure S1).
Patients were excluded if they had incomplete prescription information (e.g. with missing days of supply) for the index AD. To avoid bias from other specified psychiatric conditions, patients with a claim containing a diagnosis of schizophrenia (ICD-9 codes 295.xx) or bipolar disorder (ICD-9 codes 296.0x, 296.1x, 296.4x–296.8x) at any time during the period covered by the database were also excluded.
In clinical trials, R/R in MDD is typically identified through patient-reported outcomes (PROs). Because there are no PROs in claims data and no specific diagnosis codes to directly identify R/R, a claims-based algorithm, based on treatment changes, medical services, and diagnoses, adapted from previously published algorithms by Rush et al.Citation5 and Sood et al.Citation15, was used in this study to identify R/R ().
Table 1. Indicators of R/R.
Overview and study cohorts
This study used a retrospective cohort design. The time to first indicator of R/R was first described. Patient characteristics were compared between patients with and without R/R. For a more comprehensive assessment of HRU and costs associated with R/R, two approaches were used: HRU and costs were compared (1) between patients with and without R/R (inter-patient analysis), and (2) between the periods preceding and following the first indicator of R/R, for patients with R/R (intra-patient analysis).
Inter-patient analysis
Patients who met the sample selection criteria were stratified in two cohorts: (1) R/R cohort, or (2) R/R-free cohort depending on whether or not patients had at least one indicator of R/R from 12 weeks after the index date (proxy of end of acute treatment phase) up to 36 months after the index date.
For this analysis, the study period was defined as the 36-month period following the index date.
Intra-patient analysis
In this pre- and post-R/R analysis, patients from the R/R cohort were used as their own control. The pre-R/R period was defined as the 12-month period preceding the first indicator of R/R. The post-R/R period was defined as the 12-month period including and following the first indicator of R/R.
Outcomes and statistical analyses
Patient characteristics
Time from the index date to the first indicator of R/R was described using Kaplan-Meier analyses. Because the pattern of AD use may impact the likelihood/timing of R/R, results were stratified into three treatment pattern groups based on the pattern of AD use during the first 12 months following the index date: (1) continuous treatment, that is patients with ≥ 8 prescription fills for the index AD and who did not switch to or add on another AD or antipsychotic commonly used in MDD; (2) early treatment discontinuation, that is patients with < 8 prescription fills for any ADs or antipsychotics within 12 months of the index date; (3) subsequent switch/augmentation, that is the remaining patients, who switched to or added on an AD or antipsychotic and who had ≥ 8 prescription fills of any ADs or antipsychotic therapies within 12 months of the index date. Supplementary Table S1 lists the eligible antipsychotic and anxiolytic medications.
Patient characteristics, including demographics, comorbidity profile, treatment history, and HRU during the 12 months before the index date (baseline period) were compared between the R/R cohort and the R/R-free cohort using Wilcoxon rank-sum tests for continuous variables and Chi-square tests for categorical variables. Adjusted analyses were controlled for the following baseline characteristics: age, sex, region of residence, type of healthcare plan, Charlson Comorbidity Index (CCI) score, whether or not patients used atypical antipsychotics, typical antipsychotics, and anxiolytics.
Healthcare resource utilization
All-cause HRU included the following four components: inpatient (IP) admissions, IP days, emergency department (ED) visits, and days with outpatient (OP) visits. Statistical comparisons were conducted using generalized linear regression models (GLMs) with Poisson distribution. p-values and 95% confidence interval (CIs) were estimated using a non-parametric bootstrap re-sampling technique of 499 iterations. Results were reported as incidence rate ratios (IRRs) with their 95% CIs and p-values.
Healthcare costs
Healthcare costs were measured from a payers’ perspective and reflect the cost reimbursed by the primary payer and the amount reimbursed under the coordination of benefit provision. Healthcare costs were adjusted for inflation using the Consumer Price Index for medical components and expressed in 2015 USD. Total healthcare costs included costs for medical services (i.e. IP, ED, OP costs) and total pharmacy costs. For medical costs, both all-cause and mental health-related costs were reported. Mental health-related costs were defined as medical costs associated with a claim with an ICD-9 diagnosis code between 290.xx and 319.xx.
Since the duration of the period over which the outcomes were measured varied across patients, mean healthcare costs were reported per-patient-per-year (PPPY). Cost differences were estimated using two-part models: the first part was a logistic model with a binomial distribution, and the second part was a GLM with a log link and a gamma distribution. p-values and 95% CIs were estimated using a non-parametric bootstrap re-sampling technique of 499 iterations. Results were reported as cost differences with their 95% CIs and p-values.
Results
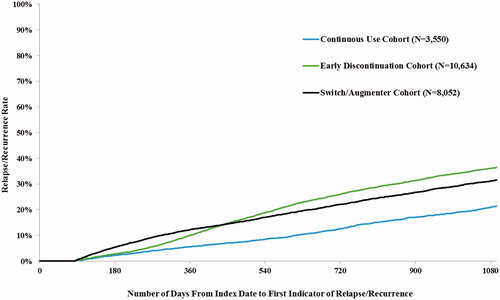
Among a total of 22,236 MDD patients who met the inclusion criteria, 5,541 patients (24.9%) had at least one indicator of R/R (R/R cohort) from 12 weeks after the index date up to 36 months after the index date, and 16,695 (75.1%) did not (R/R-free cohort). The two most common indicators of R/R were a mental health-related ED visit (51.9%) and the use of an AD or antipsychotic after a treatment interruption of ≥ 6 months of the index AD (45.4%) (). Time to the first indicator of R/R varied based on the pattern of AD use—at 3 years after the index date, R/R rates were 21.3%, 31.5%, and 36.4% for the continuous use, switch/augmentation, and early discontinuation groups, respectively ().
Figure 1. Time to first indicator of R/R. R/R, relapse or recurrence.
The mean age as of the index date was 45 and 46 years in the R/R and R/R-free cohorts, respectively, and approximately two-thirds of patients were female (). Statistically significant differences at baseline were observed between the two cohorts. Notably, during the baseline period, the R/R cohort had more generic ADs and more patients who used atypical antipsychotics, typical antipsychotics, and anxiolytics than the R/R-free cohort. Differences were also observed for the comorbidity profile (): the mean CCICitation16,Citation17 score was significantly higher, and a greater proportion of patients had anxiety disorder, hypertension, sleep–wake disorder, trauma- and stressor-related disorder, and hypothyroidism in the R/R cohort than in the R/R-free cohort (all p < 0.05). Patients in the R/R cohort also had a significantly higher HRU during the baseline period ()—mainly driven by OP visits, which represented an average of 2.3 OP visits per month in the R/R cohort and 1.9 OP visits per month in the R/R-free cohort (p < 0.0001).
Table 2. Patient characteristics at baseline.
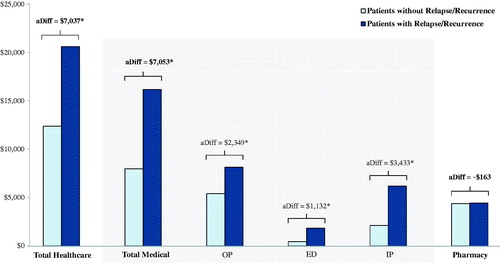
During the study period, for all components, HRU was significantly higher for patients in the R/R cohort than for patients in the R/R-free cohort (all p < 0.05). Notably, the incidence rate of IP days in the R/R cohort was ∼ 4-times (adjusted IRR = 3.95 [3.55–4.35]) the rate reported in the R/R-free cohort, and the incidence of IP admission (adjusted IRR = 2.96 [2.76–3.16]) and ED visits (adjusted IRR = 2.95 [2.81–3.09]) in the R/R cohort were ∼ 3-times as high as those reported in the R/R-free cohort. In addition, the incidence of OP visits in the R/R cohort (adjusted IRR = 1.24 [1.22–1.27]) was 1.24-times as high as in the R/R-free cohort. Healthcare costs were high in both cohorts, but significantly higher in the R/R cohort (R/R cohort: $20,590 PPPY vs R/R-free cohort: $12,368 PPPY; adjusted difference [aDiff] = $7,037 PPPY, p < 0.001) (). The incremental healthcare costs were mainly driven by higher IP costs (aDiff = $3,433, p < 0.001) and OP costs (aDiff = $2,349, p < 0.001) in the R/R cohort than in the R/R-free cohort. Overall, 38.4% of the difference in medical cost was explained by the incremental mental health-related cost in the R/R cohort (results not presented).
Figure 2. Average all-cause healthcare costs PPPY: patients with relapse/recurrence vs patients without relapse/recurrence. Models were controlled for the following baseline characteristics: age, sex, region of residence, type of healthcare plan, Charlson Comorbidity Index score, and whether or not patients used atypical antipsychotics, typical antipsychotics, and anxiolytics. aDiff, adjusted difference. ED, emergency department; IP, inpatient; OP, outpatient; PPPY, per-patient-per-year. *p < 0.05.
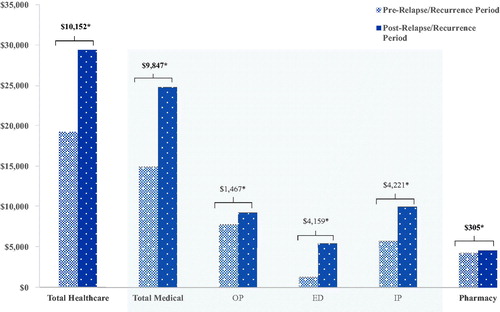
Among patients in the R/R cohort, a significant increase in all types of HRU was also observed during the post-R/R period compared with the pre-R/R period (all p < 0.05). Notably, the incidence rates of ED visits (IRR = 2.13 [2.02–2.24]), IP days (IRR = 2.30 [1.95–2.68]), and IP admissions (IRR = 2.02 [1.86–2.21]) in the post R/R period were over 2-times the rates reported in the pre-R/R period. In addition, the incidence rate of OP visits in the post-R/R period (IRR = 1.11 [1.09–1.13]) was 1.1-times as high as that reported in the pre-R/R period. Similarly, a significant increase in all healthcare cost components was observed during the post-R/R period compared with the pre-R/R period (). More specifically, the mean total healthcare costs increased by more than 50%, from $19,267 to $29,419, in the post-R/R period compared with the pre-R/R period. The increase in total healthcare costs was mainly driven by an increase in IP ($4,221) and ED costs ($4,159). Overall, 64.2% of the difference in medical costs between the pre- and post-R/R periods was related to mental health-related costs (results not presented).
Figure 3. Average all-cause healthcare costs PPPY: pre-relapse/recurrence vs post-relapse/recurrence period. ED, emergency department; IP, inpatient; OP, outpatient; PPPY, per-patient-per-year. *p < 0.05.
Discussion
Using data from a large commercial claims database, this study assessed the incremental economic burden associated with healthcare costs following R/R in patients with MDD treated with an AD in the US.
Results showed that approximately a quarter of patients treated with an AD had at least one indicator of R/R in the 3-year period following treatment initiation. The 3-year rate of R/R varied based on the pattern of AD use and ranged between 21.3% and 36.4%. The most common indicator of R/R, observed in approximately half of the patients with R/R, was a mental health-related ED visit. Results showed that, before initiating an AD, patients with and without R/R already presented different characteristics, including more intensive prior use of an AD and a higher comorbidity burden. Following AD initiation, both HRU and costs were high in patients with and without R/R, but substantially higher among those with R/R, mainly driven by increased use of IP services. Among patients with R/R, HRU and costs increased by more than 50% between the pre- and post-RR period, highlighting the increased need for medical services to manage R/R; more than two-thirds of the increase was directly related to the use of mental health-related services.
The proportion of patients with R/R observed in the current study is generally consistent with results from a prior study using claims data, in which authors reported an adjusted rate of R/R that ranged between 18% (patients treated according to guidelines) and 35% (early discontinuation) at 2 years after AD treatment initiationCitation15—in our study, the rates at 2 years ranged between 12.9% and 26.4% (2 years rates are presented in ). The current study is the first to estimate HRU and costs specifically associated with R/R in patients with MDD. Although a few studies have assessed the economic burden of MDD in a general sample of patients with MDD (not focusing on patients with R/R), comparisons of our findings with these studies are limited given the fundamental differences in the populations examined. However, as expected, the costs among patients with R/R observed in the current study are higher than those reported in prior studies that included a mix of patients with and without R/R. For example, in one recent US commercial claims studyCitation18, the total healthcare costs ranged between $8,626 and $11,107 PPPY—in the current study, total healthcare costs were $20,590 PPPY for the R/R cohort.
Managing depression at an earlier stage is key to preventing R/R, and, thus, potentially reducing the economic burden of MDD. Results from the present study suggest that patients with R/R have a more complex disease profile. Furthermore, the high proportion of patients for whom the first indicator of MDD observed was a mental health-related ED visit suggests a need for closer monitoring, either in primary or specialized mental healthcare, to proactively identify signs and symptoms of R/R. Regardless of the clinical setting, optimal management for patients with MDD who experience R/R requires a multidisciplinary approach. For example, prior studies have demonstrated that collaboration among different healthcare providers benefits patients and can help mitigate relapse and monitor recurrenceCitation19,Citation20. Also beneficial is the administration of symptom-based rating scales to aid in assessing symptom severity and informing treatment adjustmentsCitation19,Citation21. However, because rating scales are not objective measures and there are currently no tools available to objectively measure depression severity and progression, a more comprehensive physician education among different providers may be needed to help physicians define the most appropriate management strategy and identify early factors/symptoms leading to R/R, so as to improve the overall management of MDD.
In light of the limited literature for the economic burden associated with R/R in patients with MDD, the results of this study offer valuable information for stakeholders in mental healthcare who are responsible for monitoring the economic burden of MDD and assessing efforts aimed at reducing the risk of R/R among this patient population. The identification of specific indicators that can be reliably used to minimize R/R and assess the extent of reducing the economic burden of MDD represents important directions for future studies.
The results of the current study should be interpreted within the context of certain limitations. First, although this study examined HRU and costs associated with R/R in patients with MDD, it did not assess causation. Second, information on R/R in MDD is not directly available in claims data; therefore, an empirical algorithm was used to identify R/R. As a result, potential psychosocial stressors or comorbid conditions could have been expressed as R/R. However, based on the study’s inclusion/exclusion criteria of the cohorts, such contributors are likely to have affected both cohorts equally. Third, treatment patterns were assessed based on claims for prescription fills, which does not guarantee the patient’s actual consumption of the medication. Fourth, as with all retrospective claims databases, diagnostic and procedure codes are reported but do not include clinical information such as disease severity or reasons for treatment changes, and may be subject to data omissions or coding errors. Relatedly, it is possible that the wide variation in costs for non-branded vs branded antidepressants could have obscured differences between cohorts. In addition, because of differences in treatment persistence between branded and non-branded (i.e. generic) therapies, based on a 2016 retrospective claims study by Solem et al.Citation22, it is unclear how the treatment patterns in between these medications may have affected the results. Lastly, this study focused on patients with commercial insurance plans to minimize confounding factors that could drive ED visits and, therefore, the findings may not be generalizable to patients covered by other types of insurance.
Conclusions
Results of this study showed that approximately a quarter of patients treated with an AD experienced R/R in the 3-year period following treatment initiation. At the time of AD initiation, patients with R/R presented a more complex disease profile. Results indicate that the economic burden is substantial among patients with and without R/R, but significantly higher among patients with R/R. These results suggest that, in addition to tailoring a treatment strategy based on patient’s disease severity and history, managing depression at an early stage is crucial to prevent R/R, and, consequently, to reduce the economic burden associated with MDD.
Transparency
Declaration of funding
This study was supported by Takeda Pharmaceutical Center USA.
Declaration of financial/other interests
SS and AG are employees of Analysis Group, Inc., which has received consultancy fees from the study sponsor to conduct this study. GG was an employee of Analysis Group, Inc., at the time this study was conducted. LM was an employee of Takeda Pharmaceutical Center USA at the time this study was conducted. JDA peer reviewers on this manuscript have no relevant financial or other relationships to disclose.
Supplemental Material - Table 1 (09.05.2019)
Download MS Word (23.2 KB)Supplemental Material - Figure 1 (09.05.2019)
Download TIFF Image (87.4 KB)Acknowledgements
Medical writing assistance was provided by Cinzia Metallo, an employee of Analysis Group, Inc. Support for this assistance was provided by Takeda Pharmaceutical Center USA.
Data availability statement
The claims database (Truven MarketScan Commercial Database) is proprietary, provided by a third-party vendor, and the authors do not have permission to disseminate the data without the vendor’s approval. The study sponsor has purchased access to the database (the authors have been granted access to the data on a contract per project use). Access to this data set is available to any other interested parties for a fee set by Truven Health Analytics (https://marketscan.truvenhealth.com/marketscanportal/).
Related Research Data
References
- National Institute of Mental Health (NIMH). Major Depression, 2017. Available at: http://www.nimh.nih.gov/health/statistics/prevalence/major-depression-among-adults.shtml. [Last accessed October 4, 2018]
- Marvel CL, Paradiso S. Cognitive and neurological impairment in mood disorders. Psychiatr Clin North Am. 2004;27:19–36, vii–viii.
- Ferrari AJ, Charlson FJ, Norman RE, et al. Burden of depressive disorders by country, sex, age, and year: findings from the Global Burden of Disease Study 2010. PLoS Med. 2013;10:e1001547.
- Greenberg PE, Fournier AA, Sisitsky T, et al. The economic burden of adults with major depressive disorder in the United States (2005 and 2010). J Clin Psychiatry. 2015;76:155–162.
- Rush AJ, Kraemer HC, Sackeim HA, et al. Report by the ACNP Task Force on response and remission in major depressive disorder. Neuropsychopharmacology. 2006;31:1841–1853.
- Oluboka OJ, Katzman MA, Habert J, et al. Functional recovery in major depressive disorder: providing early optimal treatment for the individual patient. Int J Neuropsychopharmacol. 2018;21:128–144.
- Armstrong C. APA releases guideline on treatment of patients with major depressive disorder. Am Fam Physician. 2011;83:1219–1227.
- Kudlow PA, McIntyre RS, Lam RW. Early switching strategies in antidepressant non-responders: current evidence and future research directions. CNS Drugs. 2014;28:601–609.
- Oestergaard S, Moldrup C. Improving outcomes for patients with depression by enhancing antidepressant therapy with non-pharmacological interventions: a systematic review of reviews. Public Health. 2011;125:357–367.
- Paykel ES. Partial remission, residual symptoms, and relapse in depression. Dialogues Clin Neurosci. 2008;10:431–437.
- Hardeveld F, Spijker J, De Graaf R, et al. Recurrence of major depressive disorder across different treatment settings: results from the NESDA study. J Affect Disord. 2013;147:225–231.
- Burcusa SL, Iacono WG. Risk for recurrence in depression. Clin Psychol Rev. 2007;27:959–985.
- Sim K, Lau WK, Sim J, et al. Prevention of relapse and recurrence in adults with major depressive disorder: systematic review and meta-analyses of controlled trials. Neuropsychopharmacol. 2016;19:pyv076.
- Thaipisuttikul P, Ittasakul P, Waleeprakhon P, et al. Psychiatric comorbidities in patients with major depressive disorder. Neuropsychiatr Dis Treat. 2014;10:2097–2103.
- Sood N, Treglia M, Obenchain RL, et al. Determinants of antidepressant treatment outcome. Am J Manag Care. 2000;6:1327–1336.
- Quan H, Sundararajan V, Halfon P, et al. Coding algorithms for defining comorbidities in ICD-9-CM and ICD-10 administrative data. Med Care. 2005;43:1130–1139.
- Quan H, Li B, Couris CM, et al. Updating and validating the Charlson comorbidity index and score for risk adjustment in hospital discharge abstracts using data from 6 countries. Am J Epidemiol. 2011;173:676–682.
- Gauthier G, Guérin A, Zhdanava M, et al. Treatment patterns, healthcare resource utilization, and costs following first-line antidepressant treatment in major depressive disorder: a retrospective US claims database analysis. BMC Psychiatry. 2017;17:222.
- Unützer J, Park M. Strategies to improve the management of depression in primary care. Prim Care. 2012;39:415–431.
- Van den Broeck K, Ketterer F, Remmen R, et al. Why collaborative care for depressed patients is so difficult: a Belgian qualitative study. Int J Integr Care. 2017;17:7.
- Fortney JC, Unutzer J, Wrenn G, et al. A tipping point for measurement-based care. Psychiatr Serv. 2017;68:179–188.
- Solem CT, Shelbaya A, Wan Y, et al. Analysis of treatment patterns and persistence on branded and generic medications in major depressive disorder using retrospective claims data. Neuropsychiatr Dis Treat. 2016;12:2755–2764.