
 ?Mathematical formulae have been encoded as MathML and are displayed in this HTML version using MathJax in order to improve their display. Uncheck the box to turn MathJax off. This feature requires Javascript. Click on a formula to zoom.
ABSTRACT
Increased traffic congestion, lower air-quality, and worsening of destination’s image perception are just some of the negative externalities affecting destinations relying on natural amenities and supplying nature-based activities. Adopting a Stated Preference experiment, this research investigates southern Switzerland natural areas’ visitors’ reaction to the hypothetical introduction of sustainable means of transport, and puts forward possible interventions to reduce the share of car users. Results show that the introduction of innovative means of transport, such as a park-and-ride integrated with a shuttle service or a bike-sharing system, might have a strong impact in reducing traffic congestion. From a sample composed by 65% of car users, results show that if innovative sustainable mobility services were introduced, market share of cars would reduce to less than 20%. Furthermore, an increase in parking cost would further decrease the use of private vehicles, in favour to alternative solutions.
Introduction
Sustainable leisure mobility has been one of the research priorities in the academics’ agenda since the beginning of the 2000s (Becken et al., Citation2003; Høyer, Citation2001; Kelly, Haider & Williams, Citation2007; Lumsdon, Citation2000). Though the interest in the topic is pervasive, it is well known that this has a special importance for destinations relying on natural amenities and supply nature-based activities (Orsi & Geneletti, Citation2014). The expansion of tourism activities is strictly linked to the evolution of transportation demand, with all the consequences that it may bring (Albalate & Bel, Citation2010; Dickinson & Robbins, Citation2008). The world is rich of cases in which the expansion of tourism-driven transport demand and related congestion are source of deterioration of the natural asset and the image of a destination (Jo et al., Citation2016; Saenz-de-Miera & Rossellò, Citation2012). In this sense, tourism research has mainly investigated the determinants of transport preferences and behaviour, and the propensity to adopt sustainable transport alternatives (González et al., Citation2019; Orsi & Geneletti, Citation2014; Prillwitz & Barr, Citation2011). One non-negligible consequence of traffic expansion, especially for small-scale areas, is the worsening of the residents’ perceived image of the destination and a sense of intolerance and frustration towards tourist flows. Crowding in tourism (Namberger et al., Citation2019; Zehrer & Raich, Citation2016) and community’s tolerance toward excessive social density (Saveriades, Citation2000; Smith et al., Citation2019; Yang & Lo, Citation2018) have been subject to recent research. This last aspect is particularly important when it involves residents of areas which are important tourist sites, although threatened by massive influx of visitors. In fact, an intact natural setting represents the main tourism asset for certain destinations. However, excessive levels of congestion have the sole effect to deplete this resource (Dickinson & Robbins, Citation2008; Martin-Cejas & Ramirez Sanchez, Citation2010).
The focus of this study is to analyse how the introduction of new sustainable alternative means of transport would change tourists’ and residents’ mobility behaviour and the determinants of such a shift in transport-related decisions. From an empirical point of view, it proposes a modelling approach in the form of an Integrated Choice and Latent Variable (ICLV) model (or Hybrid Choice model). An ICLV model allows to simultaneously investigate stated mobility preferences and psychological factors, hypothesized to be significant determinants of transport choices, in addition to standard individual and contextual characteristics. As posited by recent transport and tourism research, the simultaneous investigation of preferences, choices, and attitudes is crucial in order to better identify the sources of behavioural intention and change (Beck et al., Citation2013; Johansson et al., Citation2006; Kamargianni & Polydoropoulou, Citation2013; Prillwitz & Barr, Citation2011).
The empirical analysis is based on a dataset collected during the 2017 summer with 224 travel parties in two valleys of Canton Ticino (southern Switzerland), respectively, Vallemaggia (Maggia valley) and Valle Verzasca (Verzasca valley), two close realities suffering from similar traffic-related issues. Data were collected at strategic points in order to interview car and public transport users. Respondents were asked to fill a structured questionnaire in which stated preferences regarding leisure mobility to reach the valleys were elicited in the form of discrete choices. The theoretical and empirical approach proposed in this article is of interest to those destinations where leisure activities are nature-based, and where traffic-generated conflicts between residents and tourists exist. In terms of policy intervention, the consideration of residents’ attitudes towards traffic and congestion is an important element in order to develop an integrated transportation system apt at reaching rural areas, supported by on-site specific measures granting an appropriate use of the destination to both tourists and residents.
Literature review and conceptual background
Though the concept of crowding in tourism has been considered for some time (Vaske & Shelby, Citation2008), dedicated literature has experienced growing attention toward the subject in recent years (Jacobsen et al., Citation2019; Namberger et al., Citation2019; Schuckert & Wu, Citation2021).Footnote1 The definition of the setting in which crowding is taken into account is crucial (Jacobsen et al., Citation2019; Namberger et al., Citation2019; Neuts & Nijkamp, Citation2012; Schuckert & Wu, Citation2021) as causes and effects of the phenomenon vary with destinations (Goodwin, Citation2017; Jacobsen et al., Citation2019; Jurado et al., Citation2013). At the same time, researchers have theorized and empirically verified how individual tolerance is strictly related to the concept of perceived crowding, “(…) thought of as an attitude in which a perception of excessive use levels of tourism (…) may (or may not) lead to a negative state, and change behaviour” (Muler Gonzalez et al., Citation2018, p. 4). In an effort to highlight the strong heterogeneity between individuals, several authors have related characteristics such as age, gender, education, income, repeat visiting, length of stay, motivations, cultural distance, and physical distance to crowding (Jacobsen et al., Citation2019; Jurado et al., Citation2013; Neuts & Nijkamp, Citation2012; Schuckert & Wu, Citation2021; Zehrer & Raich, Citation2016), and the latter to tourist satisfaction and destination appraisal, in general determining a negative relationship between these two elements (Ryan & Cessford, Citation2003; Yang & Lo, Citation2018; Zehrer & Raich, Citation2016).Footnote2
Excessive influx of visitors can also be associated with tourism-generated traffic congestion. This topic is present in tourism literature (Saenz-de-Miera & Rossellò, Citation2012) but research has only marginally investigated the impact of perceived crowding on individuals’ choices concerning transportation solutions (Dickinson & Robbins, Citation2008; Kelly, Heider, Williams & Englund, Citation2007; Taff et al., Citation2013) and, more specifically, residents’ decisions to alter their behaviour in order to cope with traffic related-issues. Traffic congestion can be seen as a collateral aspect related to tourism development and planning, potentially leading to negative perceptions and attitudes manifested by individuals in the long term—sometimes also anticipating a proposed development (Mason & Cheyne, Citation2000). This is especially true when supply is not aligned to the peak-periods demand levels (Albalate & Bel, Citation2010) and may lead to sentiments of dissatisfaction and lack of attractiveness for both tourists and residents (González et al., Citation2019; Li & Wan, Citation2013). Thus, excessive congestion, unless treated with appropriate policies aimed at intervening in the transport sector (Aguiló et al., Citation2012; Orsi & Geneletti, Citation2014), may result in negative perceptions and this, in turn, may lead the residents to externalize a sentiment of discomfort toward the tourism sector. Furthermore, it may eventually lead to changes in everyday habits and a clear support to restrictions on tourism development (Latkova & Vogt, Citation2012; Li & Wan, Citation2013).
Tourism academics are keen to understand the relationship between individual characteristics and leisure-related transport behaviour, especially when the aim is pointed toward the “green” practices. As highlighted by Bergin-Seers and Mair (Citation2009, p. 112)
… environmental behaviour results from the general beliefs about the relationship between humans and the environment (world views). These initial general beliefs then lead to awareness of consequences and the view that environmental conditions may threaten things the individual treasures and the idea that specific behaviour can make a difference and reduce impacts.
Despite the attention that scholars have dedicated to the topics of tourist mobility behaviour and decision-making in natural areas (Orsi & Geneletti, Citation2014; Pettebone et al., Citation2011), tourism literature still lacks an in-depth discussion on and a formal representation of resident’s tolerance with respect to tourism-generated traffic congestion. Furthermore, the effects that this may have on transport decisions and the shift to more environmentally friendly means of transport remain unclear. In order to close this research gap, this article aims at empirically assessing how tourists and residents evaluate the possibility to adopt alternative and more sustainable travel solutions when reaching rural destinations suffering from traffic congestion. In addition, this study intends to take empirically into account residents’ perceived traffic congestion generated by tourists during peak periods of the year and investigate how this perception drives their mobility decisions. Ultimately, the results of the empirical analysis will serve to calculate economic indicators and to suggest managerial and policy strategies.
Research method
Research area
The study was conducted in Ticino, the southernmost of the Swiss Cantons and one of the most important areas for the Swiss tourism industry. Despite its relatively small contribution in terms of population—4.1% of the resident population nationwide (Swiss Federal Statistical Office, Citation2017b)—the Ticino Canton registered 8.3% of total hotel overnights during the summer in the year of the experiment (Swiss Federal Statistical Office, Citation2017a). The setting of this study is based on two valleys of the region, Vallemaggia and Valle Verzasca, whose names are derived from the eponymous rivers. shows the map of Ticino Canton, with the “Maggia” and “Verzasca (Ve.)” referring to Vallemaggia and Valle Verzasca, respectively.
Figure 1. Map of Canton Ticino (Source: Tschubb—Own work, CC BY-SA 3.0, https://commons.wikimedia.org/w/index.php?curid=57654972, edited by the author).
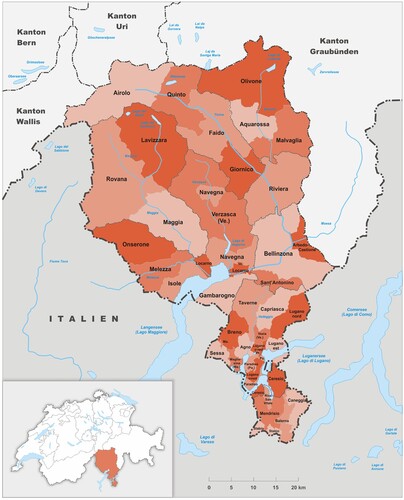
Vallemaggia extends about 40 km to the northwest from the district municipality of Locarno and comprises several hiking and cycling routes. The presence of charming stone cottages (“Rustici” in Italian), hundreds of cascades and the deep river canyon near Ponte Brolla makes it a popular destination for outdoor recreation. In Valle Verzasca, only few villages are situated along the single valley road with a very crowded point of interest during summer, the so-called Ponte dei salti, a Roman bridge often pictured in tourism brochures because of its peculiar architectural style and its’ potential for outdoor sport activities during summer season. The two valleys often result in being very congested due to limited parking space and narrow streets, mainly during the summer season with heavy peaks during the weekends.
Data collection and questionnaire
A questionnaire survey was conducted in July 2017, which aimed at understanding tourists’ and residents’ behaviour in the valleys, with a particular focus on mobility-related behaviour (Evler, Citation2017). In a time span of two weeks, outdoor recreationists were surveyed in strategic locations close to the main attraction of each valley. A total of 224 travel parties (112 in each valley) were interviewed on weekdays and weekends about their individual trip and mobility behaviour on-site. The survey consisted of five separate sections and was available in three different languages: English, Italian, and German. Participants were first asked to complete a stated preference (SP) experiment. The choice scenarios were created adopting an efficient D-design (D error = 0.096, Sample estimate = 196) considering its better performances compared to orthogonal designs, especially with small samples (González et al., Citation2019; Rose & Bliemer, Citation2009). The discrete choice scenarios were distinguished between the two valleys, hence, one design was created for Valle Verzasca and one for Vallemaggia. For each setting, the design comprised eight choice scenarios that were split in two blocks of four, and only one of the two blocks was randomly presented to each respondent. Survey participants were introduced to a hypothetical scenario that offered them a park-and-ride solution at the valley entrance with shuttle bus or e-bike services as an alternative to the existing arrival options via personal vehicle or public transport ().
Figure 2. An example of choice experiment scenario in the survey.
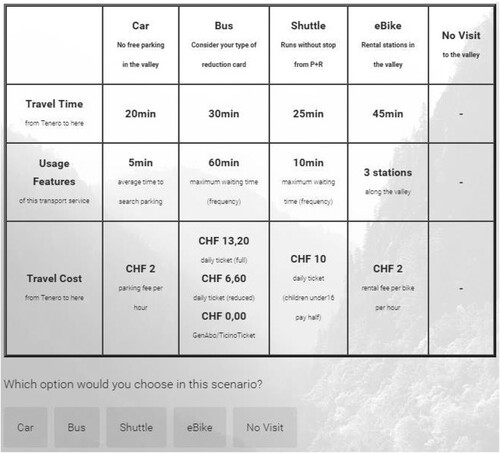
The fifth choice alternative was an opt-out option framed as “No visit”: this alternative could be chosen in case none of the other choice options was deemed as satisfactory by the respondent, implying that the individual would avoid visiting the destination rather than accepting any of the presented transportation alternatives. The attributes characterizing the alternatives were transport cost, usage attributes (service frequency for public transport and shuttle, search time for parking in the case of personal vehicle) and travel time, whose levels are depicted in .
Table 1. Alternatives, attributes, and levels of the choice experiment (Note: fix = fixed level, rdm = randomly selected level).
In the second part of the survey, individuals that indicated to be residents in the Locarno district (i.e. in the proximity of the two valleys) were requested to evaluate regional tourism development by stating their agreement towards some sentences regarding the sustainable development of tourism (a balance of social, economic, and ecological well-being), and the state of the transport infrastructure in the region. These questions regarded the perception of tourism impact on the region, and were specifically aimed at residents given their possibility to evaluate the differences between tourist and non-tourist season. The third section gathered information on trip origin, intended activities in the valley, and their frequencies. The fourth section comprised questions concerning revealed preferences (RP) data about respondents’ mobility behaviour to the site and their perceived quality of the local transport infrastructure. Respondents’ socioeconomic characteristics were registered in the final part of the survey.
Econometric modelling
Multinomial logit (MNL)
Residents’ and tourists’ mobility preferences to reach the valleys were analysed by adopting discrete choice models (DCMs). DCMs are commonly used in situations in which the nature of the choice is discrete and refers to exhaustive and mutually exclusive alternatives. When more than two options are available, the model is referred to as multinomial logit (MNL). DCM relies on Random Utility Theory, whose underlying assumption is the rationality of consumers, considered as rational agents aiming at maximizing their utility function through their choices. In this specific study, the decision that respondents face is the choice of means of transport to reach the valleys. The available alternatives are car, public transport, shuttle, e-bike and “no choice” and respondents chose their most preferred alternative at each choice task. The utility function for respondent i in the choice occasion t for the alternative j is given by composed of a deterministic value
and a stochastic, extreme value-distributed term
. In particular, the utility functions are expressed as in Equations (1) and (2):
(1)
(1)
(2)
(2)
The alternative specific constant (ASC) represents the baseline preference of respondents for the specific alternative j (j = car, public transport, shuttle, and e-bike). COST is the alternatives’ associated cost to get to the valley; it includes parking fee for car, ticket price for public transport or shuttle and renting fare for e-bike. TRAVEL TIME is the total travel time to get to the valley, which, in the case of car, considered also parking time, independently identified.
USAGE is the frequency of rides for public transport and shuttle (expressed in number of minutes between one ride and another), and it counts the number of available stations for e-bike. AGE and EDUCATION LEVEL are the only statistically significant socio-demographics variables found in the estimations. Once the utility functions have been defined, the probability of choosing a specific travel option k among the alternatives is calculated as expressed in Equation (3):
(3)
(3) where
is the choice of individual
in the choice task t and
represents the deterministic part of the utility function expressed in Equation (2). The
parameter (estimated only for Valle Verzasca respondents) allows controlling for scale differences in the two datasets. In our version of the model, the
parameter has to be tested against the null hypothesis of being equal to zero (
no differences in scales). The inclusion of the
parameter increases the model fit by minimizing the error variances and allows obtaining more accurate estimations of individuals’ preferences (Train, Citation2009). Parameters are estimated through the maximization of the log-likelihood function, expressed in Equation (4):
(4)
(4) where (
) is the set of parameters.
ICLV
ICLV models represent an advancement compared to regular logit models used to investigate choice behaviour. As explained earlier, discrete choice modelling accounts for individual decisions based on a set of alternatives’ attributes and a set of socio-demographic variables. In addition to these, ICLV models allow to include respondents’ psychological characteristics as choice predictors. Individual traits such as attitudes, motivations, personality, and perceptions are inherently latent and not objectively measurable. Furthermore, ICLV models implement a peculiar empirical process to include these latent variables among the factors hypothesized to be the causal effects of individual decision-making. This kind of model has had large implementation in the last years in a wide pool of different fields like food consumption (Palma et al., Citation2018), health economics (Kløjgaard & Hess, Citation2014), energy and environmental economics (Beharry-Borg & Hess, Citation2012; Mariel et al., Citation2015), tourism (Sarman et al., Citation2019), and transportation (Kamargianni & Polydoropoulou, Citation2013; Kim et al., Citation2014; Yazdanpanah & Hosseinlou, Citation2016), the latter of which has probably been the major contributor to the elaboration and application of the methodology. Concerning the field of tourist transportation studies, only few examples of application of ICLV modelling can be cited (Beck et al., Citation2018; Fleischer et al., Citation2012). In our specific case, we consider a latent trait that is defined as the “perception of the impact of tourism and congestion” (PTC). To move from a classic DCM framework to an ICLV model, two additional components are necessary: a measurement equation (in order to give a measure to the latent construct), and a structural equation (aimed at identifying individuals’ socio-demographics determinants of the latent variable).
Measurement equation
The latent variable, being an intangible characteristic, needs to be measured using some indicators. The psychographic indicators are assumed to be influenced by the latent variable in a linear relationship:
(5)
(5) where r is the specific indicator,
represents the effect of the latent variable on the rth indicator, and
is the standard deviation of the
normally distributed error term. In this study, the indicators used for the measurement of the latent variable are based on Likert scales from 1 (strongly disagree) to 5 (strongly agree), which are the following: “Because of tourism, there is better transport and leisure infrastructure in the Locarnese”, “Tourists greatly add to the traffic congestion, noise and pollution in the Locarnese”, and “This valley has problems of car traffic and parking congestion”. As these questions regarded the perception of tourism impact on the region of “Locarnese”, only residents were asked to answer this part of the questionnaire, given their possibility to evaluate the differences between tourist and non-tourist season.
Structural equation
In order to exploit heterogeneity in PTC by respondents’ characteristics, the latent variable is expressed as function of socio-demographic variables and an error term. In this case, the structural equation for the latent variable is specified as follows:
(6)
(6) where
and
capture the impact of age and education level, respectively, on PTC,
captures the impact of working in the tourism field and the error term
is a realization of a random draw extracted from a simulated standard normal distribution.
Likelihood formulation
The final probability of choosing a certain alternative is calculated by integrating the probability expressed in Equation (4), in the domain of the latent variable, as expressed in Equation (7).
(7)
(7)
The integral expressed has no closed form, so the estimates are obtained by the maximization of a simulated maximum likelihood using a Monte Carlo simulation technique. The reader might want to refer to Train (Citation2009) for a deeper understanding of simulated maximum likelihood.
Economic interpretations: value of travel time savings (VTTS) and elasticities
In discrete choice modelling, parameters have economic interpretation such as the economic value of non-monetary attribute or demand elasticities with respect to a variation in alternatives’ cost. These parameters are typically regarded as important components in cost-benefit analyses aimed at assessing proper managerial strategies (González et al., Citation2019). The ratio between any non-monetary parameter and the parameter allows to determine respondents’ willingness to pay (WTP) for specific attributes’ levels. One of the most important WTP measures is represented by the value of travel time saving (VTTS), indicating how much a traveller is willing to pay to reduce travel time by units of time (Hess et al., Citation2005), calculated as in Equation (8):
(8)
(8)
Cost elasticity measures the percentage change in demand for an alternative, per marginal percentage change in the travel cost of that alternative. Values lower than 1 identify an inelastic demand, meaning that a price increase of 1% would induce a reduction in demand smaller than 1%, while values higher than 1 identify an elastic demand. Direct elasticity for an alternative k is defined as the decrease in its demand with respect to an increase of its price, and can be calculated as in Equation (9) (Ben-Akiva et al., Citation1985):
(9)
(9)
Cross elasticity is defined as the increase in demand for an alternative j in response to an increase in price for alternative k and is calculated as in Equation (10):
(10)
(10)
Data analysis
Sample of respondents
presents the description of respondents. The presence of men respondents is just above the half, respondents are in prevalence between 25 and 34 years old, the most common companionship is made of couples while the average income in the sample is lower than the median at the national level. 13.4% of the sample is composed of residents while the remaining 86.6% of tourists, with a great majority of Swiss tourists coming from German-speaking cantons. From this point of view, it is important to notice that, even though there are no official statistics for daily visitors (in fact, no ticket or other way to control for the arrivals is implemented), the large discrepancy between residents and tourists presence in the valleys can be considered a representation of real shares for the peak-period of demand. Car proved to be the most popular means of transportation to the valleys throughout all segments (). On the other hand, more than 60% of all car users did not possess any kind of reduction cards for public transport usage.
Table 2. Sample statistics.
Table 3. Respondents’ arrival mode in the valleys, revealed preferences (RP).
Model results
Three models are presented in . Model 1 is a basic multinomial logit (MNL) model estimating the effect of alternatives’ characteristics and respondents’ socio-demographic variables on mode choices, which can be considered as a reference for the comparison of Model 2–3. Model 2 is another MNL model that adds a parameter () to capture the interaction between residents and travel time, in order to differentiate between tourists and residents’ time preferences. Model 3 is an Integrated Choice and Latent Variable (ICLV) model in which the effect of residents’ perception of tourism and traffic congestion is considered to check whether it has an impact in identifying mode preferences heterogeneity. In the ICLV model, 3,000 Modified Latin Hypercube Sampling (MLHS) random draws are used for the estimation of the latent variable because of greater accuracy when compared to Halton draws (Hess et al., Citation2006). All the models take into consideration the alternative specific constants (ASC), the scale parameter for the two different valleys (λ) and the panel structure of the choice experiment. In terms of log-likelihood of the choice model, Model 3 shows the highest fit with a value of −1,137.47, and Akaike (AIC) and Bayesian information criteria (BIC) justify the introduction of additional parameters. In addition, the inclusion of the latent variable is helpful to extract evidences that cannot be captured by a standard MNL model; for example, it allows to estimate VTTS that are closer to those found in another study on the VTTS in Switzerland (Axhausen et al., Citation2008). Considering the better fit of the last model, the analysis of market shares, elasticities, and VTTS are based on its results.
Model 1. Cost and time attributes have a significant impact in determining respondents’ preferences in line with expectations; in fact, higher costs and estimated travel times for a certain alternative negatively affect individual utility and, consequently, the probability of choosing it. Sensitivity to changes in travel time is constant across different means of transports (), while price sensitivity depends on the specific means of transport. The unitary increase of travel cost has a weaker impact on car demand with respect to public transport, shuttle and e-bike (
and
), meaning that the proposed alternatives have different demand elasticities with respect to price changes. Frequency of shuttle services and public transport has a positive and significant impact on the choice of such alternatives (
) and the same applies to density of e-bike stations (
). Estimated parking time seems to have a negative impact on the choice of car (
), but the result is not significant at a 10% level. Age and education are the only socio-demographic variables resulting in a significant impact on respondents’ preferences. Ceteris paribus, respondents with a higher education level report a higher probability to revisit the valley, while an increase in respondent’s age is associated to a lower propensity to revisit and a greater relative preference towards car (−0.021) with respect to public transport, shuttle, and e-bike (−0.029). Thus, the results find analogies with that of Pettebone et al. (Citation2011) and Moscardo et al. (Citation2001), who show that older people have a strong preference towards the use of car.
Model 2. A significant estimate of identifies a difference between residents’ and tourists’ sensitivity. In order to identify whether time sensitivity for residents is significant or not, it is necessary to test if the sum of
and
is different from 0. In fact, while travel time has a negative effect for tourists (−0.027), it has no impact on residents (The sum has been tested with delta method, null hypothesis:
, p-value = 0.232).
Model 3. In the ICLV model, the PTC latent construct is measured through the manifestation of above-mentioned indicators, and positive values of the zeta parameters (z1 = 0.585, z2 = 0.629, z3 = 0.656) imply that the Likert scale indicators are positively linked to the latent variable. Significant values for the sigma parameters (σ1 = 1.219, σ2 = 1.317, σ3 = 0.903) indicate heterogeneity in responses in the indicators. The gamma parameters identify the profile of respondents with a high value of the latent variable, who on average are older (γ_age = 0.024), better educated (γ _education = 0.882), and with a higher probability of working in a tourism-related job (γ_WorkInTourism = 1.309) with respect to those with a lower value of the latent variable. In the explanation of respondents’ choices, the latent variable helps better describe residents’ behaviour. Residents with a high value in the PTC have a significantly higher preference for public transport and shuttle compared to others (), a source of heterogeneity in the preferences that could not be identified without the use of the latent variable.
VTTS
VTTS slightly changes depending on the estimated model, with more conservative values obtained in model 3, considered as the most accurate relying on the goodness-of-fit statistics. Results show that tourists VTTS is 21.39 CHF/hour when travelling by car and 15.23 CHF/hour when travelling by public transport, shuttle or e-bike. These results are slightly greater than those calculated by Axhausen et al. (Citation2008) who estimated a VTTS of 18.83 CHF/hour using car for leisure purposes (although leisure purposes were not specifically framed as tourism activities but include all the trips that cannot be considered for business, commuting and shopping) and 11.90 CHF/hours using public transport.Footnote3
Table 4. Empirical models estimation results.
Market shares and elasticities
Calculating market shares for the alternatives presented in the questionnaire allows estimating how people would behave in case of introduction of innovative transportation modes. It is interesting to compare RP data as stated by respondents, meaning actual market shares () of transportation modes to reach the valley, with market shares that can be inferred from the SP experiment (). The majority of the respondents reached the valleys by car (around 65%), followed by public transport (17%) and motorbike (7%), almost 10% of the respondents arrived with zero-emission (6% by hiking, 4% by bike) and a small proportion of respondents arrived by coach (less than 1%). Car and public transport users are less present among residents (respectively 53% and 66%), who show higher preferences for bike (10% vs 3% of tourists) and motorbike (20% vs 5%). In the second row of , it is possible to see how those market shares might change in the case of the introduction of a shuttle service and an e-bike system applying the average cost presented in the experiment for the alternatives expressed in the first row (numbers in square bracket are 95% confidence intervals).
Table 5. Estimated market shares and cost elasticities after the introduction of a shuttle service and e-bike.
Respondents would react positively to the introduction of innovative means of transports. In fact, a shuttle service with a cost of 8.40 CHF would be chosen on average by 43% of the respondents (31% of residents, 44% of tourists), while an electric bike with a cost of 5.20 CHF would be chosen by around 20% of them (30% of residents, 18% of tourists). Another important aspect would be the reduction of people arriving by car, dropping from 65% to around 19%, with an estimated parking fee of 10.40 CHF. There would be 15% of respondents coming by public transport (17% of residents, 14% of tourists) and around 4% of them that would not come with those possible alternatives. In general, tourists are less willing to revisit the valley (4.3% of tourists would not come back as well as 2.7% of residents). With respect to elasticities, all the alternatives are quite inelastic to travel cost, with public transport being the most sensitive to a change in price (−0.619) while e-bike is the most inelastic (−0.379). Making a practical example, an increase of parking fee of 10% would reduce the demand for car by 5.50%, the same increase in the ticket of public transport or shuttle would reduce their demand by 6.19% and 4.58%, respectively, while an increase in e-bike rent of the same amount would reduce its demand by 3.79%. Still, an increase in travel cost for each alternative would not affect only the demand of the alternative itself, but also the demand for other alternatives, which become relatively more convenient. Cross-elasticities are reported in rows 6–9 of . In row 6 it is possible to notice the cross elasticity of other alternatives with respect to an increase in the cost for car: a 10% increase in the cost of car would increase by 1.05% the demand of public transport, by 2.77% the demand of shuttle, by 1.39% the demand of e-bike, and by 0.29% the share of people not choosing one of the proposed alternatives. The same applies to the other alternatives in rows 7–9 of . In order to understand how to reduce traffic congestion using a price policy, two strategies are available: the first consists in the increment of parking fee, with an estimated elasticity of −0.550, while the second considers a price decrease of other alternatives, the latter of which would impact with lower strength on the reduction of car demand (cross-elasticity of car with respect to public transport = 0.137, shuttle = 0.144, e-bike = 0.087).
reports the estimated market shares in the scenarios of a parking fee increase. Results show that a progressive increase of the parking fee would reduce the market share of people choosing car as mean of transport to reach the valleys, with shuttle gaining the highest increase in market shares. It is also important to notice that the “no choice” alternative has a really low cross-elasticity with respect to other means of transport. This means that an increase in price would induce people to switch to other means rather than not coming, and the “no choice” market shares remain stable.Footnote4
Table 6. Estimated market shares scenarios for tourists and residents in response to an increase in cost of parking ticket.
Discussion
Destinations whose main resources are nature-based have the urgency to preserve the territory and embrace a sustainable mobility plan, able to deal with an increase in tourism demand. This would allow maintaining untouched both the natural landscape and residents’ attachment to their territory. The aim of this paper is to understand if it is possible to reduce traffic congestion and develop a sustainable transport system in highly congested areas. In order to do that, it is necessary for destination management organizations to induce a change in both tourists’ and residents’ behaviour, for example by introducing policy interventions that incentivize the use of alternative means of transport and discourage the use of car. The present discussion elucidates on empirical differences found in tourist and residents’ behaviour, illustrating the characteristics that innovative means of transport should have and propose some managerial implications. Furthermore, the importance of price strategies is assessed. Finally, new potential research avenues are addressed in order to foster academic discussion on the topic.
Innovative means of transport
Regarding the introduction of innovative means of transport that could help to reduce the congestion generated by cars, this research shows that a park-and-ride solution with shuttle service and an electric bike system would be accepted positively by a large share of respondents. In fact, results of the SP experiment show that almost 61% of respondents would reach the valleys with one of those means of transport if they were available, reducing from 65% to 19% the share of people choosing car. In particular, the introduction of the electric bike system, a zero-emission solution, could potentially double the number of people choosing a zero-emission mobility and also increase the interest to revisit the valley for residents who want to try a different experience. In order to be effective, the e-bike system should offer a sufficient number of stations, allowing people to freely move along the valley and leave the bikes in several places. Also, the e-bike system should give the possibility of putting hold on the rental fee in every station, being in this way significantly different from a classical rental bike. Differences arise across residents and tourists: the introduction of new alternatives would reduce the share of car users in both samples (from 53% to 16% for residents and from 66% to 19% for tourists), with residents being more attracted by the e-bike (30% against 18.3% for tourists), while the opposite happens for the shuttle service (considered as the favourite options by 43.6% of tourists and 30.8% of residents).
Price strategy
Although the introduction of innovative means of transport might reduce the share of people using the car, such a policy should be complemented by a price strategy in order to be effective. In fact, any change in the price of the alternatives has an impact in shaping market shares (). For existing alternatives, car has lower cost elasticity with respect to public transport. Thus, any percentage increase in the price for the public transport ticket would reduce its demand by a larger factor of the same change applied to car parking ticket. With respect to new alternatives’ elasticities, results show that e-bike, the most eco-friendly alternative, has the lowest elasticity. Looking at the car cross-elasticity, results show that the shuttle service would be the alternative that benefits more from such a change. A scenario in which the parking cost for car is doubled () would reduce car users from 18.9% to 8.5%, with an increase of public transport (15.4%), shuttle (51.1%), and e-bike users (21%).
Latent variables
Tangible aspects such as the introduction of new mean of transports or interventions on travel time and cost have an impact on people’s choices, but there are also intangible psychological components playing a significant role (Prillwitz & Barr, Citation2011). The latent construct identified in this research represents the perception of a double effect of tourism on the destination: tourism is seen as a cause of intolerance for the generation of traffic congestion (Latkova & Vogt, Citation2012; Li & Wan, Citation2013) but also as a driver for the development of a better transport infrastructure, which might be enjoyed by residents during low season. In fact, in a recent study, Vargas-Sánchez et al. (Citation2014) noticed that residents’ perception of the positive effect of tourism on the transport system is stronger during low season. People with a higher perception of the tourism impact on both traffic congestion and the improvement of the transport system have stronger preferences towards public transport and shuttle alternatives in the proposed choice tasks.
Managerial implications
Results of this research offer some guidelines for destination management organization of rural tourist sites affected by traffic congestion. The introduction of innovative means of transport might reduce the share of visitors choosing a car to get to natural areas but this has to be assessed considering that tourists and residents perceive differently travel time and hold different approaches towards mobility choices. In fact, tourists perceive more negatively travel time with respect to residents, ceteris paribus. This aspect might be due to different constraints that residents and tourists have; in fact, residents live relatively closer to their points of interest compared to tourists and have the chance to get to the valley more often, suffering less from time constraints than tourists. This result finds analogies with the distance decay theory (McKercher et al., Citation2008) showing that there is a correlation between the volume of people visiting a place and the distance between the destination and people’s origin. The decay curve increases until a certain threshold and then starts decreasing, meaning that in general, the increase in the distance between origin and destination impacts negatively on the volume of visitors, but this is true only when the distance is higher than a certain distance. Considering this theory, it is not surprising that travel time bears no statistically significant impact on residents’ utility, as they live closer to the destination and within a range that most likely falls in the non-decreasing interval of the decay curve. On the contrary, there is a statistically negative relationship between travel time and choice utility for tourists. From a micro-economic interpretation, tourists and residents are both rational agents aiming at maximizing their utility, but the utility obtained with the trip is not the same across all people. In fact, as Mokhtarian and Salomon (Citation2001) and Redmond and Mokhtarian (Citation2001) enunciate, it is possible to consider the utility derived from a trip simply as travelling to reach the destination or as travelling to enjoy the movement, having also the chance to perform other activities. Tourists, who can visit the valleys only during their holiday, have less time availability to enjoy the destination and this translates to a higher opportunity cost for travel time. Hence, differences in travel time sensitivity should be carefully considered by destination management organizations (DMOs) when planning a more sustainable mobility system.
Limitations and future research
This study is exploratory in nature and thus presents some limitations, which can hopefully be a stimulus for future studies. First, the sample size is limited to 224 respondents and the absence of official statistics regarding people travelling to the southern Swiss valleys does not allow to state whether the sample is representative or not of the reference population. Second, this research shows that there is an unobservable latent variable having a statistically significant impact on final choices and this latent construct has been measured on residents only with the purpose to understand their perception of tourism-generated transport issues. This said, it appears important in future studies to analyse the level of tourists’ perception regarding traffic congestion as well. For example, it would be important to assess the level of tourists’ acknowledgment of the congestion they generate and whether (and how much) they are willing to pay to “reimburse” the negative externalities they generate. Third, the identification of other psychological constructs would give a more accurate description of tourists’ behaviour and consequently would allow the development of a more efficient strategy for destinations aiming at developing a more sustainable transportation system to reduce traffic congestion. For example, latent variables could be used to understand the reasons of lower cost elasticity of e-bike with respect to other means of transport, or exploit the heterogeneity of travel time sensitivity for residents and tourists. Concerning other potential research paths, one may consider this study as a starting point for comparisons between different tourist settings. For example, one may think of two types of comparisons: one between two rural settings which show differences in the level of tourist congestion (one with high and one with low congestion) and similarities in the opportunity to develop new transport alternatives for a more sustainable mobility. Furthermore, it would be interesting to compare rural and urban settings which are interested by a problem of traffic congestion. These two very different settings would likely present alternate situations concerning residents’ perception of traffic (are urban citizens more tolerant than inhabitants of a valley?) and sustainable mobility opportunities (one may suppose that public transportation can be improved more efficiently in an urban setting).
Conclusions
Amongst the externalities caused by the excessive use of cars, traffic congestion, air pollution and lack of parking spaces are particularly damaging for nature-based tourist destinations. To preserve them, there is an urgent need from transport planners and DMO to find alternative sustainable solutions to the use of cars. Transportation planners of rural areas affected by traffic congestions have to be proactive in managing the situation before a sense of frustration grows amongst residents and leads to more extreme attitudes of repulsion towards external visitors and the tourism industry. To prevent it, this article investigates alternative mobility solutions for crowded remote areas. In particular, it posited a number of potential strategies based on the observation of the specific case of southern Switzerland valleys. Results of this paper show that the introduction of innovative means of transports may reduce traffic congestion and decrease the mobility-related environmental impact. More importantly, different reactions for residents and tourists were observed and discussed. To develop an efficient transportation system, it is necessary for transport planners to track the number of tourists and residents visiting remote areas. In fact, the effectiveness of the implementation of new transport services depends also on the share of residents and tourists visiting the destination. In our context, the introduction of a park-and-ride accompanied by a shuttle service might be a proper solution to reduce car users, with a stronger impact on tourists than residents, while the introduction of an e-bike network could have a stronger effect on the latter. The landscape of sustainable mobility solutions is rapidly changing, and it is essential to monitor their evolution and the possible adaptation to different context. The future planning of transportation systems should consider the means of transport as an experience that needs to adapt to the specific context. In our study, a trip in the valley is experienced differently with an e-bike network compared to the use of car, but other types of transport services, such as electric micromobility or automated road transport systems might be more indicated in different contexts. Transport planners need to test several alternative transport solutions to identify the most suitable to destinations’ characteristics.
Disclosure statement
No potential conflict of interest was reported by the author(s).
Notes
1 The term “overtourism” has recently gained popularity both at academic and non-academic level (Dickinson, Citation2018; Milano et al., Citation2018; Seraphin et al., Citation2018). A discussion concerning conceptual and semantic differences between crowding, overcrowding and overtourism goes beyond the intention of the present article. The reader may refer to Namberger et al. (Citation2019).
2 For a more varied set of results and a thorough discussion concerning visitor’s reaction to crowding, the reader may refer to Jacobsen et al. (Citation2019) and Schuckert and Wu (Citation2021).
3 The inflation rate considered consumer price index and remained quite stable (CPI_2017/CPI_2007 = +0.8%) between the years of the two studies, the values reported in Axhausen et al. (Citation2008) are equal to 18.99 CHF for car VTTS and 12.00 CHF for public transport considering prices of 2017 (https://www.bfs.admin.ch/bfs/en/home/statistics/prices/consumer-price-index.assetdetail.6286147.html).
4 The decrease of the market share for the “No choice” option is due to an aggregation bias, a distortion that comes from the use of the parameter estimated as representative for the “average” individual and applied to the entire sample.
References
- Aguiló, E., Palmer, T., & Rosselló, J. (2012). Road transport for tourism: Evaluating policy measures from consumer profiles. Journal of Research in International Education, 18(2), 261–274. https://doi.org/10.5367/te.2012.0120
- Albalate, D., & Bel, G. (2010). Tourism and urban public transport: Holding demand pressure under supply constraints. Tourism Management, 31(3), 425–433. https://doi.org/10.1016/j.tourman.2009.04.011
- Andereck, K. L., Valentine, K. M., Knopf, R. C., & Vogt, C. A. (2005). Residents’ perception of community tourism impacts. Annals of Tourism Research, 32(4), 1056–1076. https://doi.org/10.1016/j.annals.2005.03.001
- Axhausen, K. W., Hess, S., König, A., Abay, G., Bates, J. J., & Bierlaire, M. (2008). Income and distance elasticities of values of travel time savings: New Swiss results. Transport Policy, 15(3), 173–185. https://doi.org/10.1016/j.tranpol.2008.02.001
- Beck, M. J., Rose, J. M., & Hensher, D. (2013). Environmental attitudes and emissions charging: An example of policy implications for vehicle choice. Transportation Research Part A, 50, 171–182. https://doi.org/10.1016/j.tra.2013.01.015
- Beck, M. J., Rose, J. M., & Merkert, R. (2018). Exploring perceived safety, privacy and distrust on air travel choice in the context of differing passenger screening procedures. Journal of Travel Research, 57(4), 495–512. https://doi.org/10.1177/0047287517700316
- Becken, S., Simmons, D. G., & Frampton, C. (2003). Energy use associated with different travel choices. Tourism Management, 24(3), 267–277. https://doi.org/10.1016/S0261-5177(02)00066-3
- Beharry-Borg, N., & Hess, S. (2012). Accounting for latent attitudes in willingness-to-pay studies: The case of coastal water quality improvements in Tobago. Environmental and Resource Economics, 52(1), 109–131. https://doi.org/10.1007/s10640-011-9522-6
- Ben-Akiva, M. E., Lerman, S. R., & Lerman, S. R. (1985). Discrete choice analysis: Theory and application to travel demand (Vol. 9). MIT press.
- Bergin-Seers, S., & Mair, J. (2009). Emerging green tourists in Australia: The behaviours and attitudes. Tourism and Hospitality Research, 9(2), 109–119. https://doi.org/10.1057/thr.2009.5
- Dickinson, G. (2018, April). Dear dictionaries, this is why “overtourism” should be your 2018 word of the year. The Telegraph. https://www.telegraph.co.uk/travel/comment/overtourism-word-of-the-year/
- Dickinson, J. E., & Robbins, D. (2008). Representations of tourism transport problems in a rural destination. Tourism Management, 29(6), 1110–1121. https://doi.org/10.1016/j.tourman.2008.02.003
- Diedrich, A., & Garcia-Buades, E. (2009). Local perceptions of tourism as indicators of destination decline. Tourism Management, 30(4), 512–521. https://doi.org/10.1016/j.tourman.2008.10.009
- Evler, J. (2017). Sustainable tourism development of outdoor recreation sites – The case of Vallemaggia and Valle Verzasca in Switzerland (Master thesis). Faculty of Economics, Università della Svizzera italiana. http://www.otur.usi.ch/sites/www.otur.usi.ch/files/uploads/jan_evler_master_thesis_final.pdf
- Fleischer, A., Tchetchik, A., & Toledo, T. (2012). The impact of fear of flying on travelers’ flight choice. Choice model with latent variables. Journal of Travel Research, 51(5), 653–663. https://doi.org/10.1177/0047287512437856
- González, R. M., Conceptión, R., & Ortúzar, J. d. D. (2019). Preferences for sustainable mobility in natural areas: The case of Teide National Park. Journal of Transport Geography, 76, 42–51. https://doi.org/10.1016/j.jtrangeo.2019.03.002
- Goodwin, H. (2017). A new challenge “overtourism”. In: Responsible Tourism Blog. http://news.wtm.com/a-new-challenge-overtourism
- Hess, S., Bierlaire, M., & Polak, J. W. (2005). Estimation of value of travel-time savings using mixed logit models. Transportation Research Part A: Policy and Practice, 39(2–3), 221–236. https://doi.org/10.1016/j.tra.2004.09.007
- Hess, S., Train, K. E., & Polak, J. W. (2006). On the use of a modified Latin hypercube sampling (MLHS) method in the estimation of a mixed logit model for vehicle choice. Transportation Research Part B: Methodological, 40(2), 147–163. https://doi.org/10.1016/j.trb.2004.10.005
- Høyer, K. G. (2001). Sustainable tourism or sustainable mobility? The Norwegian case. Journal of Sustainable Tourism, 8(2), 147–160. https://doi.org/10.1080/09669580008667354
- Jacobsen, J., Iversen, N. M., & Hem, L. E. (2019). Hotspot crowding and over-tourism: Antecedents of destination attractiveness. Annals of Tourism Research, 76, 53–66. https://doi.org/10.1016/j.annals.2019.02.011
- Jo, M. W., Kim, H., & Shin, H. J. (2016). Understanding traffic congestion to improve tourist satisfaction in local tourism. International Journal of Tourism and Hospitality Research, 30(4), 85–95. https://doi.org/10.21298/IJTHR.2016.04.30.4.85
- Johansson, M. V., Heldt, T., & Johansson, P. (2006). The effects of attitudes and personality traits on mode choice. Transportation Research Part A, 40(6), 507–525. https://doi.org/10.1016/j.tra.2005.09.001
- Jurado, E. N., Damian, I. M., & Fernández-Morales, A. (2013). Carrying capacity model applied in coastal destinations. Annals of Tourism Research, 43, 1–19. https://doi.org/10.1016/j.annals.2013.03.005
- Kamargianni, M., & Polydoropoulou, A. (2013). Hybrid choice model to investigate effects of teenagers’ attitudes toward walking and cycling on mode choice behavior. Transportation Research Record: Journal of the Transportation Research Board, 2382(1), 151–161. https://doi.org/10.3141/2382-17
- Kelly, J., Haider, W., & Williams, P. W. (2007). A behavioral assessment of tourism transportation options for reducing energy consumption and greenhouse gases. Journal of Travel Research, 45(3), 297–309. https://doi.org/10.1177/0047287506292700
- Kelly, J., Haider, W., Williams, P. W., & Englund, K. (2007). Stated preferences of tourists for eco-efficient destination planning options. Tourism Management, 28(2), 377–390. https://doi.org/10.1016/j.tourman.2006.04.015
- Kim, J., Rasouli, S., & Timmermans, H. (2014). Hybrid choice models: Principles and recent progress incorporating social influence and nonlinear utility functions. Procedia Environmental Sciences, 22, 20–34. https://doi.org/10.1016/j.proenv.2014.11.003
- Kløjgaard, M. E., & Hess, S. (2014). Understanding the formation and influence of attitudes in patients’ treatment choices for lower back pain: Testing the benefits of a hybrid choice model approach. Social Science & Medicine, 114C, 138–150. https://doi.org/10.1016/j.socscimed.2014.05.058
- Latkova, P., & Vogt, C. A. (2012). Residents’ attitudes toward existing and future tourism development in rural communities. Journal of Travel Research, 51(1), 50–67. https://doi.org/10.1177/0047287510394193
- Li, X., & Wan, Y. K. P. (2013). Residents’ attitudes toward tourism development in Macao: A path model. Tourism Analysis, 18(4), 443–455. https://doi.org/10.3727/108354213X13736372326073
- Lumsdon, L. (2000). Transport and tourism: Cycle tourism – A model for sustainable development? Journal of Sustainable Tourism, 8(5), 361–377. https://doi.org/10.1080/09669580008667373
- Mariel, P., Meyerhoff, J., & Hess, S. (2015). Heterogeneous preferences toward landscape externalities of wind turbines – combining choices and attitudes in a hybrid model. Renewable and Sustainable Energy Reviews, 41, 647–657. https://doi.org/10.1016/j.rser.2014.08.074
- Martin-Cejas, R. R., & Ramirez Sanchez, P. P. (2010). Ecological footprint analysis of road transport related to tourism activity: The case for Lanzarote Island. Tourism Management, 31(1), 90–103. https://doi.org/10.1016/j.tourman.2009.01.007
- Mason, P., & Cheyne, J. (2000). Residents’ attitudes to proposed tourism development. Annals of Tourism Research, 27(2), 391–411. https://doi.org/10.1016/S0160-7383(99)00084-5
- McKercher, B., Chan, A., & Lam, C. (2008). The impact of distance on international tourist movements. Journal of Travel Research, 47(2), 208–224. https://doi.org/10.1177/0047287508321191
- Milano, C., Cheer, J. M., & Novelli, M. (2018). Overtourism is becoming a major issue for cities across the globe. World Economic Forum. https://www.weforum.org/agenda/2018/07/overtourism-a-growing-global-problem
- Mokhtarian, P. L., & Salomon, I. (2001). How derived is the demand for travel? Some conceptual and measurement considerations. Transportation Research Part A: Policy and Practice, 35(8), 695–719. https://doi.org/10.1016/S0965-8564(00)00013-6
- Moscardo, G., Pearce, P., & Morrison, A. (2001). Evaluating different bases for market segmentation: A comparison of geographic origin versus activity participation for generating tourist market segments. Journal of Travel and Tourism Marketing, 10(1), 29–49. https://doi.org/10.1300/J073v10n01_03
- Muler Gonzalez, V., Coromina, L., & Galí, N. (2018). Overtourism: Residents’ perceptions of tourism impact as an indicator of resident social carrying capacity – case study of a Spanish heritage town. Tourism Review, 73(3), 277–296. https://doi.org/10.1108/TR-08-2017-0138
- Namberger, P., Jakisch, S., Schmude, J., & Karl, M. (2019). Overcrowding, overtourism and local level disturbance: How much can Munich handle? Tourism Planning and Development, 16(4), 452–472. https://doi.org/10.1080/21568316.2019.1595706
- Neuts, B., & Nijkamp, P. (2012). Tourist crowding perception and acceptability in cities: An applied modelling study on Bruges. Annals of Tourism Research, 39(4), 2133–2153. https://doi.org/10.1016/j.annals.2012.07.016
- Orsi, F., & Geneletti, D. (2014). Assessing the effects of access policies on travel mode choices in an Alpine tourist destination. Journal of Transport Geography, 39, 21–35. https://doi.org/10.1016/j.jtrangeo.2014.06.015
- Palma, D., Ortuzar, J. D. D., Rizzi, L. I., & Casabuon, G. (2018). Modelling consumers’ heterogeneous preferences: A case study with Chilean wine consumers. Australian Journal of Grape and Wine Research, 24(1), 51–61. https://doi.org/10.1111/ajgw.12297
- Pettebone, D., Newman, P., Lawson, S. R., Hunt, L., Monz, C., & Zwiefka, J. (2011). Estimating visitors’ travel mode choices along the Bear Lake Road in Rocky Mountain National Park. Journal of Transport Geography, 19(6), 1210–1221. https://doi.org/10.1016/j.jtrangeo.2011.05.002
- Prillwitz, J., & Barr, S. (2011). Moving toward sustainability? Mobility styles, attitudes and individual travel behaviour. Journal of Transport Geography, 19(6), 1590–1600. https://doi.org/10.1016/j.jtrangeo.2011.06.011
- Redmond, L. S., & Mokhtarian, P. L. (2001). The positive utility of the commute: Modeling ideal commute time and relative desired commute amount. Transportation, 28(2), 179–205. https://doi.org/10.1023/A:1010366321778
- Rose, J., & Bliemer, M. (2009). Constructing efficient stated choice experimental designs. Transport Reviews, 29(5), 587–617. https://doi.org/10.1080/01441640902827623
- Ryan, C., & Cessford, G. (2003). Developing a visitor satisfaction monitoring methodology: Quality gaps, crowding and some results. Current Issues in Tourism, 6(6), 457–507. https://doi.org/10.1080/13683500308667966
- Saenz-de-Miera, O., & Rossellò, J. (2012). The responsibility of tourism in traffic congestion and hyper-congestion: A case study from Mallorca, Spain. Tourism Management, 33(2), 466–479. https://doi.org/10.1016/j.tourman.2011.06.015
- Sarman, I., Curtale, R., & Hajibaba, H. (2019, May 13). Drivers of travel insurance purchase. Journal of Travel Research, 59(3), 545–558. https://doi.org/10.1177/0047287519843187
- Saveriades, A. (2000). Establishing the social tourism carrying capacity for the tourist resorts of the east coast of the republic of Cyprus. Tourism Management, 21(2), 147–156. https://doi.org/10.1016/S0261-5177(99)00044-8
- Schuckert, M., & Wu, J. (2021). Are neighbour tourists more sensitive to crowding? The impact of distance on the crowding-out effect in tourism. Tourism Management, 82, 104185. https://doi.org/10.1016/j.tourman.2020.104185
- Seraphin, H., Sheeran, P., & Pilato, M. (2018). Over-tourism and the fall of Venice as a destination. Journal of Destination Marketing and Management, 9, 374–376. https://doi.org/10.1016/j.jdmm.2018.01.011
- Smith, M. K., Sziva, I. P., & Olt, G. (2019). Overtourism and resident resistance in Budapest. Tourism Planning and Development, 16(4), 376–392. https://doi.org/10.1080/21568316.2019.1595705
- Swiss Federal Statistical Office. (2017a). Ständige Wohnbevölkerung nach Staatsangehörigkeitskategorie, Alter und Kanton, 3. Quartal 2017. Release date: December 14, 2017. Retrieved August 12, 2019, from https://www.bfs.admin.ch/bfs/it/home/statistiche/popolazione.assetdetail.3942289.html
- Swiss Federal Statistical Office. (2017b). Touristische Beherbergung in der Sommersaison 2017. Release date: December 5, 2017. Retrieved August 12, 2019, from https://www.bfs.admin.ch/bfs/it/home/statistiche/turismo.assetdetail.3822646.html
- Taff, D., Newman, P., Pettebone, D., White, D. D., Lawson, S. R., Monz, C., & Vagias, W. M. (2013). Dimensions of alternative transportation experience in Yosemite and Rocky Mountain National Parks. Journal of Transport Geography, 30, 37–46. https://doi.org/10.1016/j.jtrangeo.2013.02.010
- Train, K. E. (2009). Discrete choice methods with simulation. Cambridge University Press.
- Vargas-Sánchez, A., Porras-Bueno, N., & de los Ángeles Plaza-Mejía, M. (2014). Residents’ attitude to tourism and seasonality. Journal of Travel Research, 53(5), 581–596. https://doi.org/10.1177/0047287513506295
- Vaske, J. J., & Shelby, L. B. (2008). Crowding as a descriptive indicator and an evaluative standard: Results from 30 years of research. Leisure Studies, 30(2), 111–126. https://doi.org/10.1080/01490400701881341
- Yang, C. H., & Lo, P. L. (2018). How the influx of Chinese tourists affects national tourism behaviors: Evidence from Taiwan. International Journal of Tourism Research, 20(5), 453–553. https://doi.org/10.1002/jtr.2204
- Yazdanpanah, M., & Hosseinlou, M. H. (2016). The influence of personality traits on airport public transport access mode choice: A hybrid latent class choice modeling approach. Journal of Air Transport Management, 55, 147–163. https://doi.org/10.1016/j.jairtraman.2016.04.010
- Zehrer, A., & Raich, F. (2016). The impact of perceived crowding on customer satisfaction. Journal of Hospitality and Tourism Management, 29, 88–98. https://doi.org/10.1016/j.jhtm.2016.06.007