
ABSTRACT
The aim of this article is to elucidate and discuss the results of the 2016 Diversity Barometer (Mångfaldsbarometern) and compare these results with those obtained from ten years of the longitudinal Diversity Barometers for 2005–2014. An additional aim is to demonstrate whether and how Swedish people’s experiences of and attitudes toward people with a foreign background and ethnic diversity have changed.
A random sample of the Swedish population took part in the annual study, which was carried out in the form of a nationwide postal survey. The results show that negative attitudes toward ethnic and cultural diversity in general, and migrant population in particular, have increased to some extent and with respect to certain issues. Views on diversity in relation to culture and religion – especially Islam – were more negative than views on diversity in relation to work. Those who have larger experience of contact with foreigners show a more positive attitude toward diversity compared with those with limited experience and contact. Individuals who have higher education, those who identify themselves as female, younger persons and those living in large cities are more positive than other groups. In our analysis of the empirical data, we proceeded from a social work perspective and applied contact theory and group conflict theories relating attitudes to group position.
Diversity barometer: attitude changes in sweden
Swedish people’s attitudes toward reception of refugees are studied annually in the national Society Opinion Media (SOM) surveys.Footnote1 A more comprehensive approach to elucidating Swedes’ attitudes toward immigration and ethnic diversity has been presented in the Diversity Barometer (Mångfaldsbarometern) during the period 2004–2014 (Ahmadi et al. Citation2015), showing an increased degree of positive attitudes toward ethnic diversity and immigrants.
In the current article, we present the most recent results of the Diversity Barometer carried out in 2016.Footnote2 These results are of particular importance because the study was conducted after the influx of thousands of new refugees. The influx of refugees during 2015 increased the number of foreign-born individuals in Sweden by 163,000, which was the greatest proportion of refugee migration (Migrationsverket Citation2016). Moreover, after 2015, Swedish government policy on accepting refugees transitioned into a negative phase as regards newly arrived refugees. The interesting question here is whether the general attitude of the population has also changed. The study from 2016 bears witness to these changes. We have not yet examined the reasons for these changes in our survey, yet we will put forward some assumptions in the present paper.
Interaction between Swedish inhabitants and people with foreign background, especially Muslims, is an issue that brings to the fore the problem of inclusion and exclusion. The question of increased negative attitudes toward migration, in particular, and cultural and ethnic diversity, in general, is highly relevant to social work practice and research, especially with regard to discourses on marginalization and social exclusion. Negative attitudes toward cultural and ethnic diversity in a society may lead to both an increase in and normalization/legitimization of discrimination and social exclusion of certain groups, which in turn may aggravae tensions, conflicts and even violence in different segments of society. A recent study (Asztalos, Morell and Darvishpour Citation2018) shows how negative attitudes toward refugees negatively affect the health, well-being and integration of unaccompanied migrant youth and increase their vulnerability. Other studies (Wigerfelt and Wigerfelt Citation2017) also show that negative attitudes have increased the number of hate crimes targeting migrant and refugee populations. This is a major challenge for social services workers who, among other issues, are supposed to counteract social exclusion and promote integration and inclusion of migrants and refugees. An increased negative attitude toward migrants and cultural and ethnic diversity may also cause a tougher climate on the job market, leading to even more segregation and increased gaps between the mainstream and marginalized migrant populations.
Previous research (see, e.g., Darvishpour Citation2013) shows that increasing negative attitudes toward groups that already are marginalized can increase the risk of these groups experiencing greater marginalization and vulnerability. In this respect, we confine ourselves to general positive and negative attitudes toward ethnic diversity and, more specifically, experiences of contact with people with a foreign background – from a social work perspective.
Methodology
The target group of the present study is the adult population (age range 18 to 75 years) living in Sweden. A probability randomized sample was taken using the SPARFootnote3 register, the goal being a sample that is representative of this population.
The net sample size is 674 individuals. The response rate of the survey is 28%. Data collection was carried out using a postal survey. In the present study, with a sample size of 674 persons., the margin of error for a result of 50% is rounded to ± 4%, which means that the true result for the population, at a confidence level of 95%, is found within the interval 46–54%. Results around 10 or 90% have a margin of error rounded to ± 2%, which means that the true result for the population, at a confidence level of 95%, is found within the interval 8%-12% or 88%-92%, respectively. Similarly, in the case of results around 3% or 97%, the margin of error is rounded to ± 1%.
Considering the age distribution, it turns out there are rather more older than younger individuals in the sample, which is certainly true of the Swedish population as well, though the population age distribution is not as skewed as that of the sample.
Because the number of persons in the youngest age group (18–30 years) is underrepresented and just 7% of the sample (thus amounting to 44 individuals), the results pertaining to this group should be interpreted with some caution.
The 2016 sample is relatively balanced regarding the proportion of women and men, although there are to a certain degree more women in the sample than what is indicated by Statistics Sweden’s population figures. The age group 31–50 years is also to some extent smaller in the sample than in the population. Thus, the older age groups in the sample are somewhat larger than their actual proportions in the Swedish population (see the ). The fact that almost 70% of respondents were 50 years of age and older may have affected the results. The results of the previous years of Diversity Barometers (2005–2014) show that the older the respondents were, the more likely they were to have negative attitudes toward ethnic diversity and migration (Ahmadi et al. Citation2015). Regarding level of education, we see a response pattern with a degree of underrepresentation of upper secondary education and overrepresentation of the category ‘high education’.
Figure 1. Description of sample.
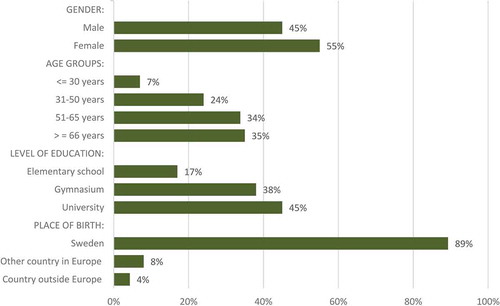
Concerning ethnic background, it should be mentioned that among people 18 years or older, 88.7% were born in Sweden and 11.3% were born outside of Sweden (Type 1 foreign). Another 0.2% were born in Sweden but with both parents born outside Sweden (Type 2 foreign).Footnote4
In the following, we first present the results of the study and then, at the end, put forward our analysis and discussion.
Results
In this section, we will present our results under three major topic headings:
Experiences of contact with people with a foreign background
General positive attitudes toward diversity
General negative statements concerning diversity
Furthermore, under each topic, the results are presented in relation to the sub-topics gender, age, and education.
Experiences of contact with people with a foreign background
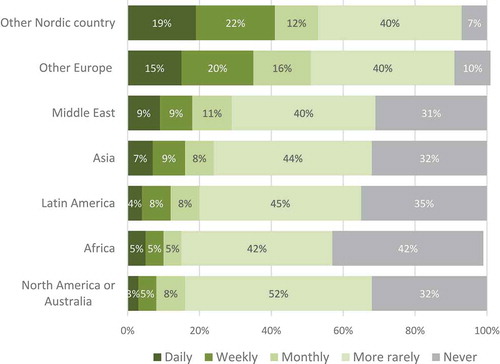
The results for 2016 show that about half of respondents have contact with people from other parts of Scandinavia at least once a month. As many as 19% have daily contact with people from neighboring countries.
Contact with people from other places in Europe, outside Scandinavia, is similar, though slightly less frequent. Having contact with people from Scandinavia or elsewhere in Europe is much more common than having contact with people from other continents. Only three in ten respondents have contact with people from the Middle East at least once a month. Less than one in ten have daily contact with someone from that region.
Regarding frequency of contacts, in descending order (see ), it is notable that more than three in ten respondents report never having contact with someone from the Middle East, Asia, Africa, Latin America or North America/Australia.Footnote5 It should be mentioned that for year 2016, the population (N) is 674 in all figures.
Figure 2. How often Swedish inhabitants interact with people with foreign background.
In , we can see that the proportion of respondents, who have rather good or very positive experiences of working with colleagues with a foreign background during the last three years, is between 67%-72 %. About one in ten respondents (9%-10) have rather negative or very negative experiences of working with people with a foreign background.
Figure 3. Good or bad experiences of working/studying with people with a foreign background.
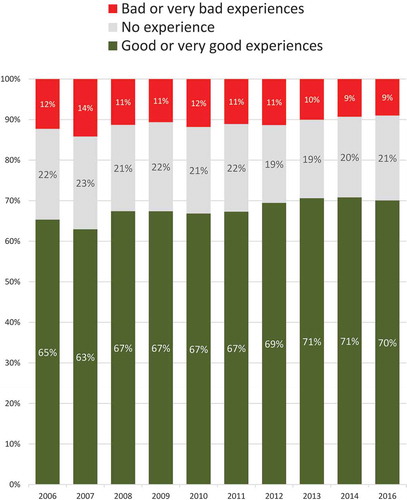
This proportion of people with negative experiences has been stable over the past ten years. Thus, despite the increase in immigration during recent years, the respondents’ perception of how well their interactions with people from other countries have functioned on the whole has not changed.
If slightly more than 30% reported not having contact with people outside Europe (in response to the previous question), then the responses to this question show a similar outcome, in that slightly more that 20% report not having any experience at all of someone with a foreign background, neither at school nor at work.
Gender: A greater proportion of women than of men reported having rather good or very good work- or school-related experiences of people with a foreign background. However, this difference was not significant.
Almost three in four women have positive work- or school-related experiences of people with a foreign background. This positive trend among women, with a maximum value of 74% – the highest value yet in the measurements – has now stabilized at to some degree lower level of 72%. To be sure, fewer than one in ten women report having negative experiences, but that group has increased marginally, by two percentage points.
As shows, more than two in three men have positive work- or school-related experiences of people with a foreign background. The group of men with these positive experiences has been stable for the past few years. Moreover, the proportion of men who report having negative experiences is now lower than in any of the previous measurements, with only 9% reporting such experiences.
Age: According to , good work- or school-related experiences of people with a foreign background are most common among the youngest group, and this has been true in all of the measurements over the years. This value has been over 80% during the past three years. In the two middle-aged groups, the proportions with positive experiences are 76 and 74%, respectively. In the oldest group, the corresponding figure is 61%. The reason the outcome for the oldest group is relatively low is that a large proportion of these respondents have no experience at all because they are retirees and never met people with a foreign background at school or at work.
Figure 4. Good or bad experiences of working/studying with people with a foreign background (Gender).
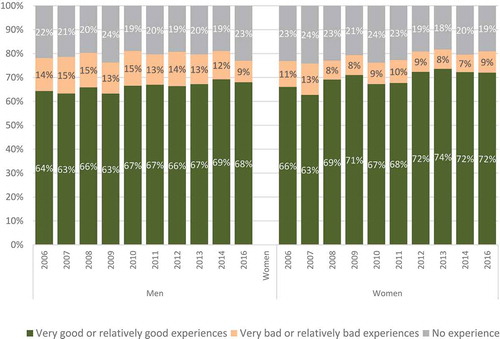
Figure 5. Good or bad experiences of working/studying with people with a foreign background (Age).
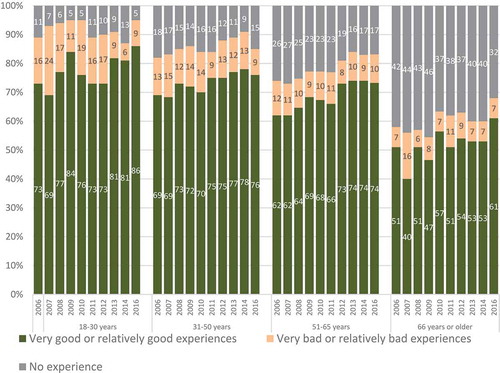
The proportion of respondents reporting good work- or school-related experiences of people with a foreign background has increased since the previous measurement among the oldest and the youngest group. Moreover, the level is stable among those over 50 years of age and decreasing somewhat among 31- to 50-year-olds. No clear trends can be found based on the latest three measurements; but if we look back 10 years, since 2006, we see positive trends among all four age groups, with increasingly large groups reporting positive experiences of people from other countries.
Education: As noted earlier, there are no significant differences in attitudes among men and women, but there are differences between age groups and people with different educational backgrounds: The younger the group, the more positive they were toward people with a foreign background; the higher education the group had, the more positive they were (university graduates were most positive).
reveals what would seem to be a strong correlation between having good work- or school-related experiences of people with a foreign background and level of education. The higher one’s education level, the better one’s experiences.
Figure 6. Good or bad experiences of working/studying with people with a foreign background (Education).
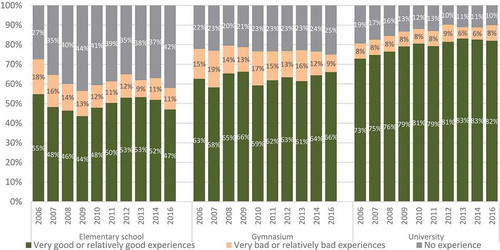
A considerably larger proportion of respondents with a university education have positive experiences of people with a foreign background, and this has been the case since 2005. The proportion with positive experiences has also increased over the years, from 75% to a stable level just over 80% for the past four years. For 2016, the figure was 82%.
Among respondents with an upper secondary school education, the proportion reporting good work- or school-related experiences of people with a foreign background is somewhat lower (66%) and has been at this level since 2005.
Across all three levels of education, there is a group of respondents in 2016, amounting to 8–11%, who report having negative experiences of people with a foreign background. The long-term trend is that the proportion with negative experiences has decreased within the elementary and the upper secondary school groups, while it has remained stable among people belonging to the group with university education.
It is notable that as many as 42% of respondents with only a secondary school education have no workplace experience of people with a foreign background. Such experiences are correlated with education level: the higher one’s education, the more likely one is to have had positive experiences.
If we combine age and education level and study respondents with good and negative work- or school-related experiences of people with a foreign background, we find that, regardless of age, the group with university studies is more likely to have had positive experiences of these people. All age groups essentially follow the same pattern: the higher one’s education level, the more likely one is to have had positive experiences – the lower one’s education level, the more likely one is to have had negative experiences.
To be sure, compared to respondents at lower educational levels, a greater proportion of those with a high education, across all age groups, report having positive experiences, but the major difference is that those with a lower education level are more likely to lack any experience of people with a foreign background than they are to have had negative experiences. In principle, respondents with only a secondary school education are just as likely to have had positive experiences as they are to have had no experiences at all. No age or education group includes more than 13% with negative experiences.
To provide a better picture of the impact of different demographic factors (age and education) on informants’ work- or school-related experiences of colleagues with a foreign background in 2016, we measured the correlation between these factors. Given that gender is a nominal variable and not a continuous variable, we did not measure the correlation between it and the positive experiences of colleagues with a foreign background, and confined ourselves to age and education.
Table 1. Correlation between good work- or school-related experiences of colleagues with a foreign background and age and education.
As the above table indicates, the strength of the correlation between positive work- or school-related experiences of colleagues with a foreign background and age and education, respectively, is as follows: age (weak negative correlation, −0.119Footnote6 – worse experiences the older you get) and education (weak positive correlation, 0.267 – better experiences the higher education you have).
General positive attitudes toward diversity
This part of the article accounts for respondents’ attitudes toward three different positive statements about the rights and opportunities enjoyed by persons newly arrived to Sweden: the opportunity to preserve their culture, the right to the same social entitlements as citizens have, and the opportunity for parents/children to preserve their native language.
Half of the respondents are in favor of Swedish society creating opportunities for people with a foreign background to preserve their cultural traditions. In contrast, 31% believe the opposite, that is, that society should not create such opportunities. Members of the latter group are instead in favor of assimilation into the Swedish culture (Mångfaldsbarometern Citation2016).
After attitudes remaining relatively stable across all of the measurement periods and after the positive trend seen for the previous measurement, the increase seen in recent years has disappeared and the figure returned once again to around 50%. At present, the result is at 49%, which is the lowest value to date, though it has been at 50% (ibid.).
About 30% are not in favor of society creating opportunities for people with a foreign background to preserve their cultural traditions. These negative attitudes toward diversity are also highly stable over time (ibid.).
In summary, the proportion of respondents with negative attitudes in this regard has not increased, but the proportion with positive attitudes has decreased. The group that has no opinion has grown from 13 to 20%, thus a shift in opinion has occurred from being explicitly positive to not taking a stand (ibid.).
Previously, the clear majority of the population was in favor of everyone having the same social entitlements, regardless of whether someone was born in Sweden or abroad. This is a striking example of how well rooted the notion of equality has been in Sweden. At present, however, the increasing trend in this regard has been broken, and the proportion of respondents who favor equality of entitlements has decreased from 77 to 55%. That is the lowest value for this issue since 2005. Yet it is still notable that the majority of respondents support this statement (ibid.).
The clear majority (60%) of the population agree completely or partially with the statement that it is good when people who come to Sweden preserve their native language and teach it to their children. These results are highly stable, remaining at around 60% ever since the measurements began in 2005. All previous figures have been within the interval 56–61% (ibid.).
The proportion of respondents who disagree with this statement about preserving the native language has decreased slightly, however. It is now at 19%, the lowest figure thus far (ibid.).
A positive diversity index (see 7) has been created for each of these three positive statements about diversity. The purpose of the index is to see more clearly possible trends over time by balancing those who agree and those who disagree with each statement.
shows the trends over the 11 years during which attitudes toward diversity have been measured. One can clearly see from the index that the values for all three statements have remained relatively stable over time. However, as discussed above, attitudes toward social entitlements have decreased greatly, which is also reflected in this index, together with the right for foreign-born people to preserve their cultural traditions, where index values have also decreased, though to a lesser extent. Attitudes toward the right to one’s native language have been highly stable, even after this index was created.Footnote7
Figure 7. Three positive statements about diversity.
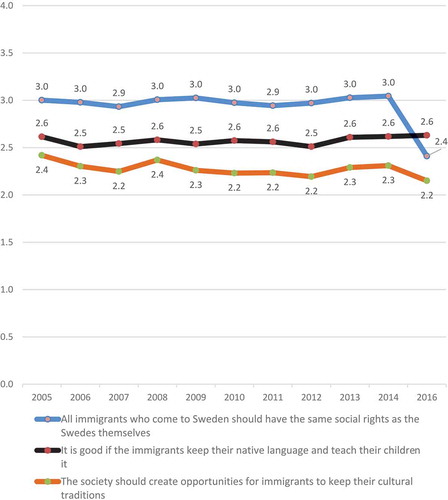
In summary, the respondents’ attitudes are mostly positive in relation to letting foreign-born people preserve their native language and to some extent less positive in relation to equal access for all to Swedish social entitlements. Once again, cultural rights receive the lowest attitude values, and this has been the case since 2005.
As indicates, the strength of the correlation between the ‘variable 1-positve’ and age is 0.187 (weak negative), while the correlation between this variable and education is 0.260 (weak positive).
Table 2. Correlation between positive statements and age and education.
The strength of the correlation between the ‘variable 2-positve’ and age is −0.154 (weak negative), while the correlation between this variable and education is 0.295 (weak positive). The strength of the correlation between the ‘variable 3-positve’ and age is −0.057 (weak negative), while the correlation between this variable and education is 0.264 (weak positive).
General negative statements concerning diversity
This section focuses on the general negative statements concerning diversity (see ).
Figure 8. Three negative statements about diversity (Base: Swedish population aged 18–75).
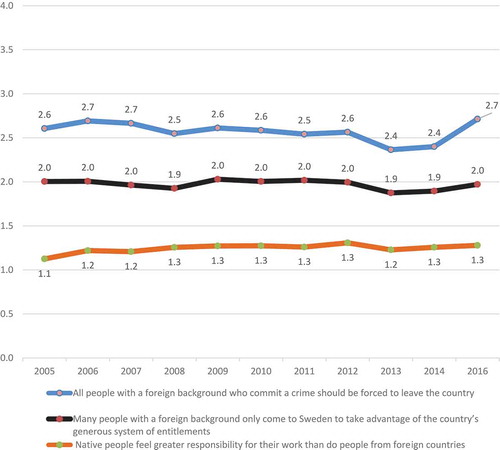
The most negative statement, one that truly divides the population, proposes that many people with a foreign background only come to Sweden to take advantage of the country’s generous system of entitlements. Four in ten respondents agree with this statement, while another 4 in ten disagree.
Both the negative and positive proportions are found in the middle of the respective intervals in which the attitudes have fluctuated since 2005. There are no extreme values for 2016.
As indicates, once again, the most negative attitudes toward diversity are found for the statement that all people with a foreign background who commit a crime should be forced to leave the country. After a few years of lower values, around 55%, the attitudes have once again increased to levels measured in the population during the period 2006–2007, which entails an increase from last year’s measurement and a return to what were previously normal values (Ahmadi, Palm, and Ahmadi Citation2016). The clear majority (64%) now agree with this statement, partially or completely (ibid.). Immigration in combination with criminal activity triggers strong negative attitudes among respondents.
Similarly, the proportion of respondents who disagree with this statement has decreased to 22%, which implies a negative trend based on three measurement occasions (ibid.).
At present, fewer agree with the statement that ethnic Swedes feel greater responsibility for their work than do people from foreign countries. The proportion agreeing with this statement has decreased from 19% in the previous measurement to 14% in the current one (ibid.). This is the lowest value measured since 2005. However, it is not the case that more respondents disagree with the statement, but instead that more have indicated their uncertainty.
Nonetheless, the majority still disagree completely or partially with this statement.
To break down the results across social groups and to see their trends over time, the results have been converted to an index (4–0) instead of the previous practice of showing the proportion of the population, the goal of this conversion being to have one value for each year. The higher the mean value, the more negative one is.
Men’s and women’s rank orders for these statements are identical. The strongest attitude of both men and women concerns the notion that people who commit a crime should be deported. The next strongest attitude of both groups concerns the notion that people come to Sweden solely to take advantage of the generous system of social entitlements. Finally, there are very few women and men who agree with the statement that the Ethnic Swedes assume greater responsibility for their job than do people with a foreign background.Footnote8
As previously mentioned in this report, regarding many questions, men have more negative attitudes toward the multicultural society, and this is true in relation to these issues as well; but, regarding these issues, it is women who have become more negative since the previous measurement, particularly concerning the statement on deportation in cases of criminality. At present, women’s attitudes toward this question are harsher than men’s. Men have also become to a certain degree more negative in relation to foreign-born people who commit crimes, but the increase in negativity among men is smaller than that among women. Men have become less negative in that they are less likely to agree with the statement that people come to Sweden solely for the social entitlements.
As indicates, the strength of the correlation between the ‘variable 1-negative’ and age is −0.061 (weak positive), while the correlation between this variable and education is −0.292 (weak negative).
Table 3. Correlation between negative statements and age and education.
The strength of the correlation between the ‘variable 2-negative’ and age is 0.162 (weak positive), while the correlation between this variable and education is −0.313 (weak negative). The strength of the correlation between the ‘variable 3-negative’ and age is 0.129 (weak positive), while the correlation between this variable and education is −0.357 (weak negative).
These results are in accordance with the results obtained concerning the index of positive attitudes.
General index on attitudes toward diversity
A general index on attitudes toward diversity has been constructed using the negative statements on diversity (1.”The less one notices all the people with a foreign background, the better”, 2.”People born in Sweden feel more responsibility for their job than do people with a foreign background who have come to Sweden”, 3.”Many people with a foreign background come to Sweden solely to take advantage of our social entitlements”) as well as the positive statements (1.”Society should create opportunities for people with a foreign background to preserve their cultural traditions”, 2.”All people with a foreign background who come here must be given the same rights as people in the population have” and 3.”It is good if people with a foreign background who have come to Sweden preserve their native language and teach it to their children”).
According to this index, attitudes toward diversity have always fallen within the interval 2.0–2.57. In this year’s measurement, the index is at 2.0, which constitutes a low also seen in 2012. After a positive trend during the period 2012–2014, this index value has now decreased.
Now and throughout the years of measurement, women have had more positive attitudes than men have toward diversity, something that can also be seen in the . The negative trend shown for the total on the previous page is now explained, as this figure shows that it is among women that attitudes have worsened greatly. The index value for women is the lowest measured to date. Men’s attitudes are stable.
Regarding the association between education level and attitudes toward diversity, we see that even in this regard respondents with a higher education level have the most positive attitudes toward diversity, and consequently that those with only a secondary education have the most negative attitudes.
Attitudes among the university educated have been stable for several years, hovering around 4.0. The outcome for 2016 is 3.9, which is a decrease compared with the past two measurement years. It is not the lowest value thus far, but is near the average.
Following several measurements among respondents with an upper secondary education where the index values decreased, there was a positive trend across the past four measurement occasions. This trend, however, is now broken, and the outcome has dropped, reaching the lowest previously measured value of 0.9.
We can even observe a decline among respondents with a secondary school education only, a group that already has the most negative attitudes toward diversity. In 2016, this group has the lowest index value ever reported. Once again, the variable of education is highly correlated with attitudes toward diversity. We also see, as before, a pattern in which young people have the most positive and older people the least positive attitudes toward diversity.
As far as trends are concerned, there is a great increase for young people, who have the best results to date and who show a positive trend. We can also discern a certain increase among older people, but so far this rise is only temporary.
The decrease in attitudes toward diversity can instead be found among respondents in the over middle-age category, who show a greatly worsened result, although not the lowest index values to date. We can also discern a negative trend among the younger middle-aged, though the result has not worsened to any great degree.
It should be mentioned that one striking result concerning attitudes toward diversity is views on religion. The 2016 Diversity Barometer shows that informants believe different religions have different values. When asked which religion they feel has negative values that go against, e.g., human rights, as many as 84% pointed out Islam. One in five even include Hinduism and Judaism in the category of religions whose values are in conflict with human rights. A few included Christianity and Buddhism, too, in this category (Ahmadi, Palm, and Ahmadi Citation2016).
Analysis and discussion
Based on the results of the 2016 Diversity Barometer, presented above, we can draw the following conclusions: 1- In general, attitudes toward cultural diversity and migration became more negative compared to the results of similar studies carried out during 2005–2014. 2- Individuals with lower levels of education, men, older persons, individuals living in smaller cities and rural areas and those who have had less contact and experience of interacting with foreigners have a more negative attitude toward migration.
Although it has not been our intention to carry out a quantitative analysis of the practical significances of the attitude differences between the groups studied in our survey, we will emphasize that our results reveal considerable possible consequences for social integration and social services work in Swedish society, as shown in the theoretical sections below.
In our analysis of the empirical data, we have proceeded from a social work perspective. We have then applied contact theory, group conflict and group threat theories relating attitudes to group orientations. Because this research tradition puts its main emphasis on greater contextual factors – such as economic crisis, increasing xenophobia, and demographic changes in the population structure and their implications for changes in attitudes toward migration and ethnic diversity (Hjerm Citation2009) – it is employed for studying changes in attitudes across a broad spectrum.
Our results show that negative attitudes toward migration and ethnic diversity are related, among other things, to informants’ experiences of contacts with migrants. For example, attitudes toward immigrants and ethnic diversity at the workplace and at school are more positive compared with other settings. This result is in line with findings from previous years’ Diversity Barometers (2005–2014) and can be explained by employing group contact theory. According to Allport (Citation1954), where there is no personal relationship and contact between members of the minority and majority groups, there is greater risk for emergence of negative attitudes. This, in turn, can explain why respondents in our study who have had less experience and contact with immigrants show more negative attitudes toward migrants. However, a prerequisite for contact between groups having a positive impact is that this contact should take place on equal terms, with common goals and through institutional support. Therefore, segregation can further reinforce negative attitudes (Semyonov and Glikman Citation2009)
Another result of the 2016 Diversity Barometer shows that low-educated people have the most negative attitudes toward people with a foreign background. People with a higher education level have more positive attitudes. One explanation for this may be that people with a higher education level have more contact with immigrants who are established in their new country, have more anti-racist understandings and are more likely to have travelled abroad. Moreover, educated people often have a stable employment situation, allowing them to feel less threatened. Along the same lines, less well-educated people are more likely to feel that their jobs are being threatened. According to ‘strain theory,’ which focuses on structural fluctuations, feelings of insecurity and frustration over personal losses and failures may lead to stronger negative attitudes and behavior. These attitudes and behavior can be directed toward ‘the others.’ This is often shown to be the case when analyzing the roots of negative attitudes among persons with low levels of education and persons living in smaller communities.
Based on group conflict theory (Quillians Citation1995), increased negative attitudes toward immigrants can be generally explained in terms of both feelings of concern over the redistribution of resources (particularly in times of economic distress) and the combination of vulnerable work situations and a drastic increase in the influx of migrants (like what occurred during 2015). Circumstances such as these may cause people who are economically vulnerable to be more likely to see immigrants as a threat on the labor market and to the welfare system (Lancee and Pardos-Prado Citation2013). However, attitudes toward immigration are related to factors other than the country’s economic situation. Factors such as concerns about safety, ideas about cultural differences, values and emotional reactions can also affect attitudes toward immigration and diversity (Mayda Citation2006).
One might also suggest that xenophobia and ethnocentrism are the results of fear and prejudices about ‘foreign’ people with whom ‘locals’ are not familiar. This means that increased contact with and knowledge about ‘foreign’ people may moderate prejudices and reduce xenophobic attitudes. This may explain why, as the Diversity Barometer shows, those with more experience of people with a foreign background have a more positive attitudes.
Starting from group conflict theory, Perry (Citation2001) maintains that structural and institutional discrimination of minorities, due to ethnicity, religion, race etc., gives rise to individual intolerance among larger proportions of the population, which in turn leads to consolidation of power imbalances and discriminatory power relations in society.
Some international studies (Bobo Citation1988) show that negative attitudes toward migration and ethnic diversity emanate from feelings of powerlessness. This quite often creates intolerant communities and groups based on perceptions that one is being excluded, marginalized and neglected – in other words, a victim in society. During periods of economic stagnation and crisis, vulnerable groups often come into conflict with each other (Bobo Citation1988).
There is, thus, a risk that ‘segregated integration’ will strengthen negative attitudes toward diversity. In addition, the growth of anti-immigrant forces in Sweden and the EU as a whole may strengthen both negative attitudes toward diversity and the ”segregated integration” that currently characterizes the situation in Sweden (Semyonov and Glikman Citation2009; Darvishpour Citation2013).
Of course, the threat need not be real, but prejudices with symbolic or cultural characteristics make it real for those who perceive it. The media and political propaganda contribute to strengthening such prejudices, e.g., xenophobia (Strömbäck, Andersson, and Nedlund Citation2017). According to Frost (Citation2007), it is not always only xenophobic political movements and parties that create anti-migrant discourses, but also the mainstream politics and media through how they portray the problem by, e.g., pointing out migrants as scape-goats, thus influencing vulnerable groups, such as low-skilled workers who are systematically affected by economic and structural fluctuations.
Information selection may also explain some results of studies on actual attitudes toward diversity and on media coverage of the growth of racism and xenophobia in Sweden. Media, authorities, researchers and opinion-makers present a representation of relations that are fraught with conflict. Unfortunately, this focus means that all of the well-functioning relations among people in neighborhoods, schools and workplaces are receiving less media attention. Thus, the picture of public opinion spread by the media does not cover all aspects of multi-cultural relations.
Concerning the effect of the political climate on anti-immigrant attitudes (Bohman Citation2011), we can mention the election results from the EU in 2014 and the parliamentary election in Sweden, which indicate a significant increase in the popularity of anti-immigrant parties (SCB Citation2015).
Concerning the feeling of being threatened by immigrants, the question of recent increased terrorist activity, perpetrated by Islamic fundamentalist groups in and outside Europe, becomes important. This concern the increased negative views primarily about immigrants from the Middle East and Northern Africa. Some research results have confirmed that the terrorist attacks on the WTC in 2001 have had a great negative impact on Europeans’ picture of and attitudes toward Muslims (Larsson Citation2005; Kolankiewics Citation2015). We can see from the 2016 Diversity Barometer results that attitudes toward immigrants from these regions are the most negative. The results also show that 43% of respondents feel that men from the Middle East pose a danger to Swedish culture. It is important to note that the population’s attitudes toward diversity have become most negative with regard to other cultures and religions, particularly Islam. The results also show that almost half of respondents, women as well as men, claim that all religions do not have the same values, pointing out Islam in particular (Ahmadi et al. Citation2015).
In sum, views concerning how immigrants affect the Swedish culture and how well they (especially Muslim immigrants) can adapt to Swedish society have become more negative during recent years. Some studies (Kolankiewics Citation2015) witness this change.
In a broader contextual perspective, it is also interesting to study whether the recent years’ political debates in Europe on the ‘death of multiculturalism’ due to its intrinsic contradictions have influenced the general public’s opinions. Many see multiculturalism as the main obstacle to people with a foreign background becoming integrated into the national community. Another question to consider is whether people’s increased skepticism concerning cultural diversity is related to the rise in segregation in Sweden. Some studies have focused on how the challenges that multiculturalism is facing have negatively influenced attitudes (Vertovec Citation2010). The results of the 2016 Diversity Barometer show that that negative attitudes toward ethnic and cultural diversity have increased.
Another explanation the increase in negative attitudes toward migrants can be found in an interesting hypothesis, put forward by Rydgren (Citation2017). Rydgren suggests that the transformation from an industrial to a post-industrial economy and the development of neoliberal policies can help to explain why negative attitudes toward migration and racist views have recently grown stronger in Europe, including Sweden. According to him, times of crisis strengthen xenophobia. In today’s globalized society, with all its insecurity and fear, people tend to look for security in the old, local culture. Rydgren’s studies show that processes of globalization affect local conditions in various ways. Concerning the situation in Sweden, it is therefore interesting to study how globalization may have affected attitudes toward migration and ethnic diversity.
From a social work perspective, processes of transformation, unemployment, insecurity and exclusion are important factors that should be taken into consideration when increasing anti-immigrant attitudes and support for anti-immigration policies are at stake. During the past two decades, the process of neoliberal globalization has had a strong impact on welfare systems in countries across the world as well as in Sweden (Fook Citation2002; Stepney and Popple Citation2008). It is also important to study the possible impact of welfare cutbacks in a country on attitudes toward ethnic diversity and migration. The question is whether economic and cultural threats can explain the complex problem of xenophobia (Hjerm and Nagayoshi Citation2011).
As different international studies (Public Opinion in the European Union Citation2015; Meuleman, Davidov, and Billiet Citation2009) show, Swedes have typically had the most positive attitudes toward immigration in the EU. Here, there is a need for further research to understand what impacts structural transformations at the national as well as global level may have had on the attitude changes observed in Sweden.
Table A. The used scale for correaltion analysis.
Disclosure statement
No potential conflict of interest was reported by the authors.
Additional information
Funding
Notes
1. As several surveys (SOM report 2017: 32) show, the opinion regarding migration and refugees became increasingly positive during the past decades. That trend has been continuing until 2015. In 2016, negative attitudes toward receiving refugees increased drastically; 52% were for receiving fewer refugees. Another 37% were worried about increased numbers of refugees, while 45% were worried about increased xenophobia, which indicates a drastic increase and polarization of opinions (SOM report 2017: 32).
2. A ten-year longitude project on the Diversity Index (MB), was conducted from 2005 to 2014. MB was a nationwide, representative and longitudinal annual survey of the Swedish population’s attitudes to ethnic diversity, based on random sample. The study was finished 2014. Besides the annual reports, a book was published in 2015 containing reports and analysis of the whole project.
Given the new situation Sweden and Europe has been facing during the last years in regard to new waves of asylum seekers, there existed an urgent need for a new series of investigations. We restarted the project in 2016 gain. The study will be conducted in 2018, 2020, 2022 and 2024. This article focuses, mainly, on the results from the 2016 year’s study.
3. SPAR is an abbreviation for the State Personal Address Book, which is a public registering covering all persons registered in Sweden.
4. This means that the sample used in this study is estimated to 13% among adult Swedes and the actual number in the ALL population is 22%. This means that there is a deficit of 8 percentage points in the sample compared to the actual population. This is no surprise, as the questionnaire was a postal questionnaire written in Swedish. The lower number of people with a foreign background in the sample may also be due to the fact that the sample contains only the adult population, the difference between sample and population is therefore probably even less than this, 8 percentage points, difference.
5. There are no significant differences between men and women, different age groups or different levels of education in how often they associate with people from different parts of the world. It does not matter whether this concerns associating with people from Asia, the Middle East, Africa or any other part of the world.
6. We use the following scales for the correlation analysis. .
7. There are significant differences among society groups regarding attitudes toward the question of whether society should create possibilities for immigrants to be able to preserve their culture in Sweden. The society should create opportunities for immigrants to keep their cultural traditions. Women are more positive toward this statement than men are, young people are more positive than older people, and people with a higher education are more positive than people with a lower education. The attitudes are gradually more negative the older people are and the lower education they have.
8. All immigrants who come to Sweden should have the same social rights as the Swedes themselves. The response pattern is the same as for attitudes toward cultural rights. Younger age groups and people with a higher education have more positive attitudes toward this statement. But there is no statistically significance between the attitudes of men and women.
It is good if immigrants keep their native language and teach it to their children. The attitudes toward this positive statement are exactly same as the attitudes toward preserving the native culture. Women are more positive than men, young people are more positive than older people, and people with a higher education are more positive than people with lower education. The different changes are all statistically significant.
Many people with a foreign background only come to Sweden to take advantage of the country’s generous system of entitlements. Attitudes toward this negative statement regarding immigrants are more common among people with a low education and among young people in the age group 18–30 years. All other older age groups have the same attitudes, which means they are not more negative with age after having turned 30. There are no significant differences among men and women.
All people with a foreign background who commit a crime should be forced to leave the country. Low-educated people agree to a larger extent with this negative statement than do people with a higher education. Also, older people are more negative than young people. Women are more negative regarding this issue and seem to have tougher attitudes toward crime among immigrants, but the difference between men and women is not significant.
Native Swedes feel greater responsibility for their work than do people from foreign countries. There is a tendency here: the older people are, the more often they agree with this negative statement, but the differences are not large enough to be significant. Still, regarding this statement, attitudes among men are more negative than attitudes among women, and low-educated people are more negative than high-educated people.
References
- Ahmadi, F., I. Palm, and N. Ahmadi. 2016. Mångfaldsbarometern 2016. Gävle: Gävle University Press.
- Ahmadi, F., O. Mella, I. Palm, and M. Darvishpour. 2015. Mångfaldsbarometern: tio år av attitydmättningar i Sverige (Diversity Barometer: A Decade of Measurement of the Attitudes in Sweden). Gävle: Gävle University Press.
- Allport, G. W. 1954. The Nature of Prejudice. Cambridge, Mass: Addison-Wesley.
- Asztalos Morell, I., and M. Darvishpour. 2018. “The Securitization of Asylum-Seeking in Sweden after 2015 in Light of Experiences of Asylum-Seeking Adolescent Girls with Roots in Afghanistan." In The Migration Crisis? - Criminalization, Security and Survival, edited byD. Siegel and V. Nagy, 363-389. The Hague: Eleven International Publishing.
- Bobo, L. 1988. “Group Conflict, Prejudice and the Paradox of Contemporary Racial Attitudes.” In Eliminating Racism: Profiles in Controversy, edited by P. A. Katz and D. A. Taylor, 85–114. New York: Springer.
- Bohman, A. 2011. “Articulated Antipathies: Political Influence on Anti-Immigrant Attitudes.” International Journal of Comparative Sociology 52 (6): 457–477. doi:10.1177/0020715211428182.
- Darvishpour, M. 2013. “The Welfare State’s ‘Stepchild’: An Intersectional Perspective on Ethnic Relations and Discrimination in Sweden.” In New Tools in Welfare Research, edited by E. Brunnberg and E. Cedersund, 315–348. Århus: NSU Press.
- Fook, J. 2002. Social Work: Critical Theory and Practice. London: Sage.
- Frost, D. 2007. “The ‘Enemy Within’? Asylum, Racial Violence and ‘Race Hate’.” Britain Today TwentyFirst Century Society 2 (3): 227–248. doi:10.1080/17450140701631411.
- Hjerm, M. 2009. “Anti-Immigrant Attitudes and Cross-Municipal Variation in the Proportion of Immigrants.” Acta Sociologica 52: 47–62. doi:10.1177/0001699308100633.
- Hjerm, M., and K. Nagayoshi. 2011. “The Composition of the Minority Population as a Threat. Can Real Economic and Cultural Threats Explain Xenophobia?” International Sociology 26: 815–843. doi:10.1177/0268580910394004.
- Kolankiewics, M. 2015. “Anti-Muslim Violence and the Possibility of Justice.” Ph.D. disertation published by Lund University. -Series Lund Dissertations in Sociology, nr. 109.
- Lancee, B., and S. Pardos-Prado. 2013. “Group Conflict Theory in a Longitudinal Perspective: Analyzing the Dynamic Side of Ethnic Competition.” International Migration Review 47 (1): 106–131. doi:10.1111/imre.12015.
- Larsson, G. 2005. “The Impact of Global Conflicts on Local Contexts: Muslims in Sweden after 9/11 – The Rise of Islamophobia or New Possibilities?” Islam and Christian-Muslim Relations 16 (1): 29–42. doi:10.1080/0959641052000313228.
- Mayda, A. M. 2006. “Who Is against Immigration? A Cross-Country Investigation of Individual Attitudes toward Immigrants.” The Review of Economics and Statistics 88 (3): 510–530. doi:10.1162/rest.88.3.510.
- Meuleman, B., E. Davidov, and J. Billiet. 2009. “Changing Attitudes toward Immigration in Europe, 2002–2007: A Dynamic Group Conflict Theory Approach.” Social Science Research 38 (2): 352–365. doi:10.1016/j.ssresearch.2008.09.006.
- Migrationsverket [Swedish Migration Agency]. 2016. https://www.migrationsverket.se/Om-Migrationsverket/Nyhetsarkiv/Nyhetsarkiv-2016/2016-01-01-Nastan-163-000-manniskor-sokte-asyl-i-Sverige-2015.html
- Perry, B. 2001. In the Name of Hate: Understanding Hate Crime. London & New York: Routledge.
- Public Opinion in the European Union. 2015. “Standard Eurobarometer 83.”European Commission. http://ec.europa.eu/commfrontoffice/publicopinion/archives/eb/eb83/eb83_first_en.pdf
- Quillian, L. 1995. “Prejudice as a Response to Perceived Group Threat: Population Composition and Anti-Immigrant and Racial Prejudice in Europe.” American Sociological Review 60 (4): 586–611. doi:10.2307/2096296.
- Rydgren, J., ed. 2017. The Oxford Handbook of the Radical Right. Oxford: Oxford University.
- SCB. 2015. “Supervalåret 2014 [Super election year 2014].” Demokratistatistisk Rapport 20. http://www.scb.se/Statistik/_Publikationer/ME0106_2014A01S_BR_ME09BR1503.pdf
- Semyonov, M., and A. Glikman. 2009. “Ethnic Residential Segregation, Social Contacts, and Anti- Minority Attitudes in European Societies.” European Sociological Review 25 (6): 693–708. doi:10.1093/esr/jcn075.
- Stepney, P., and K. Popple. 2008. Social Work and the Community: A Critical Context for Practice. New York: Palgrave Macmillan.
- Strömbäck, J., F. Andersson, and E. Nedlund. 2017. Invandring i medierna. Hur Rapporterades Svenska Tidningar Åren 2010-2015? [Immigration in the Media. How Did the Swedish Newspapers Report in 2010-2015?]. Stockholm: Delmi.
- Vertovec, S. 2010. “Towards Post-Multiculturalism? Changing Communities, Conditions and Contexts of Diversity.” International Social Science Journal 61: 83–95. doi:10.1111/issj.2010.61.issue-199.
- Wigerfelt, B., and A. S. Wigerfelt. 2017. Hatbrott med främlingsfientliga och rasistiska motiv: en kunskapsöversikt. Stockholm: Delegationen för migrationsstudier.