
Abstract
OCCUPATIONAL APPLICATIONS This article describes an observational study at a rail control post to measure workload weak resilience signals. A weak resilience signal indicates a possible degradation of a system's resilience, which is defined as the ability of a complex socio-technical system to cope with unexpected and unforeseen disruptions. A method based upon a weak resilience signal framework introduces a new metric, stretch, to measure the signals. Stretch is a subjective or an objective reaction of the system to an external cluster event and is an operationalization of variables in an earlier stress–strain model. The stretch ratio between the subjective and objective stretch are used to identify workload weak resilience signals. Weak resilience signals identified during real-time operation revealed obstacles that influence the resilience state and enabled actions to anticipate and mitigate changes to maintain the resilience of the system.
TECHNICAL ABSTRACT Background: Continuous performance improvement of a complex socio-technical system may result in a reduced ability to cope with unexpected and unforeseen disruptions. As with technical and biological systems, these socio-technical systems may become “robust, yet fragile.” Resilience engineering examines the ability of a socio-technical system to reorganize and adapt to the unexpected and unforeseen. However, the resilience doctrine is not yet sufficiently well developed for designing and achieving those goals, and metrics are needed to identify resilience change. Purpose: A new approach was explored to identify changes in the resilience of a rail system around the workload boundary to anticipate those changes during normal operations and hence improve the ability to cope with unexpected and unforeseen disruptions. Methods: A weak resilience signal framework was developed with a resilience-state model for a railway system, resulting in a generic, quantifiable, weak resilience signal model. Two workload measurements (i.e., external cognitive task load and integrated workload scale) were combined into a new metric called stretch. Heart rate variability was used for correlation and validation. An observational study was used to measure workload weak resilience signal through workload quantification at an operational rail control post. Results: A theoretical resilience-state model for a railway system was developed and used to generate a generic quantifiable weak resilience signal model, forming a weak resilience signal framework that is the basis for a method to measure workload weak resilience signal through a new metric called stretch with three variations: objective stretch, subjective stretch, and stretch ratio. A component of the subjective stretch is the integrated workload scale, for which a real-time tool was developed for measuring and monitoring. Workload weak resilience signals identified at a rail control post triggered analysis to reveal anticipated obstacles. Conclusions: A resilience-state model of a rail system can be used to quantify workload weak resilience signals. Stretch ratio differences represent changes of the workload state used to measure workload weak resilience signals that aid in revealing obstacles jeopardizing the resilience state.
INTRODUCTION
The continuous performance improvement of a complex socio-technical system may necessarily result in a more limited ability to cope with unexpected and unforeseen disruptions. Just as found with technical and biological systems, these socio-technical systems may become “robust, yet fragile” (Alderson & Doyle, Citation2010, p. 839). Resilience engineering investigates, among other aspects, the ability of a socio-technical system to reorganize and adapt to the unexpected and unforeseen (Hollnagel et al., Citation2006). However, the resilience doctrine is not yet sufficiently well developed for designing and achieving these goals (Madni & Jackson, Citation2009). An important step to account for the resilience of a system is information on its resilience state. The resilience state has been described through theoretical models but so far lacks solid quantification. Woods and coworkers (2009) described some of these models and compared them with each other. The ball and cup model (Scheffer et al., Citation1993), for example, is aimed at the system steady state that presents boundaries after which another steady state or system breakdown occurs. However, this model does not have the ability to explain potential adaptations that may occur around the boundaries.
In another approach, the stress–strain (S-S) model (Woods & Wreathall, Citation2006) takes its analogy from materials sciences by mapping the external demand onto the material's stress and the system behavior onto the material's strain. The S-S model focuses on behavior near the boundaries explaining system degradation, system restructuring, and system transitions, which are potentials that need to be managed during challenging stress events. Woods et al. (2014) extended the S-S model further to operationalize four cornerstones postulated to be essential to resilience: anticipating, monitoring, responding, and learning (Hollnagel, Citation2009) and introduced regions for base and extra adaptive capacity. The region for base capacity represents the “normal” functioning of the system to external events. The region for extra adaptive capacity represents the potential for adaptive shortfalls to arise where responses cannot match the demands of challenging events that fall near or beyond the boundary area of the base envelope. These regions explain the behavior of the system beyond the base envelope; however, they do not provide a means to measure the properties in the extra adaptive region. Furthermore, the behavior in the extra adaptive region is a hidden capacity to react to unforeseen disturbances. An objective of this article was thus to develop a method to measure properties in the base capacity region that signal changes of properties in the extra adaptive region. This objective makes quantification possible and provides clues that can be analyzed and interpreted by human operators about aspects of the hidden capacity.
The concept of weak resilience signal (WRS) is introduced, which is used to quantify changes of the resilience state. WRS is defined as signals indicating a possible degradation of the socio-technical system's resilience that can be traced to its original cause. A WRS with a strong resilience signal is contrasted, the latter being a clear signal that the resilience of the system has degraded and which should be considered as an alarm triggering a relevant action. This comparison also emphasizes that a WRS is not an alarm but rather a trigger of interesting information about the system state. A weak signal in this context can be seen as analogous to a human feeling some chest pains during daily activities. When investigating this signal, he/she may conclude that this is just a spasm or a serious problem with the heart that would only be evident at the time of a large effort.
A weak signal measuring a minor issue during nominal operation may be a crucial factor of failure. Dekker (Citation2011) went even further, theorizing that the accumulation of an unnoticed set of events is the main cause of the incubation of and surprise at failure. The weak signal can also be explained through the S-S model (CitationWoods et al., 2014), in which changes occur in the base adaptive capacity, such as a change in Young's modulus slope (Woods & Wreathall, Citation2006), the linear relation between stress and strain. A slope change in the base region indicates a creeping failure to be exposed at a large stress. Only collecting many detailed weak signals would not necessarily result in a corrective action in response to a specific signal; it may cause fatigue or vigilance (Davis & Parasuraman, Citation1982), and due to many irrelevant weak signals that do not need any action, it could cause a “cry wolf” (Breznitz, Citation1984) effect. Therefore, the WRS needs an extra set of properties to account for the this. First, it needs to be an aggregation of a lower/detailed weak signal set to lower the number of signals, and second, the aggregation needs to be of interest to the operators to understand the behavior of the system beyond resilience. These are “sending” properties of the WRS. Yet, a “receiving” property of the rail sector is also needed to expand its culture from “working by virtue of many rules and formal agreements” (Van den Top & Steenhuisen, 2009, p. 149) to an inquisitive one of understanding, tracking, and anticipating relevant WRSs.
This article focuses on a framework for rail WRS modeling, and one main area—workload—is emphasized for which a specific method is developed to measure a workload WRS at a rail control post. This method is verified and validated in real operations through an observational study during a reorganization of a rail control post. The research questions were twofold: (1) How can a WRS be modeled to enable its quantification and be demonstrated in the area of workload in real operations? (2) How can workload WRS be measured and utilized at a rail control post?
The remainder of this article is structured as follows. In the next section, a framework is developed for rail WRS modeling and its generic quantification is mathematically described. The following section describes a method to measure workload WRS at a rail control post. After that, a section describes the observational study carried out during two separate weeks at the rail control post. The article is concluded with the results of the observational study and a discussion in the final two sections.
FRAMEWORK FOR RAIL WRS MODELING
Theoretical Resilience-State Model for Railway System
A theoretical model describing the resilience state of a railway system is needed (1) to better understand in which areas WRSs are to be sought and (2) to provide a foundation upon which a quantitative model of a WRS can be built. Rasmussen's (1997) safe operating envelope was used as a starting point since it uses three boundaries—performance, economy, and workload—to describe the envelope of a generic socio-technical system operating in an economic environment. That model described the various pressures on the operating state (OS) that may result in crossing one of the borders or readjusting the border to create a new steady state. This readjustment is actually resilience, which is defined by the capacity to adapt to unforeseen events (Hollnagel et al., Citation2006). In Rasmussen's framework, the performance boundary is directly linked to safety culture pressure, the economic boundary is linked to efficiency pressure, and the workload boundary is linked to least effort pressure. In the proposed adaptation of Rasmussen's model, some changes were introduced to reflect the nature of a railway system. First, performance was separated from safety to reflect their independent nature, while their mutual influence on the OS is made explicit in the new model by upgrading safety to a boundary entity, which creates safety pressure. Second, the economic boundary was moved backward, thereby creating efficiency pressure on the performance boundary, which in turn creates a performance pressure. This change is justified by the fact that in rail systems, economic considerations play a more prominent role in the long run than in daily decisions. However, the performance pressure, created by capacity growth and punctuality to deliver the planned schedule, plays a major role in daily considerations. The workload boundary stays intact, reflecting the human importance within a socio-technical rail system, and the result of these changes is shown in (Section I).
FIGURE 1 Resilience-state model for a railway system. Section I: rail sector boundaries putting pressure on the OS. Section II: Rail sector boundaries with resilience slope αP causing pressure dP. Section III: OS move caused by internal change, a or b, influencing system resilience.
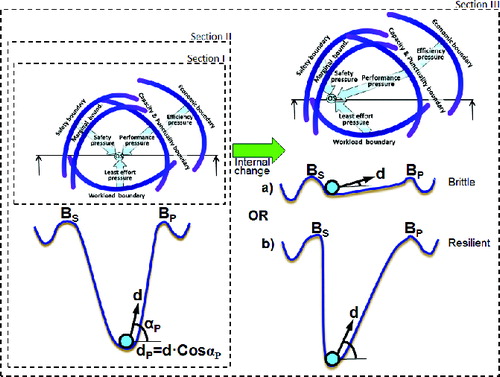
The above model is considered useful when reasoning about resilience. For example, Cook and Rasmussen (Citation2005) used different areas in the model to explain the stability of a system: unstable, low-risk stable, and high-risk stable. The fact that the boundaries put pressure on the OS is indicated textually with the term “gradient,” and gray areas show the OS jump domain that is due to shallow gradients. These gradients are of interest since they represent the internal pressure on the OS and may be indirectly measured and can help explain the resilience of the system when the OS is located at any position between the boundaries. When a gradient is steep, it represents system resilience against external perturbations, while shallowness represents brittleness. As described by Woods et al. (Citation2009), who related the work of Walker and Holling (Citation2004) to that of Rasmussen (Citation1997), this gradient can be made explicit by adding a depth dimension to Rasmussen's model as if it were viewed from above in a landscape of valleys. The slope (α) of the valley (see , Section II) describes the internal force gradient (or resilience engineering, as in Walking & Holling, 2004) acting on the OS. Vector describes the external perturbations acting on the OS, while dP = d·CosαP represents the pressure of boundary BP. This third dimension with the valley slope is important to understand the level of resilience when moving toward one of the boundaries. A shallow slope is analogous to a small hurdle, representing brittleness, to approach the boundary, while a steep slope represents resilience. As an example, (Section III) shows an OS that is moving toward the marginal boundary, a boundary to guard the safety boundary. There are two options to reflect the change of the internal state. When only the capacity of the system is increased and no safety measures are taken, this will result in a brittle state, option a, in which the marginal boundary risks being crossed. However, when measures are taken to also enlarge the safety hurdle, as in option b, it may result in a deeper valley, thereby maintaining the resilience engineered to cope with a higher capacity. This theoretical model will be used in the following subsection to model quantifiable WRSs through pressure change acting on the OS near the boundaries.
Generic Quantifiable WRS Model
Assuming an internal pressure αB on boundary B, caused by a certain phenomenon described through a function fB of n measurable parameters, PiB, can be expressed mathematically as(1) When assuming small changes, pressure change ΔαB can be estimated by the cumulative weighted changes of the function parameters PiB:
(2) or as the change of two moments in time t1 and t2:
(3) A WRS (WRSB) is created when it is smaller than threshold_WRSB, which is a negative value, since, by definition, a larger αB represents a growing resilience (as in ):
(4) where weights KiB (i = 1, … , n) and threshold_WRSB are defined by empirical investigation in which KiB is used to set the relative proportion of influence among the parameters on pressure αB and may be set initially to 1. threshold_WRSB is a way to search for a level at which attention is needed for deeper analysis. A possibility to define threshold_WRSB is the added standard deviation (SD) of the measurements at t1 and t2 to make the difference significant, or it may be set to a value reducing the occurrences of WRSB to those that are most significant. It may be possible that instead of a hard threshold, a graphical representation, such as a continuous graph, will be chosen for monitoring by the rail controller. However, the crux of this model is choosing the phenomenon that is described by fB. As explained in the Introduction, this phenomenon needs to cover many possible WRSs and must be chosen in such a way that it is of interest to the controllers independently of the signals occurring. The following section gives an example of such a phenomenon worked out with respect to the workload boundary. It is assumed that passing the workload boundary with a certain threshold implies a possible degradation of the system resilience. This is in line with Woods and Patterson (Citation2000), who claimed that unexpected events produce an escalation of cognitive demands. When cognitive workload change is significant and identified, it is a signal that the resilience of the system is reduced due to the reduction of the spare cognitive capacity, which may be needed when the unexpected event occurs. There are two period types of passing the boundary. A short period passage is a real-time signal for operations to respond to by an intervention. Passages in a long period indicate a possible structural change to be addressed. With an empirical study, the usage of parameter settings will be shown and the model validated with the results through observation.
METHOD TO MEASURE WORKLOAD WRS AT A RAIL CONTROL POST
Workload measurement methods have been studied extensively (Veltman & Gaillard, Citation1993; Pickup et al., 2005a; Pretorius & Cilliers, Citation2007; Gao et al., Citation2013). Different factors influence mental workload, such as time, mental tasks, physical tasks, and stress (Xie & Salvendy, Citation2000), which makes it clear that one measurement type will not cover all aspects. Veltman and Gaillard (Citation1996) reasoned that the measurement of mental workload needs performance, subjective, and physiological data for a complete understanding of workload. Using three different measurements is suggested: (1) external cognitive task load (XTL), (2) subjective workload, and (3) heart rate variability (HRV) to identify arousal created by workload.
To compose the XTL, Neerincx's (2003) model of cognitive task load (CTL) was expanded in three dimensions: task complexity, task duration, and task switching. The XTL is defined specifically to the rail control situation and to parameters that are available in real time. The real-time aspect, of all the measurement components, provides possibilities to set up experiments to close the loop throughout operations. Rail signalers’ task execution can be divided into four main activities (see ), which are measurable within the system: (1) monitoring (Mon), (2) plan mutations (Plan), (3) manual actions (Man), and (4) communication (Com). Monitoring is keeping track of trains and infrastructure through observation of system displays. Plan mutations refer to activities concerning the logistic plan, which is the basis of train movements on the infrastructure as agreed among all parties and used by system automation. Manual actions are activities performed directly on the infrastructure, like setting a switch instead of system automation according to the plan. Telephone calls with external parties are the main communication task. It was assumed that monitoring is in proportion with automated activities executed by the system. This assumption refers to imposed task load, while in reality, the rail controller can actually ignore the monitoring task. Monitoring can thus be measured by counting all automated activities. These activities were counted in 5-minute base slots, used throughout all types of measurement for ease of comparison. These counts were normalized by dividing them by the maximum count (Monmax) occurring throughout a test period, causing the measurement to be normalized between 0 and 1. This same idea was applied to normalizing the plan mutations and the manual actions. Each of these were counted within the 5-minute base slot and divided by the maximum count, Planmax and Manmax, respectively, throughout a test period. The communication normalization was done differently. Communication was defined by the percentage of verbal exchanges over the phone, which is measureable, during the 5-minute base slot. A rail signaler talking the whole 5 minutes results in a 100% communication value.
FIGURE 2 Task flow of a rail signaler at his/her workstation.
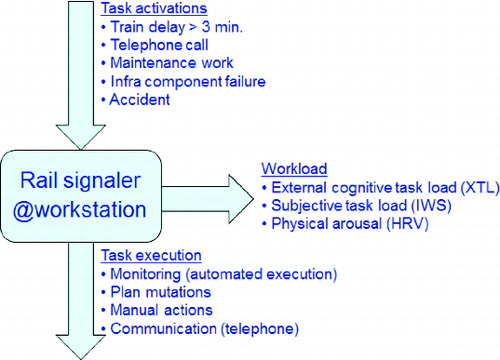
The combination of these four normalized activities refers to task complexity as stated by Neerincx (Citation2003). However, Neerincx used the skill-rule-knowledge (SRK) model (Rasmussen, Citation1997) to express task complexity by rating each task on its SRK cognition load level. Since the cognitive relationship among the tasks is not known, each was multiplied with their relative task complexity constant (Kmon, Kplan, Kman, and Kcom) and their identity tracked throughout the whole process. In addition to these activities, task switching and task duration are two extra dimensions amplifying the workload. To estimate the number of task switches, the task activations were examined and counted in each time slot as long as they were activated to reflect task duration. lists the task activations imposed on a particular workstation. These activations resulted in the activities discussed above and resulted in workload measured by XTL, integrated workload scale (IWS), and HRV.
Since the analysis is based upon log-data, a search can be performed for the maximum number of activations occurring in the 5-minute base slots. The number of activations occurring in the 5-minute base slot were divided by the maximum activations occurring throughout the test period to achieve a normalized switching factor between 0 and 1. Task switching and duration are a cognitive add-on to the activity load. With the same activity load, 0 to n parallel task switches can occur, behaving like a cognitive amplifier to the activity load. One was added to the normalized switching factor to act as a cognitive amplifier by becoming a growth multiplier of the activity load. Graphically, the multiplication will show jumps, attracting the attention needed for interpretation; the switching factor thus becomes(5) The task complexity load was calculated with the sum of the four normalized tasks, each multiplied with their relative task complexity constants: Kmon, Kplan, Kman, and Kcom. These constants are initially set to 1 and may be adjusted proportionally during empirical investigation but keeping their sum to the initial value of 4 and only changing their interrelationship. The task switching factor was multiplied with the task complexity load to achieve a combined XTL number. This approach creates a number between 0 and 8 to be used as an overall graphical indication on the XTL magnitude and change. Maximum load due to task execution is 4 × 1 = 4, multiplied by a maximum switching factor 2 × 4 = 8. However, it is important to present all the components and their relationships separately to understand the situation.
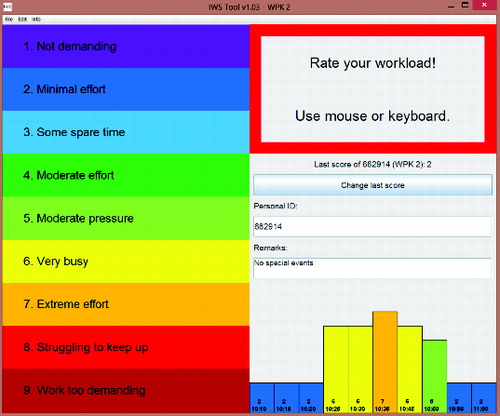
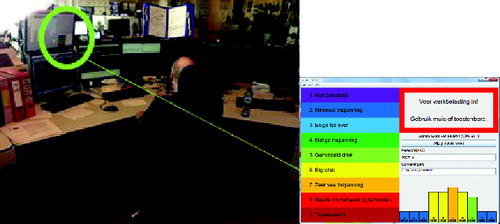
The XTL calculations can be performed for workstation WS with its subscripted WS values using(6) Subjective load measurement can be divided into two categories: multidimensional and unidimensional scales. Multidimensional scales, such as the NASA-TLX (Hart & Staveland, Citation1988), explicitly represent the dimensions of workload and allow ratings to be obtained from each dimension. Unidimensional scales (Muckler & Seven, Citation1992) represent the concept of workload as one continuum. Hendy and colleagues (1993) claimed that a univariate rating is expected to provide a measure that is at least as sensitive to manipulations of task demand as a derived estimate from multivariate data. In addition, a unidimensional scale is easier to use and, in the present case, easier to automate for real-time purposes. Pickup and coworkers (2005b) developed a unidimensional scale specifically for rail signalers, called the IWS. They automated the IWS tool for usage of the trial facilitator for a few-hour period. The aim of the present study was to let the rail signaler assess and enter their own rating for 24 hours each day. A Java tool was developed that can run within the operational system to be seen as part of their routine work. Rail signaler RSi working at work station WSj was alerted every 5 minutes by a peripheral blinking rectangle to rate their subjective workload. They were presented with a 9-scale figure containing the following text (from the original Dutch; see ): (1) not demanding, (2) minimal effort, (3) some spare time, (4) moderate effort, (5) moderate pressure, (6) very busy, (7) extreme effort, (8) struggling to keep up, and (9) work too demanding. The rail signaler had the option to add a comment to their rating and received a graphic overview of their scoring.
FIGURE 3 IWS application screenshot translated from Dutch (upper right red rectangle blinked to draw attention).
The extensively researched HRV was used to identify physiological arousal due to workload change (Jorna, Citation1992; Malik, Citation1996; Goedhart et al., Citation2007; Togo & Takahashi, Citation2009; Billman, Citation2011; Hoover et al., Citation2012). The HRV was mainly used to cross-check the subjective measurement and will be lower at a higher workload and identify IWS ratings that are given due to other reasons than a higher workload. HRV was measured with a commercial device (Zephyr HxM BT; Zephyr, Annapolis, MD) that was positioned on a chest strap and transferred data to a laptop near each workstation. A signaler wore the device at the start of their work. The device sends continuous strings with recorded electrocardiographic R wave to R wave (R-R) intervals in msec. HRV can be calculated in various ways, roughly divided into time-domain and frequency-domain methods (Malik, Citation1996). The most common occupational health method was used (Togo & Takahashi, Citation2009), SDNN, the SD of all normal-to-normal (NN) intervals from the time domain. The measures in the same 5-minute base slot used for the calculations of XTL and IWS were calculated.
The three measurements described above, XTL, IWS, and HRV, are all measured in 5-minute slots. This timeslot enables comparison of the measurements in a timeline, as Pickup et al. (2005b) did to validate IWS. This was done for validation of IWS through HRV, but it is not sufficient for the analysis of events taking much longer than 5 minutes, which is the case in the rail environment. Serious events take more than half an hour, as can be seen in the Results section. To compare the XTL and IWS, they should be referenced to a timeframe of events, clustered from and to a steady state. The steady state of a rail control post is the state when the train activities are occurring as planned, without any intervention. To relate the IWS and XTL measurements, a new metric was introduced—stretch (see ).
FIGURE 4 Defining objective and subjective stretch from XTL and IWS over time.
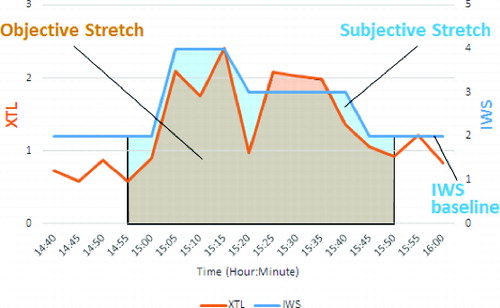
A stretch is the cumulative workload effort during a period initially defined by IWS rising from a baseline until it returns to the baseline. The IWS baseline is defined as the steady-state IWS rating before and after a disruption. However, the activity in the system may have started earlier and ended later. Therefore, the starting moment of a stretch is adjusted to the first XTL minimum moment before the IWS rising. Similarly, the ending moment of a stretch is adjusted to the first XTL minimum moment after the IWS return. In other words, a stretch is the reaction to an external cluster event. The term cluster event is used since more than one event may occur during a stretch. An objective stretch is the name of the area under XTL, since it is objectively measured. The area under IWS is called a subjective stretch, due to its subjective IWS rating. The ratio of subjective stretch and objective stretch is called stretch ratio, which is used to identify a workload WRS. These terms are better related, than the measurements, to the S-S model (CitationWoods et al., 2014; Woods & Wreathall, Citation2006) and the resilience-state model, developed in the previous section. The objective stretch is related to the stress axis of the S-S model. Stress is the theoretical concept of the demand of the system through challenge events. The objective stretch is the operationalization of the stress concept through measuring the factual reaction of the system. The subjective stretch is the human perception of the system strain. The stretch ratio relates to αB of the workload boundary (αworkload-boundary), the internal pressure on the workload boundary of the resilience-state model. When a growing change of the stretch ratio is identified, larger than a threshold, and the stretch values are larger than a pre-defined value, a WRS is generated. When comparing two periods, the accumulated SD of the stretch ratio in each period can function as the threshold, indicating a significant change. However, such a principle needs to be validated in empirical testing. A larger stretch ratio during a given period, compared to a baseline period, indicates a more subjective workload in response to similar external events. The objective stretch is used to identify an absolute workload growth throughout a specific period, such as a day or workweek.
OBSERVATIONAL STUDY DURING RAIL OPERATIONS
To validate and verify the applicability of the method to measure workload WRS at a rail control post, it was applied throughout the restructuring tryout of a control post to improve its work efficiency. In this specific case, the control post was restructuring only one group around a corridor for a test period of half a year by (1) setting focus on a corridor by seating the corridor team together, (2) splitting up the responsibility of a rail controller's tasks to planning- and safety-related activities by adding a planner to the team, (3) enforcing standardization through position rotation, and (4) growing their expertise level through training as part of the position rotation. This efficiency step can, however, affect the post's spare, and sometimes hidden, adaptive capacity needed when an unexpected disruption occurs. In addition, this efficiency step can also affect the organization's ability to manage this capacity. As improved work efficiency may conflict with an organization's resilience due to common resource demands, methods are needed to identify this potential conflict, which can be shown by a WRS. A rail control post is responsible for a large area containing railway stations, controlled by rail signalers managing the traffic on the rail infrastructure. The post studied here is active 24 hours a day, 7 days a week with 10 to 20 rail professionals. A rail control post is an example of a socio-technical system due to the critical human-system interaction.
The generic setting is a rail control post with mPost workstations and nPost rail signalers evaluating a new organizational form to increase their performance. Each workstation WSj is allocated to a set of railway stations and operated by one rail signaler, RSi, who is responsible for all workstation aspects. These aspects are roughly divided into logistics and safety, and the workstations are split into two groups. The first group, GT, is the target group that will reorganize, as described above, to improve its performance. The second group, GR, is the reference group that will not reorganize throughout the testing period. All nPost rail signalers of the control post may be allocated to each of the groups and to each of its workstations. In group GT there are mT workstations, and in group GR, there are mR workstations. In addition, there is a calamity workstation WScal, which is added to give support to the workstation being at the core of a calamity. The calamity workstation, which is not related to the reorganization, can be added to each group, GT or GR; the setting is depicted in .
FIGURE 5 Rail control post setting with observer O.
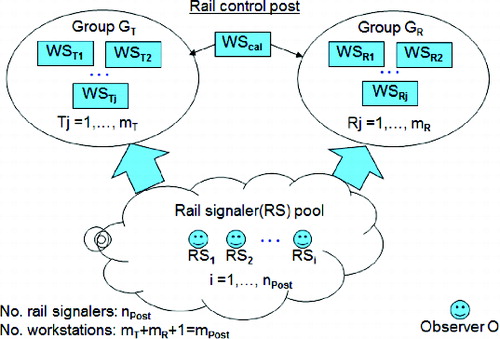
In the present case, structured observations were carried out at a Dutch rail post with 44 participating rail signalers (nPost = 44) during two periods of one working week (Monday until Friday). The age of the participants ranged between 23 and 64 years, with a mean of 43.6 years, and the population contained 79.5% males. All of them rated their subjective workload with the IWS tool, though 39% consented to wearing a heart rate sensor during their work. The work experience varied between 0 and 37 years, with a mean of 17.6. The first measurement period was immediately before the reorganization of the target group, and the second measurement period was 2 months afterward. In the first period, measurements were recorded in two shifts from 7:00 AM until 9:00 PM with the IWS tool on a separate laptop near each workstation. During the second period, the measurements were recorded continuously, 24 hours a day, with the IWS tool integrated within the operational system (see ). Initially, there were three workstations at the target and reference group (mT = mR = 3). After reorganization, one workstation was added to the target group (mT = 4) for planning activities of the corridor. The protocol guiding the observations was approved by the ethical committee of the University of Twente, except for its request to obtain written consent by participants, which was replaced by oral consent by each participant at the request of post management.
FIGURE 6 Integration of IWS tool within operations.
RESULTS
The quantitative results of the stretch measurements before and during the reorganization are summarized in . Before reorganization, the mean stretch ratio of the target group was 5.30 [IWS/XTL] with an SD of 2.61. The mean stretch ratio of the reference group was 5.82 [IWS/XTL] with an SD of 2.55. Since the SDs were large, and the means were similar, it can be concluded that the stretch ratio of both groups were in the same order of magnitude, indicating the similarity of work in both groups. The duration of the stretch varied substantially; this can be seen clearly by comparing the stretch with the stretch divided by its duration (, subjective stretch/Dt and objective stretch/Dt), the latter representing the mean workload throughout the stretch. For example, the subjective stretch of both groups before the reorganization was 21.13 [IWS × min] with an SD of 15.60, whereas subjective stretch divided by its duration was 3.09 [IWS] with an SD of 0.80.
TABLE 1 Stretch measurements over one week, both before and during reorganization (cells that are not relevant for the line of argumentation are not filled in)
During the reorganization, a planner was added to the target group. The mean stretch ratio of the planner was 11.83 [IWS/XTL] with an SD of 5.54. The reason the planner had a much larger stretch ratio than the normal rail signaler is because their XTL was much lower since that individual does less work. The planner had no monitoring task, no manual action task, and fewer phone calls since they do not communicate with the train drivers. In contrast, the planner rated IWS similarly to colleagues, causing the stretch ratio to become larger. This could be solved by adjusting the relative task complexity constants, which were initially set to 1, and giving more relative weight to plan activities. However, more empirical research is needed in this area, causing the existing stretch ratio to be valuable for comparison of similar tasks but not yet suitable to compare between different tasks. For that reason, entries have been added to the summary table where the planner is excluded (, target excl. planner and all excl. planner). The mean stretch ratio of the target group during the reorganization without the planner was 6.17 [IWS/XTL] with an SD of 2.81. The mean stretch ratio of the reference group during the reorganization was 6.36 [IWS/XTL] with an SD of 1.80. The stretch ratio for both groups remained similar but increased in the measurement week during the reorganization. The reason for the increase can be found in the figures of the objective stretch, which are lower during the reorganization than before. Deeper investigation shows that fewer phone calls are the cause for the objective stretch reduction. In summary, in the measurement week during the reorganization, no evidence was found that the reorganization significantly influenced the workload adaptive capacity needed for system resilience.
Another representation of the measurement results is a plot of the objective stretch versus subjective stretch before and during reorganization (). The two stretch types are highly correlated, with r (Pearson) = 0.90 before reorganization and 0.88 during reorganization. Most stretches in both weeks are small. A threshold line has been drawn with a stretch ratio of 9 [IWS/XTL], since the mean stretch ratio in the first week was 5.69 [IWS/XTL] with an SD of 2.57 (). A first threshold line would be the rounded sum of the means with 1 SD above (i.e., 6 + 3). It is the threshold, as explained in the previous section, that needs to be set empirically to optimize the number of WRSs to handle. With this threshold, two WRSs during the reorganization need further investigation (WRS-1 and WRS-2, labeled “1” and “2” in ).
FIGURE 7 Objective versus subjective stretch in 1 week, both before (left) and during (right) reorganization.
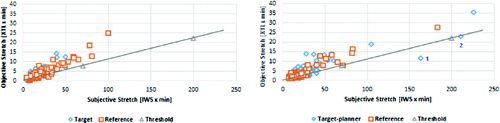
WRS-1 has a stretch ratio of 14.11 [IWS/XTL] with a subjective stretch of 163 [IWS × min] and an objective stretch of 11.55 [XTL × min], which are numbers for comparison of stretches in the given setting. The WRS occurred on the first measurement day at workstation 3 at 7:10 AM and had a 195-minute duration of while performing shunting of rail material as the main activity. The rail controller subjectively rated the mean workload during this stretch as “moderate effort” (4.17), which is higher than the mean IWS rating (“some spare time” = 2.75) of the whole group during the test week. The higher IWS rating, combined with the long duration of shunting activities, triggers further investigation or at least causes the tracking of the shunting for a longer period to understand the phenomena and take appropriate actions. This is an example of a WRS causing the identification of an obstacle, which could become a main cause of incubation and surprise at failure, as stated by Dekker (Citation2011).
WRS-2 has a stretch ratio of 9.16 [IWS/XTL] with a subjective stretch of 211 [IWS × min] and an objective stretch of 23.03 [XTL × min]. The WRS occurred on the second measurement day at workstation 3 at 8:40 AM and had a 350-minutes duration, again while performing mainly shunting of rail material. The rail controller subjectively rated mean workload during this stretch as “some spare time” (3.01). Although the mean IWS rating was lower than that of WRS-1, the duration was much longer. This recurring shunting activity emphasizes the importance of investigating the reasoning for the long periods. Such an investigation is an example of actions taken as a result of a WRS.
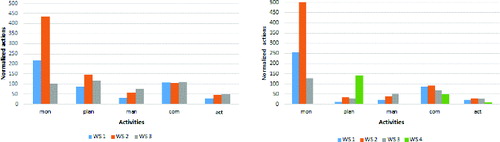
The above results and reasoning give some confidence in the validity of the data, since they correlate with the observations in both weeks. In both weeks, no special events occurred, and both groups were able to cope with daily disturbances. The shunting issues of the WRSs were recorded as well and were caused by the three train companies that had extensive unplanned rail material to be treated manually by the rail signalers. The reorganization did not have a visible effect on the average disturbances. To further validate the data, the work distribution was analyzed based upon the XTL components, and it was verified as well with the observations. shows the work distribution of the target group before and during reorganization. It is clear from the graphs that the extra workstation (workstation 4) does most of the planning, communicates less than the other workstations, and does not perform manual or monitoring activities. These figures are consistent with the observations, where all planning activities that were more than 10 minutes ahead were allocated to workstation 4.
FIGURE 8 Work distribution of target group before (left) and during (right) reorganization (mon = monitoring, plan = plan mutation, man = manual action, com = communication, act = activations).
In addition, HRV was correlated to the objective stretch. The following algorithm has been applied to identify a lowering HRV during a stretch. First, the highest value of the HRV on the boundaries of its stretch was marked. Then this value was multiplied by the stretch duration, and the integral under the HRV throughout the stretch was subtracted. A negative value was assumed to confirm the subjective stretch by the physiological response. This algorithm was applied to the data available in the week before the reorganization. A lower HRV was recorded during 83% of the subjective stretches, which is in line with the literature (Togo & Takahashi, Citation2009). This finding provides an additional means to evaluate stretches passing the threshold boundaries.
DISCUSSION
There is a need during real-time operations to quantify the system resilience state. Quantification is challenging, because on the one hand, socio-technical systems are complex and non-linear (Doyle & Csete, Citation2011), while on the other hand, resilience is about hidden capacity that is measured only during the response to such disruptions (Woods et al., 2014). Woods et al. (2014) made some progress in the quantification of resilience parameters by looking at the system boundaries. This article focused on the area of daily operations, seeking quantifiable WRSs around the workload. The aim of this research was to show how a WRS can be modeled, to enable its quantification, and to demonstrate this in the area of workload in real-time train operations. In addition, a goal was to determine whether, and how, workload WRS can be measured at a rail control post and to demonstrate how it can be utilized.
A WRS framework was developed and used to concretize a workload WRS at a rail control post, specifically for the work of a rail signaler. The modeling was built from specific types of workload measurements adjusted to the rail context, resulting in three measurements: (1) XTL, (2) IWS, and (3) HRV. The first two measurement results were merged into a new metric, stretch, describing the efforts during clusters of events occurring at the control post. HRV measurement was used for validation. The two variations, objective and subjective stretch, are an operationalization of S-S model variables (Woods & Wreathall, Citation2006; Woods et al., 2014). An objective stretch is related to the stress on the system, and a subjective stretch is the human response perception related to strain. Stretch ratio is the relation between both stretches and relates to the slope of the S-S line. Stretch seemed to describe well the variations of the same task set. However, more research is needed to tune the multiplying constants of the sub-tasks, initially being set to 1 here, to compare with other task sets. For comparison of the groups, the planner has been excluded, which had a consistently larger stretch ratio than the others.
Overall, the stretch gave a clear picture of the events occurring at the control post and created two workload WRSs. These were analyzed and triggered further analysis of the shunting activities engaged in at workstation 3, which is a concrete example of anticipation driven by a WRS. Beyond this finding, there was no indication of a resilience reduction caused by the reorganization. A longer period with significant disruptions is needed to understand the impact of reorganization on the workload resilience border and resilience as a whole. This longer testing period can also contribute to validation of the workload WRS, since more WRSs will occur that can be analyzed and reveal other obstacles influencing the resilience state. In the current testing, components of the stretch have been validated against observations.
In summary, the stretch, which is based upon the WRS theoretical and quantification model, offers the ability to quantify a workload WRS. Such WRSs provide new means to measure the (sometimes creeping) resilience changes. When analyzed during operations, it creates awareness of obstacles that can become a (main) cause of incubation and surprise at failure. This awareness stimulates the anticipation to take actions in the period before the unexpected and unforeseen external event occurs. In such a way, the hidden extra adaptive capacity is maintained and can be utilized through the ability of managing this capacity. This will improve the performance of the controllers. A future research step is to measure for longer periods and extend the specific WRS modeling to the other two boundaries, safety and capacity. WRS coverage, the identified percentage of obstacles compromising the resilience state, will be investigated as well. The aim is eventually to test and validate the contribution of the total WRS concept to managing the resilience of the socio-technical rail system.
CONFLICT OF INTEREST
The authors declare no conflict of interest.
ACKNOWLEDGMENTS
The authors are grateful for the hospitality of the ProRail control post at Zwolle for the freedom for this research and willingness to use the proposed experimental tooling. Thanks are extended to Jaldert van der Werf for his development of the IWS and analysis software tooling and his contribution to the observational study. The guidance by Alfons Schaafsma is greatly appreciated.
FUNDING
This research was conducted within the RAILROAD project and is supported by ProRail and the Netherlands organization for scientific research (NWO; grant 438-12-306).
REFERENCES
- Alderson, D. L., & Doyle, J. C. (2010). Contrasting views of complexity and their implications for network-centric infrastructures. IEEE Transactions on Systems, Man, and Cybernetics— Part A: Systems and Humans, 40(4), 839–852. doi: 10.1109/TSMCA.2010.2048027
- Billman, G. E. (2011). Heart rate variability—a historical perspective. Frontiers in Physiology, 2, 86. doi: 10.3389/fphys.2011.00086
- Breznitz, S. (1984). Cry wolf : The psychology of false alarms. Hillsdale NJ: Lawrence Erlbaum Associates.
- Cook, R., & Rasmussen, J. (2005). “Going solid”: A model of system dynamics and consequences for patient safety. Quality & Safety in Health Care, 14(2), 130–134. doi: 10.1136/qshc.2003.009530
- Davis, D. R., & Parasuraman, R. (1982). The psychology of vigilance. New York: Academic Press.
- Dekker, S. (2011). Drift into failure—from hunting broken components to understanding complex systems. Farnham, Surrey, UK: Ashgate Publishing Limited.
- Doyle, J. C., & Csete, M. (2011). Architecture, constraints, and behavior. Journal of the National Academy of Sciences, 108(Suppl. 3), 15624–15630.
- Gao, Q., Wang, Y., Song, F., Li, Z., & Dong, X. (2013). Mental workload measurement for emergency operating procedures in digital nuclear power plants. Ergonomics, 56(7), 1070–1085. doi: 10.1080/00140139.2013.790483
- Goedhart, A. D., van der Sluis, S., Houtveen, J. H., Willemsen, G., & de Geus, E. J. C. (2007). Comparison of time and frequency domain measures of RSA in ambulatory recordings. Psychophysiology, 44(2), 203–215. doi: 10.1111/j.1469-8986.2006.00490.x
- Hart, S. G., & Staveland, L. E. (1988). Development of NASA-TLX (Task Load Index): Results of empirical and theoretical research. Advances in Psychology, 52, 139–183.
- Hendy, K. C., Hamilton, K. M., & Landry, L. N. (1993). Measuring subjective workload: When is one scale better then many? Human Factors, 35(4), 579–601.
- Hollnagel, E. (2009). The four cornerstones of resilience engineering. In C. P. Nemeth, E. Hollnagel, & S. Dekker (Eds.), Resilience engineering perspectives. Volume 2: Preparation and restoration (pp. 117–134). Surrey, UK: Ashgate Publishing Limited.
- Hollnagel, E., Woods, D. D., & Leveson, N. (Eds.). (2006). Resilience engineering: Concepts and percepts. Hampshire, UK: Ashgate Publishing Limited.
- Hoover, A., Singh, A., Fishel-Brown, S., & Muth, E. (2012). Real-time detection of workload changes using heart rate variability. Biomedical Signal Processing and Control, 7(4), 333–341. doi: 10.1016/j.bspc.2011.07.004
- Jorna, P. G. A. M. (1992). Spectral analysis of heart rate and psychological state: A review of its validity as a workload index. Biological Psychology, 34(2), 237–257.
- Madni, A. M., & Jackson, S. (2009). Towards a conceptual framework for resilience engineering. IEEE Systems Journal, 3(2), 181–191. doi: 10.1109/JSYST.2009.2017397
- Malik, M. (1996). Heart rate variability. Annals of Noninvasive Electrocardiology, 1(2), 151–181. doi: 10.1111/j.1542-474X.1996.tb00275.x
- Muckler, F. A., & Seven, S. A. (1992). Selecting performance measures: “Objective” versus “subjective” measurement. Human Factors, 34(4), 441–455.
- Neerincx, M. A. (2003). Cognitive task load analysis: Allocating tasks and designing support. In E. Hollnagel (Ed.), Handbook of cognitive task design (vol. 2003, pp. 283–305). Mahwah, NJ: Lawrence Erlbaum Associates.
- Pickup, L., Wilson, J. R., Nichols, S., & Smith, S. (2005). A conceptual framework of mental workload and the development of a self-supporting integrated workoad scale for railway signallers. In J. Wilson, B. J. Norris, T. Clarke, & A. Mills (Eds.), Rail human factors (pp. 319–329). Surrey, UK: Ashgate.
- Pickup, L., Wilson, J. R., Norris, B. J., Mitchell, L., & Morrisroe, G. (2005). The integrated workload scale (IWS): A new self-report tool to assess railway signaller workload. Applied Ergonomics, 36(6), 681–693. doi: 10.1016/j.apergo.2005.05.004
- Pretorius, A., & Cilliers, P. J. (2007). Development of a mental workload index: A systems approach. Ergonomics, 50(9), 1503–1515. doi: 10.1080/00140130701379055
- Rasmussen, J. (1997). Risk management in a dynamic society: A modelling problem. Safety Science, 27(2/3), 183–213.
- Scheffer, M., Hosper, S. H., Meijer, M. L., Moss, B., & Jeppesen, E. (1993). Alternative equilibria in shallow lakes. Trends in Ecology & Evolution, 8(8), 275–279. doi: 10.1016/0169-5347(93)90254-M
- Togo, F., & Takahashi, M. (2009). Heart rate variability in occupational health—a systematic review. Industrial Health, 47(6), 589–602.
- Van den Top, J., & Steenhuisen, B. (2009). Understanding ambiguously structured rail traffic control practices. International Journal of Technology, Policy and Management, 9(2), 148–161.
- Veltman, J. A., & Gaillard, A. (1993). Indices of mental workload in a complex task environment. Neuropsychobiology, 28, 72–75.
- Veltman, J. A., & Gaillard, A. W. K. (1996). Pilot workload evaluated with subjective and physiological measures. In K. Brookhuis, C. Weikert, J. Moraal, & D. de Waard (Eds.), Human factors and ergonomics society (pp. 107–128). Haren, The Netherlands: University of Groningen.
- Walker, B., Holling, C. S., Carpenter, S. R., & Kinzig, A. (2004). Resilience, adaptability and transformability in social-ecological systems. Ecology and Society, 9(2), 5.
- Woods, D. D., Chan, Y. J., & Wreathall, J. (2014). The stress–strain model of resilience operationalizes the four cornerstones of resilience engineering. In 5th Resilience Engineering Symposium (pp. 17–22). Soesterberg, The Netherlands. Retrieved from http://hdl.handle.net/1811/60454
- Woods, D. D., & Patterson, E. S. (2000). How unexpected events produce an escalation of cognitive and coordinative demands. In P. A. Hancock & P. A. Desmond (Eds.), Stress, workload, and fatigue. Hillsdale NJ: Lawrence Erlbaum Associates.
- Woods, D. D., Schenk, J., & Allen, T. (2009). An initial comparison of selected models of system resilience. In Resilience engineering perspectives (pp. 73–94). Surrey, UK: Ashgate Publishing Limited.
- Woods, D. D., & Wreathall, J. (2006). Stress–strain plots as a basis for assessing system resilience. In E. Hollnagel, C. Nemeth, & S. Dekker (Eds.), Resilience engineering perspectives, volume 1: Remaining sensitive to the possibility of failure (pp. 145–161). Aldershot, UK: Ashgate Publishing Limited.
- Xie, B., & Salvendy, G. (2000). Review and reappraisal of modelling and predicting mental workload in single- and multi-task environments. Work & Stress, 14(1), 74–99. doi: 10.1080/026783700417249