
ABSTRACT
African countries seek to intensify their industrialization while also increasingly pursuing green growth and, more recently, circular economy strategies. The competitive implications of this are, however, little researched empirically. We seek to investigate how African countries, examplified in this paper by Kenya, are experiencing a green and circular structural change of their economies. On the basis of early findings from a survey among 27 mixed manufacturing companies in Ruaraka industrial area in Nairobi, we highlight green and circular innovation trends, conditions and dynamics for different types of industries and firms (size). We apply a strong business perspective in framing the questions. We conclude that the companies are reaching a moderate stage of greening,although with a high degree of variability. Circular innovations are relatively widespread and ensuring resource supply seems to be a more important incentive than cutting costs. There seems overall to be quite strong business incentives to go circular among Kenyan companies, although these incentives are not necessarily realized by the companies, a factor that could be utilized in policymaking. We suggest a strong business-oriented survey methodology as a way forward to expand insights into the greening of industries in Africa and similar economies.
1. Introduction
The ‘green economy’, aligning the environmental issues with economic growth, has become an important corporate strategy and policy goal internationally, particularly in the last 10–15 years (UNEP/ILO/ITUC Citation2008; United Nations Citation2011). None the least, the recent UN Paris Agreement and the widespread adoption of the UN Sustainable Development goals (SDGs) from 2015 is having substantial global impacts (Andersen Citation2016; Mainali et al. Citation2018). More recently, it is the circular economy agenda that is gaining strong political attention worldwide, complementing the green economy agenda (Ellen MacArthur Foundation Citation2013). Also developing countries’ governments are increasingly aiming at developing green growth and increasingly circular economy strategies, particularly in the Asian transition economies, see, for example (Geng et al. Citation2013; Cai and Zhou Citation2014; Brahmbhatt, Haddaoui, and Page Citation2017; Mathews Citation2017; Gramkow and Anger-Kraavi Citation2019). However, the competitive implications of this for developing countries is disputed and little researched empirically (Schmitz, Johnson, and Altenburg Citation2015).
African countries are lagging behind other regions when it comes to industrialization and economic development. For the period 2008–2011, the average employment in the African industrial sector was 12.48% relative to 22.48% in Asia and the Pacific and 21.38% in the world (Evans et al. Citation2019). In Kenya, the case country in this paper, the contribution of the manufacturing sector to GDP has only risen slightly between 1960s and 2000s, from 10% to 13.3%, and agriculture remains by far the leading sector (Kabubo-Mariara and Karanja Citation2007). The industrial structure of Kenya, like many other developing countries, was originally strongly influenced by an import substitution strategy with heavy protection of domestic industrial activities. This inward-oriented strategy prevented the development of an externally competitive industrial sector (Ngui-Muchai and Muniu Citation2012). Still, compared to African standards, Kenya’s economic development is doing relatively well: In 2020, Kenya was ranked the third most innovative country in Sub Saharan Africa.Footnote1
Many African countries are in later years targeting stronger industrialization policies as a core means to strengthen their economic growth (Evans et al., Citation2019). This, we propose, presents a window of opportunity for achieving a sustainable industrialization trajectory. Increasingly, also African governments are seeking to align their industrial policies with green growth or circular economy strategies (Hamdok Citation2015; Gower and Schröder Citation2016; Sampath Citation2016; United Nations Citation2016; Jordaan Citation2017; Desmond and Asamba Citation2019; Koech and Munene Citation2020). This is also the case for Kenya. It goes beyond this paper to go into a detailed analysis of the policy and institutional context in Kenya – see Desmond and Asamba (Citation2019) for a review of this. Nevertheless, a few main policy initiatives should be mentioned.
Recently, new industrial policies have been formulated which contain ambitious targets of turning Kenya into an industrial nation but also incorporate sustainable and, particularly, green industrial policies (Soezer Citation2016; Koech and Munene Citation2020). The first ambitious industrial policy in Kenya was launched in 2008, the ‘Kenya Vision 2030’, aiming to convert Kenya into a newly-industrialising country providing a high quality of life to its citizens in a clean and secure environment (Government of Kenya Citation2007). This has been followed up by the ‘Green Economy Strategy and Implementation Plan’ (GESIP) for 2016–2030 (Government of Kenya Citation2016), supported by the National Climate Change Action Plan (NCCAP) 2018–2022 (Government of Kenya Citation2018) and the Nationally Appropriate Mitigation Act (NAMA) based on the Circular Economy Solid Waste Management Approach.
The broad question we feed into in this paper is whether African countries can achieve higher levels of industrialization in a green and circular way while simultaneously struggling to catch-up with the more developed economies. A core discussion on green catching-up is whether developing countries’ economic growth should come first and the environmental clean-up should wait until their economies are stronger (Schmitz, Johnson, and Altenburg Citation2015). It is argued that developing countries have disadvantages compared to developed economies as the latter have early mover green advantages and stronger innovation capabilities than the former, often more factor-driven developing economies. Also, the developing countries lack the resources and the institutional set-up to deal with the green transformation (Schmitz, Johnson, and Altenburg Citation2015).
The green catching-up debate is still incipient, particularly when it comes to Africa (Altenburg Citation2009; Collier and Venables Citation2012; Altenburg and Engelmeier Citation2013; Schmitz, Johnson, and Altenburg Citation2015; Desmond and Asamba Citation2019). One reason is that much sustainability and circular economy research is more prescriptive than descriptive, even more, when it comes to developing countries. Critical investigations on the business impacts and trends are, however, upcoming (Gregson et al. Citation2015; Doranova et al. Citation2016; Linder and Williander Citation2017; Mathews Citation2017; Winans, Kendall, and Deng Citation2017; Reike, Vermeulen, and Witjes Citation2018).
Applying evolutionary economic theory, we seek to feed partly into general studies of eco-innovation dynamics and circular innovation, partly into the green catching-up discussion by investigating how African countries, examplified by Kenya, are experiencing green and circular structural change of their economies. On the basis of findings from a survey among 27 mixed manufacturing companies in Ruaraka industrial area located in the capital Nairobi, we investigate green and circular innovation trends, conditions and dynamics. The survey forms the first part of the data collection in the on-going Danish-Kenyan research project ‘Gecko’, which aims to develop the knowledge base for making circular industrial parks in Kenya.Footnote2 The survey has been undertaken in 2018 in a collaboration with the Danida SSC program.Footnote3 The analysis hence represents the early findings only in the Gecko project.
In the survey we seek to uncover two questions: (1) How green and circular are Kenyan companies? (2) What are the conditions for green and circular innovation in Kenya as perceived by the companies? Concerning the conditions, we focus on the resource constraints little analysed. Our hypothesis is that the costs and security of supply of resources may influence importantly on the nature and extent of green and especially circular innovations in developing countries often characterized by poor infrastructure. We look further into the role of sectoral specificity and firm size as explanatory factors.
Both our research questions are hitherto limited answered, particularly in Africa. Studies into eco-innovation trends and dynamics in companies are more widespread in developed countries, but rising globally and especially in Asia (see e.g. OECD Citation2009; Doranova et al. Citation2016; Park et al. Citation2017). We perceive a major research gap in investigating trends, conditions and dynamics in the greening of firms and industries, particularly in Africa. Quantitative studies are particularly lacking, and those that are available mainly look into self-assessed impacts and drivers rather than trends and conditions as we shall expand on in Section 2.1.
A reason for the limitations in quantitative studies in Africa is the limited availability of reliable data sources (statistics, regular surveys). Also, African manufacturing companies – and this is certainly true in our case area in Kenya – are often reluctant to participate in empirical environmental research, as they are sceptical or even negative towards environmental authorities whom they see as ‘policing’ them through the enforcement of the environmental regulation. They have fears that their data may be transferred to the authorities. This factor seems little researched.Footnote4 Partly in order to address this issue, we apply a strong business perspective in the framing of the survey questions, as we will elaborate on in Section 2. We hence suggest a strong business perspective is a fruitful avenue for undertaking studies of the (polluting) manufacturing sector in countries which are not so advanced in their green economic change. Overall, we currently know little about how green and circular African companies are and hence the degree to which Africa is entering the green and circular economy, a question we consider of high importance for policymaking.
The paper is primarily exploratory, focusing on presenting the empirical results of the company survey. This naturally limits the theoretical discussion, the institutional analysis and the review. Recognizing the limitations of our small survey, we argue that it represents a rare case of African empirical quantitative research into the greening of industries and with a higher representativity than the other studies we have found in Kenya, see Section 2.1.
The paper is structured as follows: Section 2 brings shortly a theoretical discussion with a clarification of the research questions and the survey methodology. Section 3 brings the survey analysis of the Ruaraka companies. Finally, section 4 concludes.
2. Theory, research questions and methodology
Applying evolutionary economic theory, our focus is on understanding the processes of economic change over time and the role of innovation in this (Freeman Citation1979; Nelson and Winter Citation1982). Applied to the green economy, this means we focus on the degree of integration of environmental parameters into the economic process at the firm level, i.e. an economy is green when the environment has become an important driver of economic development (Andersen Citation2008, Citation2016). In economic terms, it reflects the degree to which environmental externalities have become internalized (Kemp and Soete Citation1992; Andersen Citation1999, Citation2008, Citation2009). Essential in this analysis is the degree to which the environmental activities of the firm are moving beyond environmental regulation, that is, from obstructive or reactive corporate strategies towards proactive strategies, aiming to develop a green business case and routinely engaging in eco-innovation (Kemp and Soete Citation1992; Porter and van der Linde Citation1995; Andersen Citation1999, Citation2008). This paradigmatic shift emerged in the 1990s but more studies are needed in order to trace the global diffusion of this (Mathews Citation2017; European Commission Citation2018).
From the existing literature on surveys and case studies into the drivers and dynamics of the greening of firms, it is evident that there are generally multiple drivers to greening. Although different surveys show deviating results there is a relative consensus on the main drivers being environmental regulation, customer and/or supplier demand, resource productivity, employee satisfaction and branding, see, for example (Dangelico and Pujari Citation2010; Kesidou and Demirel Citation2012; Berrone et al. Citation2013; Hojnik and Ruzzier Citation2015; del Río, Peñasco, and Romero-Jordán Citation2016; Rosati and Faria Citation2019). We recognize the many drivers to the greening of companies. Our perspective is that any measure which creates ‘green’ value to the company and enable it to stay in business or improve its competiveness is a green business case (Andersen Citation2001, Citation2008).
We understand the circular economy concept as an add-on (or sub) agenda to the green economy. It entails moving beyond the green economic integration parameter and emphasizes the intelligent use and maintenance of resources at their highest level throughout the economy in order to achieve maximum resource efficiency; that is, an economy that is resource preserving, regenerative by design, near zero-waste and with as closed loops as possibly (Ellen MacArthur Foundation Citation2013; Kalmykova, Sadagopan, and Rosado Citation2018). This agenda is expected to have pervasive impacts in all spheres of the economy and calls for radical innovation both technologically and in business models (Ghisellini, Cialani, and Ulgiati Citation2016; Lewandowski Citation2016; Lieder and Rashid Citation2016; Urbinati, Chiaroni, and Chiesa Citation2017; Nascimento et al. Citation2019).
We also acknowledge that the green and circular economy goes beyond the manufacturing sector into other business areas but focus in this paper is on the manufacturing sector; partly because it is a highly polluting and resource intensive sector; partly because it is core to many African countries’, contemporary ambition of industrializing their economy. Hence, we are investigating the current possible window of opportunity of aligning industrialization to a green and circular transformation in Africa.
2.1. Research questions – explanatory factors of the industrial greening process
In our small survey among the Kenyan companies, we track evidence of the uptake of and conditions for green and circular strategies and innovation among the Kenyan manufacturing companies. Through this, we uncover how far the Kenyan companies are in the green and circular transformation, as well as the conditions for going green and circular. We interpret this as key to understanding the current stage and dynamics of the green economic change in Kenya. We have chosen not to spend survey time on self-assessed drivers of greening, which, as discussed earlier, are the focus of most existing company green surveys.
Regarding question 1, on the degree of greening of Kenyan companies, we first inquire into green organizational change, understood as the rise of proactive green strategies. We use environmental management systems as a proxy, see also (Kollman and Prakash Citation2001; González-Benito and González-Benito Citation2006; Hertin et al. Citation2008; Nawrocka and Parker Citation2009). Second, we inquire into the degree and nature of the green innovations, using a simple maturity curve: We ask into respective end of pipe (EoP), resource efficiency, circular innovations (which is here reduced to recycling measures) and product innovation, representing a learning curve from reactive strategies towards more preventive and radical innovations.Footnote5 These questions are easy to answer for the companies. We refer to all the three main environmental resource streams: Water, energy and materials/waste, while many circular studies mainly refer to materials, see, for example (Ellen MacArthur Foundation Citation2013). Our questions here echo the established quantitative measures of eco-innovation and the greening of business (Eco-innovation Observatory Citation2012; Commission Citation2018).
Regarding question 2, on the conditions for greening: We focus on uncovering the quality of public environmental infrastructure (energy supply, water and wastewater, waste handling) and how it affects the manufacturing companies. This we consider of special interest in a developing country context. We argue that the status of such infrastruture can give us important information about the conditions and incentives for green and circular innovations among African companies. Infrastructure states and trends are well analysed in developing countries but rarely in connection to business surveys. In our survey, we highlight the business perspective, that is, how companies perceive their resource supply conditions and costs. The inclusion of these questions is an important novelty of our analysis. A hypothesis of this paper – and of the Gecko research project – is whether African economies, as late-comers in the global greening with few investments yet in environmental infrastructures and less locked-in to linear economic thinking and technologies, can leapfrog into a green and especially circular economy trajectory, as also discussed by Messner (Citation2016).Footnote6
To highlight the industrial dynamics, we investigate further if the variables industrial sector and firm size influence on the answers:
- Add. 1 The sectoral characterization of companies is recognized to be an important factor determining their innovation efforts see, for example (Pavitt Citation1984; Malerba Citation2002). Green studies into sectoral eco-innovation patterns are yet few but indicate a significant importance (Mazzanti and Zoboli Citation2006; Oltra and Saint Jean Citation2009; Ghisetti and Quatraro Citation2017; Faria and Andersen Citation2017a, Citation2017b).
- Add. 2. The role of firm size is well recognized to have positive effects on eco-innovation performance; that is, because of bigger companies larger brand value, their access to higher amounts of financial and human resources and innovation capabilities, as well as access to international markets, see, for example (Brunnermeier and Cohen Citation2003; Rehfeld, Rennings, and Ziegler Citation2007).
When looking into prior empirical research into trends and dynamics of the greening of Kenyan companies, we find the following results. The research mainly highlights the barriers or impacts on the greening of the companies. The research demonstrates that while Kenyan policy initiatives towards green growth and circular economy are strengthening, many issues hamper the green industrialization in Kenya. A comprehensive study by UNEP identifies that the manufacturing sector suffers from weak policy coordination among governmental bodies, lacking planning and low R&D rates. Companies struggle to meet quality standards due to the use of outdated technologies and lack of technical skills and strategic management and there is no systematic monitoring of industrial effluents and emissions (UNEP Citation2014). Kiongera (Citation2003) investigated the greening of the Kenyan cement companies, citing financial constraints and lack of demand as main challenges, which is supported by other studies.Footnote7 This study also documented that the companies are already taking some green measures such as eco-labelling, proper solid waste handling and promotion of awareness among stakeholders. Wabwoba, Wanyembi, and Omuterema (Citation2012) applied a questionnaire to find the attitudes of Kenyan business towards the adoption of green ICTs and found that the lack of skills and support at top-level management are factors hampering the adoption of such technologies.
Some studies have investigated the impacts of green business activities. Among the few quantitative analyses undertaken, Njoroge Irene, Irandu Evaristus, and Moronge James (Citation2017) assessed the environmental and business impacts of the greening of Kenyan companies through a survey of 15 mixed manufacturing companies in Nairobi. They concluded that cleaner technologies had positive impacts on the companies analysed. These were in terms of material, energy and water consumption, but also improved corporate image, increased staff morale as well as safety and product quality. However, since the study was conducted only with companies that already had a relatively high green performance,Footnote8 and the sample was small, the representativity is somewhat limited. Barasa, Namusonge, and Iravo (Citation2015), in their study of steel manufacturing companies in Kenya, conclude that the adoption of green supply chain practices could increase their performance. In a study on the food manufacturing firms in Kenya, they conclude that adopting technologies such as green packaging materials led to an increase in sales and profitability and therefore competitive advantage. Desmond and Asamba (Citation2019) highlight in their Kenyan circular economy study how this has created small scale businesses dealing with plastic and WEEE (waste of electrical and electronic equipment) recycling, aiming at linking the many missing parts of the recycling value chain in Kenya. The effects on the manufacturing sector more generally are, however, not addressed. Kihiko and Kinoti have undertaken a small survey among 10 companies, of which one only is from manufacturing, concluding that Kenyan companies’ managers expect higher operating risks and costs due to climate change (Kihiko and Kinoti Citation2016).
Overall, the Kenyan green company studies are quite small and fragmented. They do identify several green activities among Kenyan mainly manufacturing companies, demonstrating numerous internal and external barriers to the greening of industries. Seemingly, some positive business impacts and potentials are identified but the overall picture is one of early-stage greening of the manufacturing sector. The actual extent of the greening of Kenyan industries is little analysed and there is a lack of longitudinal studies. Furthermore, resource challenges and conditions are not addressed.
2.2. Methodology
The empirical results presented in Section 3 are derived from a survey presented to 35 mixed manufacturing companies based in the Ruaraka industrial area in the capital city Nairobi in early 2018. There are about 80 companies located in Ruaraka, with a varied group of large and medium-sized manufacturing companies of which the 35 targeted companies make up the main manufacturing companies in the area. The sample consists of those 27 out of the 35 who were persuaded to participate in the survey. The sample is hence too small for statistical analysis. The survey was carried out in person at the factories by the local Ruaraka business association ‘Rubicom’, who was able to persuade – through many attempts – most companies to participate and carry out the survey, hence the remarkably high response rate.Footnote9 For the companies, answering the survey was a requirement to take part in the Gecko research project and seen as an input to the Danida environmental SSC programme. Overall, we consider the representatitivity very high.
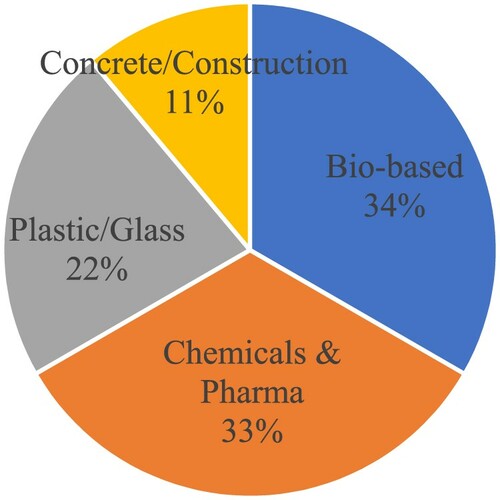
The companies represent a broad sectoral representation (see ), including some high-tech industries (chemical and pharma) as well as some very large food and textile industries. The size distribution is also varied: nearly half (47%) are medium sized (100–300 employees), 36% are small (<100 employees) while 16% are large (>300 employees). The very small companies in the area are not included. Most of the companies, also in part the large companies, are oriented mainly towards national or regional (East African or African) markets.
Figure 1. Sector distribution of the sample (see appendix for more details).Footnote12
The survey is a baseline survey forming the first part of the data collection in the Gecko research project as well as also feeding into the Danida environmental SSC program. The questions were carefully formulated with a strong business perspective, inquiring into the conditions and challenges the companies are facing in their daily handling of their resource inputs, production and residues. Questions that could be considered judgemental were avoided.
In making the survey detailed feedback on the survey questions were given by eight Kenyans representing important stakeholders in Kenya, from respectively the Ministry of Environment, the Ministry of Industry, the Nairobi County, NEMA (the Kenyan environmental protection agency), KIRDI (Kenyan Industrial Research and Development Institute) and the local Ruaraka business association ‘Rubicom’.Footnote10
3. Results of the 2018 Ruaraka baseline survey
The Ruaraka industrial area is located within the outskirts of Nairobi. Most of the 27 responding companies are located closely together in the industrial area, which is surrounded largely by informal settlements. The infrastructure is poor when it comes to roads, internet and basic services such as electricity, water supply, wastewater management and waste management. There is one energy utility and one combined water and wastewater utility, and no waste utility, though hazardous waste is incinerated in one central plant in Nairobi. There are no public recycling schemes for solid waste. All non-recycled waste is taken by licensed trucks to the local dumpsite ‘Dandora’, Africa’s largest dumpsite, which lies close by, where informal recycling is widespread and to a high degree run by the cartels.
We divide the findings of the survey into two main sections: First, a section focusing on corporate green strategizing and the companies’ perception of environmental and resource conditions and challenges; and second, a section highlighting the green and circular innovation activities within the companies.
3.1. Corporate strategies, environmental and resource challenges
In this section, we investigate the degree to which the companies are greening their corporate strategies and management practices, that is, if they are complying with environmental regulation or going beyond compliance into green business development. As proxy, we investigate if they have implemented environmental management practices. As a basis for understanding their green strategizing and innovation, we inquire into how they perceive the environmental challenges, the environmental infrastructure and resource availabilities relative to their business activities.
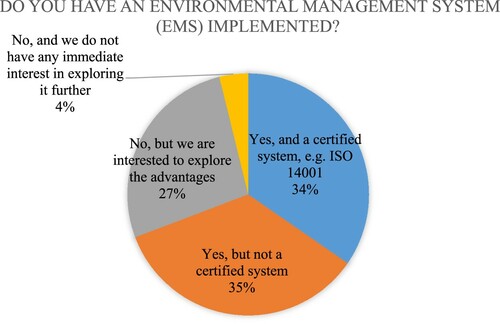
First, the survey indicates that quite a high number of the companies in Ruaraka have implemented an environmental management system (EMS), as seen in , the figure shows that they are widespread, nearly 70% claim to have some kind of EMS, with about one third having certified systems. Only 4% are not interested in getting an environmental management system, meaning that nearly all the companies already have or are interested in getting such a system.
Figure 2 . Companies’ level of Environmental Management System implementation (%).
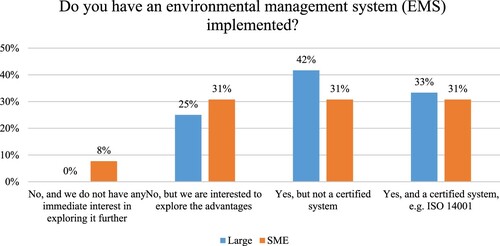
Moreover, indicates that the implementation of EMS is not restricted to the larger companies, the medium sized are performing only a little worse than the biggest companies. This may reflect that the very small companies are not included in the survey. Regarding the industries’ differences, EMS was found to be quite widely distributed. The relatively widespread use of such environmental management systems indicates that the Ruaraka companies have started working more strategically and systematically with environmental issues.
Figure 3. Firm size and companies’ level of EMS implementation (%).
The 34% certified EMS is seemingly higher than the similar EU average among European manufacturing SMEs which is 17%, with 62% stating they do not have an environmental management system (European Commision Citation2018). But comparisons should be made carefully, as the interpretation of ‘certified’ may vary considerably between European and Kenyan companies.
In order to investigate how the poor Kenyan infrastructure may affect Kenyan companies in terms of their green strategizing and innovations, companies in Ruaraka were asked to evaluate, on a 1–5 Likert scale, the impact of some resource and environmental problems.
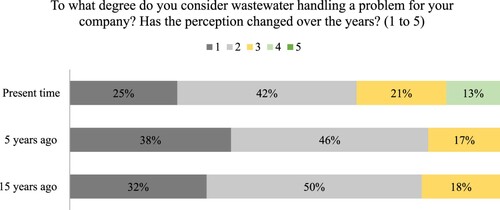
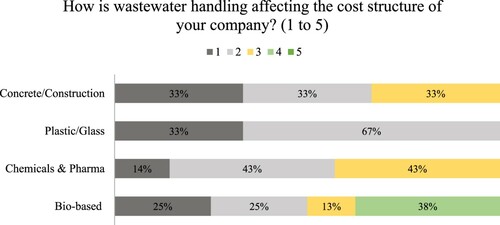
Starting with water issues, wastewater handling is only to a limited degree seen as a problem for the companies, which has not changed much over the years, though seen as growing more lately (by 13% of the companies) (). This may be interpreted in several ways. Most likely, the costs of wastewater handling are low and the environmental enforcement predominantly weak.
Figure 4. Companies’ perception on wastewater handling issues over time (% of companies).
When we take into consideration the sectoral differences among the sample, the data indicates that the group of companies related to bio-based industries (e.g. food, textiles and paper) is more affected by wastewater issues, followed by chemicals and pharmaceuticals (). Those are industries that are either water intensive or using heavy chemicals – thus more exposed to stricter regulations.
Figure 5. Companies’ perception on wastewater handling issues by sector (% of companies in each group).
The companies’ low perception of wastewater as a challenge is interesting given there has been a rising public focus on wastewater pollution from Kenyan manufacturing industries and lately a wastewater scandal. Several factories have been closed after being caught with illegal discharges of wastewater, and four of the case Ruaraka companies were also found with illegal discharges but not closed.Footnote11 This scandal went public, though, after the survey was carried out.
On the supply side, most of the companies report serious issues with water shortages that can be quite frequent and affect their costs and production processes substantially. A high number of the companies are severely and regularly restrained by water shortages in their production. For instance, the companies report that they might spend up to US$ 1 million per year finding alternatives to water supply during shortages, as well as production loss costs if they need to stop the production during periods of water shortage. The periods of the year that the companies report they are subject to water rationing are quite inconsistent: some cite specific months such as January to March or June to September, while many say that the water problems occur all year round. It seems, therefore, that the water rationing is not related to the rain patterns but is more a problem of supply infrastructure.
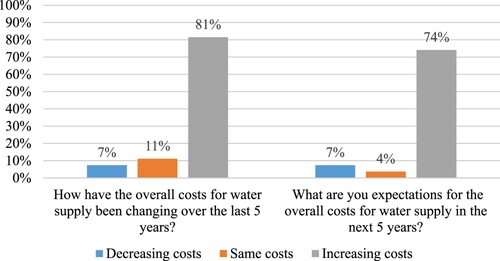
The present and future cost of water supply are seen as strongly rising by most companies, indicating a general perception that water supply is likely to become a bigger problem in the future (). We have not connected this question to climate change specifically, although it might reflect its effects.
Figure 6. Companies’ overall water supply costs (% of companies).
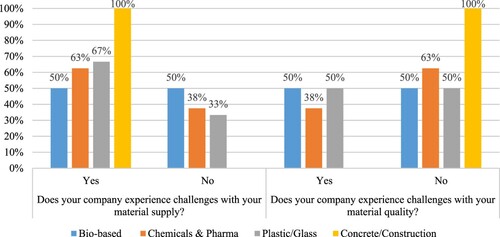
The companies were also asked about their challenges concerning material supply and quality (), as well as their solid waste handling. Most industries have similar perceptions: the companies report that their main challenges concerning the material supply are delays and shortage of materials that are imported, in part related to delays at Mombasa Harbour. In terms of quality, they report issues such as moisture content, contamination and lack of homogeneousness in their material supplies. For the Concrete/construction group supply problems are rising; they cite the case of river sand, which is becoming an issue due to environmental authorities that regulate its extraction.
Figure 7. Companies’ challenges concerning material supply and quality (% of companies in each group).
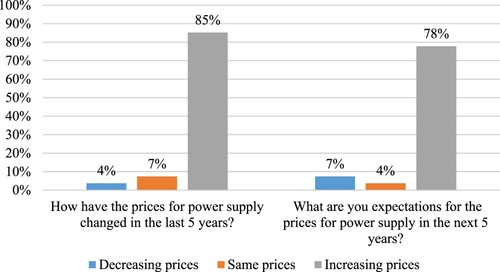
Finally, the energy costs are by far considered the most demanding for the companies and these are estimated to go up dramatically (see ).
Figure 8. Companies’ overall power supply costs (% of companies).
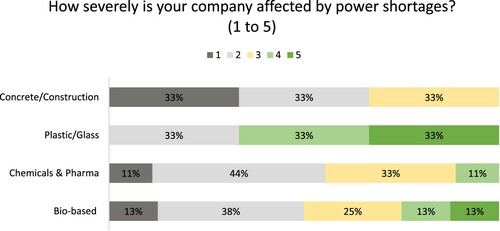
Power shortages are a major issue in Ruaraka. There is, though, no consensus among the companies regarding the frequency of blackouts that they experience. While some argue that power outages are more common during specific times of the year (rainy season or dry spells), others claim that such events occur all year round and are not predictable. When blackouts occur, they all resort to internal standby generators. shows significant differences among the industries. Plastic and glass industries are more affected than the other industries regarding the impact of power shortages.
Figure 9. Companies’ perception on power shortages by sector (% of companies in each group).
Overall, the data reveals that resource supply problems are very important concerns across most companies albeit with sectoral differences. Costs are mainly high for energy purchase, although going up for water. The discharge costs and compliance matter less so for both water and waste. This implies that environmental enforcement is somewhat weak showing quite a distinct development country/early greening pattern.
The analysis so far indicates that the Ruaraka manufacturing companies are, somewhat surprising, well on their way with working more strategically and systematically with environmental issues. The companies are facing quite severe resource handling problems which affect their production negatively, and hence have high incentives to engage in green and circular innovations to deal with these.
3.2. Green and circular innovations in Kenyan companies
This section uncovers the degree and character of the green and circular innovations as captured in the survey, going from the curative end of pipe (EoP) towards the more integrated and preventive resource efficiency innovations, followed by the adoption of more advanced green recovery and product innovations.
3.2.1. Innovation for EoP and resource efficiency
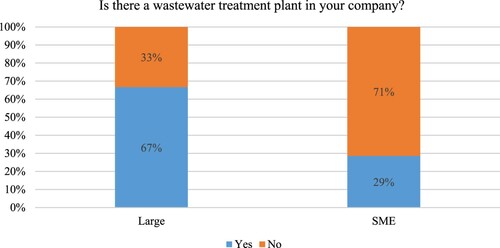
The core end of pipe (EoP) technologies in Kenya are related to wastewater treatment, which is a central policy target and hence subject to environmental enforcement by the environmental authorities. Industrial air pollution is not getting the same attention, nor does solid waste, where licensed collectors take the waste to the local dumpsite. The waste amounts deposited are not measured. When it comes to wastewater pretreatment through installation of their own treatment plant (), there is a big difference between the large and smaller companies: 67% of the large companies (versus only 29% of the smaller companies) have their own plant. This, though, does not inform us of their quality. Given the current mentioned industrial wastewater scandal in Kenya, we may presume the quality may not always be that high.
Figure 10. Companies’ level of EoP implementation in wastewater by size (% of companies)
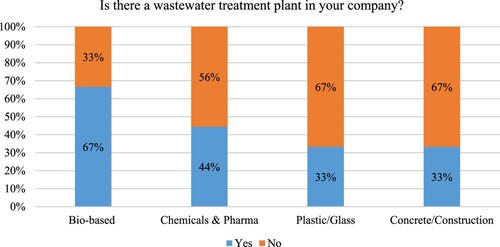
There are, as expected, substantial differences among the industries regarding their wastewater treatment plants (), with most bio-based companies having wastewater treatment plants. It is noticeable that a number (56%) of chemicals/pharma companies do not have wastewater treatment plants, giving their high pollution footprints.
Figure 11. Companies’ level of EoP implementation in wastewater by sector (% of companies in each group)
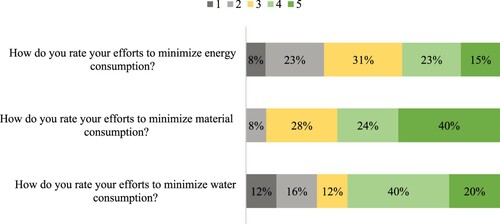
When it comes to resource efficiency, the result shows quite a high level of innovation for resource efficiency (). The most positive results are within material consumption where as much as 40% scored very high, and 64% in all scored high (score 4 and 5), and only 8% scored low (score 1 and 2). Also, water is relatively high with 60% scoring high, but also quite many (28%) scoring low, of which 12% very low (score 1). Energy scores a little less, with 38% high, and 31% scoring low. This is interesting given the companies’ high perceived energy costs, indicating the barriers to uptake of resource efficient solutions.
Figure 12. Companies’ perception on innovation for resource efficiency (% of companies).
The companies assess quite a high level of opportunity to expand these innovation efforts further. Energy savings is seen as most promising, or needed, (54% high level (score 4 & 5)), while water savings somewhat less but still quite high (34% high-level score 4 and 5 ()).
Figure 13. Companies’ perception on potentials for further reductions in resource consumption (% of companies).
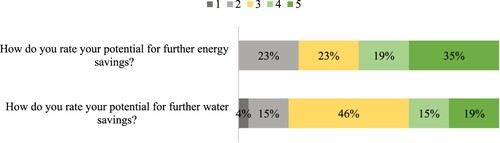
This relatively high potential scoring shows that the companies do well recognize the need for further green improvements in their production. This finding is confirmed by a study in energy efficiency innovation in Kenya showing the negative impact of the widespread use of outdated, energy-inefficient production technologies (Were Citation2016).
3.2.2. Product innovation and circular innovation in Kenyan companies
In this section, we investigate the more radical green innovations, namely product innovations and circular practices (recovery). The companies were asked about their eco-design activities as well as the use of hazardous substances, that is, we presume a correlation between companies scoring high on eco-design/green product design would score low on hazardous substances. The results are summarized in and .
Figure 14. Circular environmental targes by size (% of companies in each group).
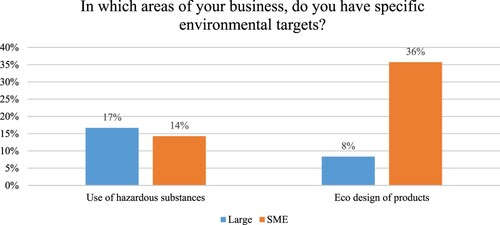
Figure 15. Circular environmental target by sector (% of companies in each group).
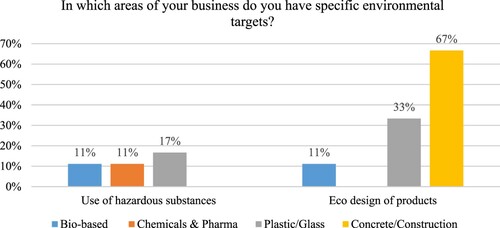
A surprisingly 36% of SMEs claim to have ecodesign targets, compared to 8% of the large companies, (). Industry differences are significant, with construction scoring high, plastic/glass scoring medium, biobased scoring low and the R&D intensive pharma/chemical sector have no eco-design targets and hence appearing as the least advanced when it comes to product eco-innovations.
Concerning targeting the replacement of hazardous substances it is quite low for all types of industries. Especially the construction sector shows low interest. There is a discrepancy between the claimed relative high level of eco-design of products (as well as the formerly mentioned implementation of environmental management systems) and the low concern with the use of hazardous substances, which may reflect a less consolidated and systematic stage of greening. We need to know more about how the companies understand eco-design in order to interpret the data.
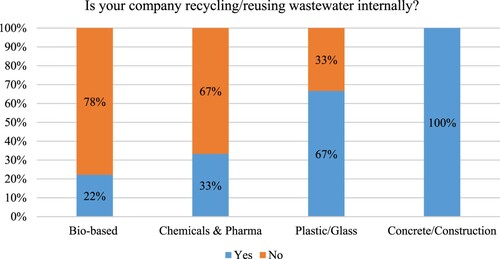
Moving on to the more direct circular innovations, the picture is also varied: Concerning water recovery, the sectoral differences are pronounced. All the Concrete/Construction companies reuse wastewater internally, while the plastic/glass segment is also high with 67% answering positive, while chemical/pharma and bio-based recovery are much lower, respectively 33% and 22%. This is likely due to the water specificities of their production process ().
Figure 16. Circular innovation – wastewater reuse by sector (% of companies in each group).
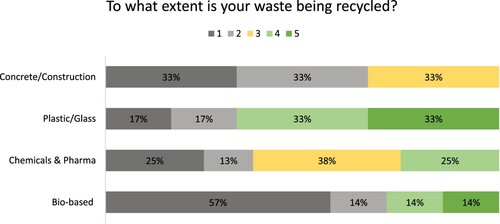
In terms of material recycling, however, see , construction companies struggle to recycle their waste, while the plastic and glass companies (most of which are in plastic) have a very high rate of recovered content; 67% score high (4 and 5, of which 33% very high). This is especially interesting given the generally very low recycling rate of plastic worldwide (Nkwachukwu et al. Citation2013). Kenyan companies seem to be performing well here. The chemical/pharma companies show a medium circular performance with 25% high and 38% medium level answers. Poorest performers are the biobased industries which have 28% high – but as much as 71% low scores, of which 57% are very low (score 1). This again highlights the considerable technological differences in sectors in terms of the various waste streams and their recovery potentials. Some sectors can easily be circular in terms of one resource (e.g. wastewater), while they struggle to be circular in other resources – a factor that is sometimes neglected.
Figure 17. Circular innovation – material reuse by sector (% of companies in each group).
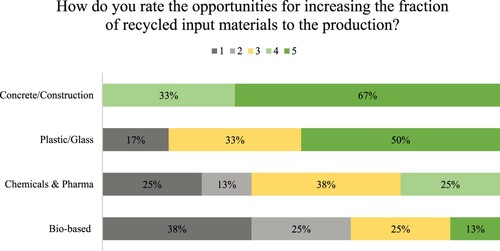
Concerning the opportunities for circular solutions in material use, the data shows how different the sectors also are in terms of their perceptions about opportunities to increase the fraction of recycled input in their products. While Concrete/Construction perceive very strong opportunities, the potential use of recycled content in bio-based industries seems to be quite limited (83% low). Plastic/glass also has high opportunities (50% high) despite the already high recovery level, while pharma/chemicals are scoring in between ().
Figure 18. Circular innovation – opportunities for material reuse by sector (% of companies in each group).
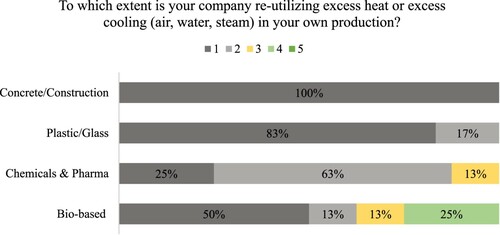
Regarding the utilization of excess energy (heat and cooling), most companies recognize that it is only taking place to a limited degree, in construction not at all; only the bio-based industries are moderately engaged here, see .
Figure 19 . Circular innovation – energy reuse by sector (% of companies in each group).
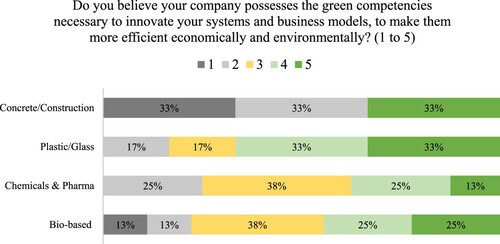
Finally, from , companies were asked to rate, from 1 to 5, if they believe they have the competences necessary to eco-innovate and change their business models. The results show that these competences are present at quite a moderate level and in similar proportions across the industries.
Figure 20. Companies’ perceptions on green competencies by sector (% of companies in each sector).
Interestingly, a somewhat similar pattern is also observed when the sample is divided by company size ().
Figure 21. Companies’ perceptions on green competences by size (% of companies in each group).
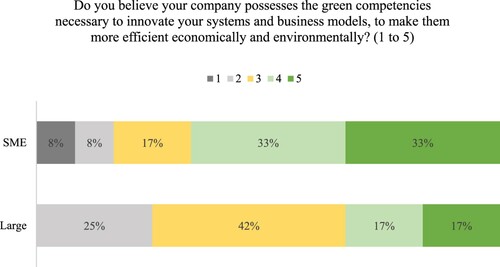
More SMEs score high and declare to possess strong green competencies but a bigger proportion of the larger companies score medium-high as compared to the smaller companies so the picture is mixed. None of the large score very low, compared to 8% of the small companies scoring low (score 1). This may reflect the presence of some dedicated green smaller/medium companies who are offering green products which fit with the eco-design scores discussed earlier. But the result contrasts somewhat with the common notion that larger and more international companies have more resources and incentives to conduct eco-innovation and transform their activities. This finding needs further investigation.
4. Conclusion
While African countries are lacking behind in industrialization and economic development, the question addressed in this paper is whether they are equally behind in their green and circular economic change. In other words, we are investigating to what degree manufacturing companies in Africa are entering the green and circular economy. We see the analysis as feeding into wider evolutionary economic research into the dynamics of green economic change and trends in green catching-up and the global greening of the economy. In doing so, the paper has sought to feed into a large research gap for descriptive research into the trends, conditions and dynamics for green and circular innovation and corporate strategizing in Africa.
The survey undertaken represents the first early findings in an ongoing research project (Gecko). We acknowledge the limitations given by the small size of the survey, the statistical uncertainty and the self-assessment of the companies. While the sample is small, the representativity is high as the survey covers most of the main manufacturing companies in the chosen industrial area (Ruaraka) in Nairobi. The survey represents a rare quantitative study of the greening of Kenyan and African manufacturing firms.
The research was limited to two broad research questions: (1) How green and circular are Kenyan companies? and (2) What are the specific conditions for green and circular innovation in Kenya? We applied a strong business perspective in the survey framework, inquiring into corporate strategizing, resource and environmental challenges and actual innovation activities within the companies. Our hypothesis is that environmental infrastructure conditions matter for the incentives for green and circular innovations particularly in an emerging economies context where institutional and technical infrastructures are often less developed.
The analysis shows, at a general level, that the Ruaraka manufacturing companies seem relatively green, though more at the strategic level than in innovation practice. We find that a relatively high number of companies are engaged in environmental management systems as well as seemingly have a high interest in and a recognition of further green and circular innovation potentials. Overall, the Kenyan companies are reaching what we may call a moderate to the medium stage of greening. We demonstrate, however, considerable differences between the industries, which need further attention from both researchers and policymakers. Firm size also matters but less than expected, with the larger companies being generally greener but the picture is varied. More studies are needed on this.
Concerning the environmental infrastructure conditions, we have identified severe resource supply problems (energy and water shortages and blackouts) which are affecting the companies negatively, at least as much as the resource costs which are only big for energy though rising on water. Sink issues (waste and wastewater handling) are not considered a big challenge yet. These conditions seem to have led to quite a high focus on innovations for resource productivity, that is, resource savings, but also circular innovations and a strong perceived interest into circular innovations. There are some interesting indications that the Kenyan economy when it comes to materials (but less so on water and not in energy) may already be on quiet a strong circular technological trajectory relative to their degree of economic development. But the picture is varied, and more studies are needed to investigate this. There are, overall, still high potentials for green and circular innovations and none the least green product innovation, recognized by the companies’ themselves.
We conclude tentatively that the tendencies and conditions for green and circular innovations portrayed reflect conditions that may be characteristic of many African countries, albeit comparative studies are needed. The implications for policy are that quite many Kenyan companies seem to be already on or interested in green and circular strategizing and innovation, and with business conditions favouring these, albeit these may not always be sufficiently perceived by the companies. If strategies and policies can address these issues and take on a sufficiently strong business and innovation-oriented policy approach it may be possible to accelerate the shift from obstructive/reactive to proactive green strategizing and to move the Kenyan industrialization into a green and circular competitive growth trajectory.
We finally suggest that the suggested strong business approach applied in the survey may be a viable method forward in surveying companies in less green regions, where companies may have a negative or defensive attitude to greening.
Acknowledgements
We acknowledge the effort of Rubicom, in getting the companies to participate in the survey and the helpful feedback on the survey questions from the eight Kenyan participants in the Danida ‘Green and Circular Economy Course’ 2017, namely: August Kenduiwo, Deputy Director, Climate Change, Ministry of Environment, Lawrence Mwangi, Deputy Director Environment, Nairobi County, Godfrey Wafula, Joseph Makau and Francis Chwanya, NEMA, Benson Waweru, Chief Industrial Development Officer, Ministry of Industry, Trade and Cooperatives, Betsy Bowen, researcher, KIRDI, James Kanga, manager, ‘Rubicom’. We further wish to acknowledge the helpful feedback from the two anonymous reviewers.
Disclosure statement
No potential conflict of interest was reported by the author(s).
Additional information
Funding
Notes
1 According to the Global Innovation Index, from the World Intellectual Property Organization (WIPO). https://www.wipo.int/edocs/pubdocs/en/wipo_pub_gii_2020.pdf
2 Gecko, ‘Green and Circular Innovation in Kenyan Companies’, is a Danida financed research pilot project running April 2018–end March 2021 led by the first author.
3 Danida, the Danish development agency, runs a series of shorter Strategic Sector Cooperation Programmes (SSC), with their partner countries, of which Kenya is one. In Kenya they target environmental issues and food.
4 We have not found any papers specifically covering this theme. When presenting the paper at the Africalics conference in 2019, several researchers in the audience from African countries made comments like ‘how on earth did you make the companies participate? Our companies are much too sceptical towards environmental authorities to engage in such surveys’.
5 See also Andersen (Citation2008) and Kemp (Citation2010) for a theoretical discussion on eco-innovation concepts.
6 See also Collier and Venables (Citation2012) and Desmond and Asamba (Citation2019), and Huq (Citation2011).
7 See Mungai and Samuel (Citation2009) for a similar study in the Pharmaceutical industry in Kenya.
8 The companies participating worked in collaboration with the Kenyan environmental authorities (NEMA) and had declared that they had adopted clean technologies.
9 The persons who filled out the survey were typically the CEO and/or production manager.
10 The eight Kenyans took part in a 7 week Danida course in Denmark on ‘Green and Circular Economy’ taught by the main author in 2017.
11 See http://www.nema.go.ke/index.php?option=com_content&view=article&id=285:firms-shut-for-discharging-untreated-effluent&catid=10:news-and-events&Itemid=438. Information on the Ruaraka companies’ role has been supplied by Deputy DIrector of Environment Lawrence Mwangi, the Nairobi County in 2019.
12 There are metal based industries in Ruaraka but they did not take part in the baseline survey.
References
- Altenburg, T. 2009. Building Inclusive Innovation Systems in Developing Countries: Challenges for IS Research. In Handbook of Innovation Systems and Developing Countries, 33–56. doi:https://doi.org/10.4337/9781849803427.00008
- Altenburg, T., and T. Engelmeier. 2013. “Boosting Solar Investment with Limited Subsidies: Rent Management and Policy Learning in India.” Energy Policy 59: 866–874. https://doi.org/https://doi.org/10.1016/j.enpol.2013.04.055.
- Andersen, M. M. 1999. Trajectory Change Through Interorganisational Learning. On the Economic Organisation of the Greening of Industry (PhD. Series). Copenhagen: Copenhagen Business School.
- Andersen, M. M. 2001. “Organising Interfirm Learning – Towards a Dynamic Institutional Economic Framework for the Greening of Industry.” Okologisches Wirtschaften 2: 23–26.
- Andersen, M. M. 2008. Eco-innovation - Towards a Taxonomy and a Theory. DRUID Conference Entrepreneurship and Innovation. http://www2.druid.dk/conferences/viewpaper.php?id=3150&cf=29.
- Andersen, M. M. 2009. Combating Climate Change Through Eco-innovation – Towards the Green Innovation System. In Innovative Economic Policies for Climate Change Mitigation. 1st ed., 37–58. Lulu.com.
- Andersen, M. M. 2016. The Sustainable Development Goals–Pathways to Eco-innovation and a Global Green Economy? Globelics Conference 2016.
- Barasa, P. W., G. S. Namusonge, and M. A. Iravo. 2015. “Contributions of Green Supply Chain Management Practice on Performance of Steel Manufacturing Companies in Kenya.” Journal of Developing Country Studies 5 (19): 44–52.
- Berrone, P., A. Fosfuri, L. Gelabert, and L. R. Gomez-Mejia. 2013. “Necessity as the Mother of ‘Green’ Inventions: Institutional Pressures and Environmental Innovations.” Strategic Management Journal 34 (8): 891–909. https://doi.org/https://doi.org/10.1002/smj.
- Brahmbhatt, M., C. Haddaoui, and J. Page. 2017. “Green Industrialisation and Entrepreneurship in Africa.” Contributing paper for African Economic Outlook 2017: Entrepreneurship and Industrialisation, 1–60. Washington, DC: New Climate Economy.
- Brunnermeier, S. B., and M. A. Cohen. 2003. “Determinants of Environmental Innovation in US Manufacturing Industries.” Journal of Environmental Economics and Management 45 (2): 278–293. https://doi.org/https://doi.org/10.1016/S0095-0696(02)00058-X.
- Cai, W., and X. L. Zhou. 2014. “On the Drivers of Eco-innovation: Empirical Evidence from China.” Journal of Cleaner Production 79: 239–248. https://doi.org/https://doi.org/10.1016/j.jclepro.2014.05.035.
- Collier, P., and A. J. Venables. 2012. “Greening Africa? Technologies, Endowments and the Latecomer Effect.” Energy Economics 34: S75–S84.
- Dangelico, R. M., and D. Pujari. 2010. “Mainstreaming Green Product Innovation: Why and How Companies Integrate Environmental Sustainability.” Journal of Business Ethics 95 (3): 471–486. https://doi.org/https://doi.org/10.1007/s10551-010-0434-0.
- del Río, P., C. Peñasco, and D. Romero-Jordán. 2016. “What Drives Eco-innovators? A Critical Review of the Empirical Literature Based on Econometric Methods.” Journal of Cleaner Production 112: 2158–2170. https://doi.org/https://doi.org/10.1016/j.jclepro.2015.09.009.
- Desmond, P., and M. Asamba. 2019. “Accelerating the Transition to a Circular Economy in Africa: Case Studies from Kenya and South Africa.” In The Circular Economy and the Global South, edited by P. Schröder, M. Anantharaman, K. Anggraeni, & T. J. Foxon, 152–172. London: Routledge.
- Doranova, A., L. Roman, B. Bahn-Walkowiak, H. Wilts, M. O'Brien, S. Giljum, M.A. Kong, and M. Hestin. 2016. Policies and Practices for Eco-innovation up-take and Circular Economy Transition. Eco-Innovation Observatory Bi-Annual Report. Brussels: European Commission.
- Eco-innovation Observatory. 2012. Methodological Report.
- Ellen MacArthur Foundation. 2013. Towards the Circular Economy. In Towards the Circular Economy. https://doi.org/https://doi.org/10.1162/108819806775545321.
- European Commission. 2018. Flash Eurobarometer 456 Report SMEs, resource efficiency and green markets. https://data.europa.eu/euodp/en/data/dataset/S2151_456_ENG.
- Evans, E., O. Opoku, I. Kit, and M. Yan. 2019. “Industrialization as Driver of Sustainable Economic Growth in Africa.” The Journal of International Trade & Economic Development 28 (1): 30–56. doi:https://doi.org/10.1080/09638199.2018.1483416.
- Faria, L. G. D., and M. M. Andersen. 2017a. “Sectoral Dynamics and Technological Convergence: An Evolutionary Analysis of Eco-innovation in the Automotive Sector.” Industry and Innovation 24: 8–40. https://doi.org/https://doi.org/10.1080/13662716.2017.1319801.
- Faria, L. G. D., and M. M. Andersen. 2017b. “Sectoral Patterns Versus Firm-level Heterogeneity – The Dynamics of Eco-innovation Strategies in the Automotive Sector.” Technological Forecasting and Social Change 117. doi:https://doi.org/10.1016/j.techfore.2016.11.018.
- Freeman, C. 1979. The determinants of innovation: Market demand, technology, and the response to social problems. Futures, June, 206–215. http://www.sciencedirect.com/science/article/pii/0016328779901101.
- Geng, Y., J. Sarkis, S. Ulgiati, and P. Zhang. 2013. “Measuring China’s Circular Economy.” Science, https://doi.org/https://doi.org/10.1126/science.1227059.
- Ghisellini, P., C. Cialani, and S. Ulgiati. 2016. “A Review on Circular Economy: The Expected Transition to a Balanced Interplay of Environmental and Economic Systems.” Journal of Cleaner Production 114: 11–32. https://doi.org/https://doi.org/10.1016/J.JCLEPRO.2015.09.007.
- Ghisetti, C., and F. Quatraro. 2017. “Green Technologies and Environmental Productivity: A Cross-sectoral Analysis of Direct and Indirect Effects in Italian Regions.” Ecological Economics 132: 1–13. https://doi.org/https://doi.org/10.1016/J.ECOLECON.2016.10.003.
- González-Benito, J., and Ó González-Benito. 2006. “A Review of Determinant Factors of Environmental Proactivity.” Business Strategy and the Environment 15 (2): 87–102. https://doi.org/https://doi.org/10.1002/bse.450.
- Government of Kenya. 2007. Kenya Vision 2030. National Economic and Social Council of Kenya. Nairobi: Office of the President.
- Government of Kenya. 2016. Green Economy Strategy and Implementation Plan – Kenya 2016-2030. Nairobi: Office of the President.
- Government of Kenya. 2018. National Climate Change Action Plan (Kenya) 2018-2022. Nairobi: Office of the President.
- Gower, R., and P. Schröder. 2016. Virtuous Circle: How the Circular Economy Can Create Jobs and Save Lives in Low and Middle-income Countries. London: IDS/Tearfund.
- Gramkow, C., and A. Anger-Kraavi. 2019. “Developing Green: A Case for the Brazilian Manufacturing Industry.” Sustainability 11 (23): 6783. https://doi.org/https://doi.org/10.3390/su11236783.
- Gregson, N., M. Crang, S. Fuller, and H. Holmes. 2015. “Interrogating the Circular Economy: The Moral Economy of Resource Recovery in the EU.” Economy and Society 44 (2): 218–243. https://doi.org/https://doi.org/10.1080/03085147.2015.1013353.
- Hamdok, A. 2015. “The Green Economy and Africa’s Economic Transformation: A Balancing Act.” Journal of African Transformation 1 (1): 85–100.
- Hertin, J., F. Berkhout, M. Wagner, and D. Tyteca. 2008. “Are EMS Environmentally Effective? The Link Between Environmental Management Systems and Environmental Performance in European Companies.” Journal of Environmental Planning and Management 51 (2): 259–283.
- Hojnik, J., and M. Ruzzier. 2015. “What Drives Eco-innovation? A Review of an Emerging Literature.” Environmental Innovation and Societal Transitions. https://doi.org/https://doi.org/10.1016/j.eist.2015.09.006.
- Huq, S. 2011. “Climate and Energy.” Review of Policy Research 28 (5): 495–500.
- Jordaan, A. 2017. “Building Resilience in Africa Through Transformation and a Green Economy: Challenges and Opportunities.” In Rethinking Resilience, Adaptation and Transformation in a Time of Change, edited by Wanglin Yan and Will Galloway, 299–318. London: Springer.
- Kabubo-Mariara, J., and F. K. Karanja. 2007. “The Economic Impact of Climate Change on Kenyan Crop Agriculture: A Ricardian Approach.” Global and Planetary Change. https://doi.org/https://doi.org/10.1016/j.gloplacha.2007.01.002.
- Kalmykova, Y., M. Sadagopan, and L. Rosado. 2018. “Circular Economy – from Review of Theories and Practices to Development of Implementation Tools.” Resources, Conservation and Recycling 135: 190–201. https://doi.org/https://doi.org/10.1016/J.RESCONREC.2017.10.034.
- Kemp, René. 2010. “Eco-Innovation: Definition, Measurement and Open Research Issues.” Economia Politica 27 (3): 397–420. https://doi.org/https://doi.org/10.1428/33131.
- Kemp, René, and L. Soete. 1992. “The Greening of Technological Progress: An Evolutionary Perspective.” Futures 24 (5): 437–457. https://doi.org/https://doi.org/10.1016/0024-6301(93)90300-5.
- Kesidou, E., and P. Demirel. 2012. “On the Drivers of Eco-innovations: Empirical Evidence from the UK.” Research Policy 41 (5): 862–870. https://doi.org/https://doi.org/10.1016/j.respol.2012.01.005.
- Kihiko, M. K., and M. W. Kinoti. 2016. “The Business Case for Climate Change: The Impact of Climate Change on Kenya’s Public Listed Companies.” In Climate Change and the 2030 Corporate Agenda for Sustainable Development (Advances in Sustainability and Environmental Justice). Vol. 19, 133–157. Emerald Group Publishing Limited. https://doi.org/https://doi.org/10.1108/S2051-503020160000019007
- Kiongera, F. N. 2003. Green Marketing Practices in Cement Industry in Kenya. Unpublished MBA. University of Nairobi, Kenya.
- Koech, M. K., and K. J. Munene. 2020. “Circular Economy in Kenya.” In Circular Economy: Global Perspective, edited bySadhan Kumar Ghosh, 223–239. Singapore: Springer.
- Kollman, K., and A. Prakash. 2001. “Green by Choice? Cross-national Variations in Firms’ Responses to EMS-based Environmental Regimes.” World Politics 53 (3): 399–430.
- Lewandowski, M. 2016. “Designing the Business Models for Circular Economy—Towards the Conceptual Framework.” Sustainability 8 (1): 43. https://doi.org/https://doi.org/10.3390/su8010043.
- Lieder, M., and A. Rashid. 2016. “Towards Circular Economy Implementation: A Comprehensive Review in Context of Manufacturing Industry.” Journal of Cleaner Production 115: 36–51. https://doi.org/https://doi.org/10.1016/J.JCLEPRO.2015.12.042.
- Linder, M., and M. Williander. 2017. “Circular Business Model Innovation: Inherent Uncertainties.” Business Strategy and the Environment 26 (2): 182–196. https://doi.org/https://doi.org/10.1002/bse.1906.
- Mainali, B., J. Luukkanen, S. Silveira, and J. Kaivo-oja. 2018. “Evaluating Synergies and Trade-offs among Sustainable Development Goals (SDGs): Explorative Analyses of Development Paths in South Asia and Sub-Saharan Africa.” Sustainability 10 (3): 815.
- Malerba, Franco. 2002. “Sectoral Systems of Innovation and Production.” Research Policy 31 (2): 247–264. https://doi.org/https://doi.org/10.1016/S0048-7333(01)00139-1.
- Mathews, J. A. 2017. Global Green Shift When Ceres Meets Gaia. London: Anthem Press.. www.anthempress.com.
- Mazzanti, M., and R. Zoboli. 2006. Examining the Factors Influencing Environmental Innovations. In FEEM Working Paper No. 20.2006. https://doi.org/https://doi.org/10.2139/ssrn.879721.
- Messner, D. 2016. “Building a Low-carbon Society–Learning from the Past.” In The Rise of the Green Economies. Vol. 31, edited by A. Carius, D. Tänzler, and E. Semmling, 31–46. Munich: Oekom.
- Mungai, S., and H. Samuel. 2009. An Investigation of Green Marketing Practices among Pharmaceutical Firms in Kenya. Unpublished MBA Project.
- Nascimento, Daniel Luiz Mattos, Viviam Alencastro, Osvaldo Luiz Gonçalves Quelhas, Rodrigo Goyannes Gusmão Caiado, Jose Arturo Garza-Reyes, Luis Rocha-Lona, and Guilherme Tortorella. 2019. “Exploring Industry 4.0 Technologies to Enable Circular Economy Practices in a Manufacturing Context.” Journal of Manufacturing Technology Management 30 (3): 607–627. https://doi.org/https://doi.org/10.1108/JMTM-03-2018-0071.
- Nawrocka, D., and T. Parker. 2009. “Finding the Connection: Environmental Management Systems and Environmental Performance.” Journal of Cleaner Production 17 (6): 601–607.
- Nelson, R. R., and S. G. Winter. 1982. An Evolutionary Theory of Economic Change. London: The Belknap Press/Harvard University Press. https://doi.org/https://doi.org/10.2307/2232409.
- Ngui-Muchai, D. M., and J. M. Muniu. 2012. “Firm Efficiency Differences and Distribution in the Kenyan Manufacturing Sector.” African Development Review 24 (1): 52–66.
- Njoroge Irene, W., M. Irandu Evaristus, and M. Moronge James. 2017. “An Assessment of the Impacts of Cleaner Production Implementation in Manufacturing Industries in Nairobi Kenya.” International Journal of Education and Research 5 (7): 173–186.
- Nkwachukwu, O., C. Chima, A. Ikenna, and L. Albert. 2013. “Focus on Potential Environmental Issues on Plastic World Towards a Sustainable Plastic Recycling in Developing Countries.” International Journal of Industrial Chemistry 4 (1): 34. https://doi.org/https://doi.org/10.1186/2228-5547-4-34.
- OECD. 2009. Sustainable Manufacturing and Eco-innovation: Framework, Practices and Measurement. https://doi.org/https://doi.org/10.1177/0022146512457153.
- Oltra, V., and M. Saint Jean. 2009. “Sectoral Systems of Environmental Innovation: An Application to the French Automotive Industry.” Technological Forecasting and Social Change 76 (4): 567–583. https://doi.org/https://doi.org/10.1016/j.techfore.2008.03.025.
- Park, M. S., R. Bleischwitz, K. J. Han, E. K. Jang, and J. H. Joo. 2017. “Eco-innovation Indices as Tools for Measuring Eco-innovation.” Sustainability (Switzerland) 9 (12), https://doi.org/https://doi.org/10.3390/su9122206.
- Pavitt, K. 1984. “Sectoral Patterns of Technical Change: Towards a Taxonomy and a Theory.” Research Policy 13 (6): 343–373. https://doi.org/https://doi.org/10.1016/0048-7333(84)90018-0.
- Porter, M. E., and C. van der Linde. 1995. “Toward a New Conception of the Environment-Competitiveness Relationship.” Journal of Economic Perspectives 9 (4): 97–118. https://doi.org/https://doi.org/10.1257/jep.9.4.97.
- Rehfeld, K.-M., K. Rennings, and A. Ziegler. 2007. “Integrated Product Policy and Environmental Product Innovations: An Empirical Analysis.” Ecological Economics 61 (1): 91–100. https://doi.org/https://doi.org/10.1016/j.ecolecon.2006.02.003.
- Reike, D., W. J. V. Vermeulen, and S. Witjes. 2018. “The Circular Economy: New or Refurbished as CE 3.0? – Exploring Controversies in the Conceptualization of the Circular Economy Through a Focus on History and Resource Value Retention Options.” Resources, Conservation and Recycling 135: 246–264. https://doi.org/https://doi.org/10.1016/J.RESCONREC.2017.08.027.
- Rosati, F., and L. G. D. Faria. 2019. “Addressing the SDGs in Sustainability Reports: The Relationship with Institutional Factors.” Journal of Cleaner Production 215. https://doi.org/https://doi.org/10.1016/j.jclepro.2018.12.107.
- Sampath, P. G. 2016. “Sustainable Industrialization in Africa: Toward a New Development Agenda.” In Sustainable Industrialization in Africa, edited by P. G. Sampath and B. Oyelaran-Oyeyinka, 1–19. London: Palgrave Macmillan.
- Schmitz, H., O. Johnson, and T. Altenburg. 2015. “Rent Management – The Heart of Green Industrial Policy.” New Political Economy 20 (6): 812–831. https://doi.org/https://doi.org/10.1080/13563467.2015.1079170.
- Soezer, A. 2016. Nationally Appropriate Mitigation Action on a Circular Economy Solid Waste Management Approach For Urban Areas In Kenya. http://www.undp.org/content/dam/undp/library/Environment and Energy/MDG Carbon Facility/NAMA Report Kenya Waste FNL_July.pdf.
- UNEP. 2014. Green Economy Assessment Report – Kenya.
- UNEP/ILO/IOE/ITUC. 2008. Green Jobs: Towards Decent Work in a Sustainable, Low-Carbon World. Nairobi: United Nations.
- United Nations. 2016. Greening Africa’s Industrialization.
- United Nations. 2011. Working Towards a Balanced and Inclusive Green Economy: A United Nations System-wide Perspective. Prepared by the Environment Management Group. Geneva: United Nations.
- Urbinati, A., D. Chiaroni, and V. Chiesa. 2017. “Towards a New Taxonomy of Circular Economy Business Models.” Journal of Cleaner Production 168: 487–498. https://doi.org/https://doi.org/10.1016/J.JCLEPRO.2017.09.047.
- Wabwoba, F., G. W. Wanyembi, and S. Omuterema. 2012. “Barriers to Implementation of Green ICT in Kenya.” International Journal of Science and Technology 2: 823–836.
- Were, A. 2016. “Manufacturing in Kenya. Features, Challenges and Opportunities.” International Journal of Science, Management and Engineering 4 (6): 15–26.
- Winans, K., A. Kendall, and H. Deng. 2017. “The History and Current Applications of the Circular Economy Concept.” Renewable and Sustainable Energy Reviews 68: 825–833. https://doi.org/https://doi.org/10.1016/J.RSER.2016.09.123.