Abstract
This study was conducted to investigate the short-term effect of thinning on the carbon (C) storage of soil, forest floor and coarse woody debris (CWD) in a Quercus spp. stand in Hoengseong, Gangwon-do, Korea. Thinning was conducted in March 2010 with different thinning intensities based on the removed volume in each plot: no thinning (control, 0%), light thinning (L, 15%), moderate thinning (M, 20%), and heavy thinning (H, 35%). We measured the C storage at four different depths ranging from 0–50 cm, on the forest floor and in CWD four months after thinning in July 2010. The total C storage (Mg C ha−1) in soil, forest floor and CWD of L was significantly lower than that of the three other plots at an early stage of thinning: 38.5 for control, 31.1 for L, 40.6 for M and 45.8 for H. Further long-term monitoring will be needed to observe the total C storage in soil, forest floor and CWD in this study stand because the total C storage with different thinning intensities might vary temporally.
Introduction
The rising atmospheric carbon dioxide (CO2) concentration is known to be closely related with global warming and is a particular concern because of the important role of CO2 in climate change (Vitousek Citation1991; Keeling et al. Citation1995). The international community has therefore shown increasing interest in carbon (C) cycles in forest ecosystems due to the role of forests as CO2 sinks in the global C cycle (Jandl et al. Citation2007; Wang et al. Citation2009). Forest ecosystems act as natural stores of C, by contributing approximately 90% of terrestrial aboveground and 40% of terrestrial belowground C storage (Waring and Schlesinger Citation1985). Especially, soil, forest floor and coarse woody debris (CWD) constitute large C pools of terrestrial belowground C storage (Johnson et al. Citation2003; Peichl and Arain Citation2006).
Many studies have reported that forest management practices may affect C dynamics (Johnson Citation1992; Son et al. Citation2004a; Kim et al. Citation2009) and alter C storage in forest ecosystems (Birdsey et al. Citation2006; Powers et al. Citation2011). Thinning improves the growth conditions of remaining trees (Balboa-Murias et al. Citation2006), affects stand conditions and soil environmental factors such as soil moisture and temperature (Kim et al. Citation2009), and thus influences forest C storage, dynamics and cycling (Covington Citation1981; Nilsen and Strand Citation2008; Kim et al. Citation2009). However, most Korean studies have focused on changes of biomass in aboveground C storage and soil properties after thinning (Lee et al. Citation2005; Hwang et al. Citation2008).
Broad-leaved forests occupy more than 26% (1,657,000 ha) of the total forest area of Korea (Korea Forest Service Citation2010), with Quercus spp. being the most dominant broad-leaved species in the region. However, little research has been conducted to investigate the C storage of soil, forest floor and CWD in Quercus spp. forests after thinning in Korea. This study was performed in Quercus spp. stand dominated by Quercus mongolica and Q. variabilis due to their high economic value and wide distribution (Son et al. Citation2004b). The objective of this study was to investigate changes in the total C storage of soil, forest floor and CWD shortly after thinning in Quercus spp. stand in Gangwon-do.
Materials and methods
Study stand
The study stand was located in a natural forest of Q. variabilis and Q. mongolica in Hoengseong, Gangwon-do (37°29′34″N, 127°50′00″E) and was thinned in March 2010. The altitude of the study stand was 340 m at a slope of 27–36° and the stand age was 41–50 years old. The study stand was divided into four plots (314 m2 per plot) by different thinning intensities based on removed volume: no thinning (control, 0%), light thinning (L, 15%), moderate thinning (M, 20%), and heavy thinning (H, 35%) (). The trees for removal were firstly selected among suppressed and inferior trees and from low volumes to high volumes until the thinning intensities were met. Dominant understory species were Lindera obtusiloba, Prunus sargentii and Rhus trichocarpa. The annual average precipitation and air temperature from 2005 to 2009 year were 1,321 mm and 11.0°C (Korea Meteorological Administration Citation2010), respectively.
Table 1. Changes in the characteristics of the study stand after thinning.
Sampling and analysis
Soil, forest floor and CWD samples were collected after thinning in July 2010. Five soil samples per plot were randomly collected within each plot at soil depths of 0–10 cm, 10–20 cm, 20–30 cm and 30–50 cm using a 10 cm-long cylindrical metal corer (406.94 cm3). Soil samples were air-dried and sieved with 2 mm mesh screen (US standard No. 10) to separate out the coarse rock (larger than 2 mm). More detailed sampling and analysis methods are provided in Yang et al. (Citation2011).
Statistical analysis
Differences in soil properties (soil water content [SWC], soil pH, bulk density and coarse rock content) and C concentration and C storage of soil, forest floor and CWD with different thinning intensities were analyzed using ANOVA procedure. Duncan's multiple range test (P < 0.05) was used to separate the means. All statistical analyses were conducted using SAS 9.2 software (SAS Institute Inc., Citation2009).
Results and discussion
Soil properties
The mean SWC of all four different depth samples from 0–50 cm with different thinning intensities was 22.0% for control, 16.0% for L, 27.1% for M and 20.0% for H (a). The SWC in M was significantly higher than that in the other plots due to the decreased water absorption by individual trees in the thinned plots and the increased inflow of precipitation after thinning. The SWC value in H lower than that in M was mainly due to the similar stand density and basal area with M. The other research reported that SWC values after thinning were higher than those of the control (Kim et al. Citation2009; Bae et al. Citation2010). The mean SWCs according to soil depth were significantly different in all plots except for M (). The lack of difference in the SWC of M was partly attributed to the lack of any significant difference in the soil C concentration at 10–20 cm and 20–30 cm in M (). Brady and Weil (Citation2008) reported that SWC was significantly affected by factors such as aspect, slope, stand density, development of litter and soil organic matter.
Figure 1. Soil water content (SWC) (a) and soil pH (b) with different thinning intensities at each soil depth. Figures denoted with different letters indicate significant differences among thinning intensities (P < 0.05). Vertical bars are standard errors.
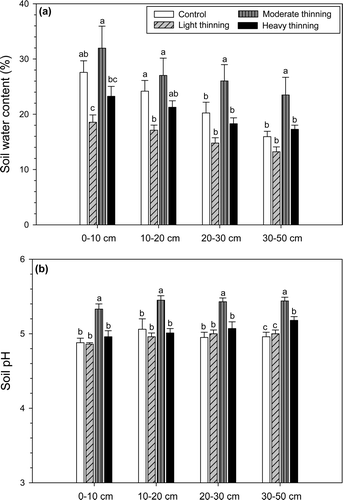
Table 2. Soil water content (SWC) at each soil depth after thinning. Figures denoted with different letters indicate significant differences among soil depths in each thinning plot (P < 0.05).
Table 3. Carbon concentration and storage of soil with different thinning intensities at each soil depth. The small letters indicate differences among thinning intensities within the same soil depth, and the large letters indicate differences among soil depths within each plot (P < 0.05). The values in parentheses are standard errors.
The mean soil pH with different thinning intensities was 4.96 for control, 4.96 for L, 5.41 for M and 5.06 for H (b). The soil pH in M was significantly higher than that in the other plots. Kim et al. (Citation2009) reported that soil pH following thinning in Pinus densiflora forest increased after 2 years, possibly because of accelerated decomposition of organic matter. However, Hwang and Son (Citation2006) reported that changes in soil pH occurred at 3–4 years after thinning in a pitch pine forest. In our study, the time elapsed after thinning was too short to detect any consistent changes in soil pH.
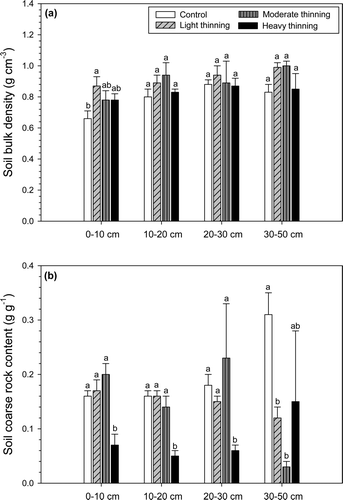
The mean soil bulk density (g cm−3) of all four different depth samples from 0–50 cm with different thinning intensities was 0.76 for control, 0.92 for L, 0.90 for M and 0.83 for H (a). The only significant difference was the soil bulk density of 0–10 cm in the control was significantly lower than that in the other plots. The lower soil bulk density in the control may have been due to compaction and disturbance by thinning operations. The mean coarse rock content (g g−1) of all four different depth samples from 0–50 cm with different thinning intensities was 0.20 for control, 0.15 for L, 0.15 for Mt and 0.08 for H (b). The soil coarse rock content in the H was significantly lower than that in the other plots, while Kim et al. (Citation2009) reported that clear changes in soil bulk density and coarse rock content occurred at 3–4 years after thinning.
Figure 2. Soil bulk density (a) and coarse rock content (b) with different thinning intensities at each soil depth. Figures denoted with different letters indicate significant differences among thinning intensities (P < 0.05). Vertical bars are standard errors.
Carbon storage of soil, forest floor and coarse woody debris (CWD)
The soil C concentration (%) at the four different depths of 0–50 cm and different thinning intensities ranged from 0.34 to 2.44 for control, 0.24 to 1.60 for L, 0.25 to 1.89 for M and 0.51 to 2.28 for H (). The soil C concentration in L was lower than that in the other plots. Our soil C concentration values were similar to those of 2.76% at 0–10 cm, 1.76% at 10–20 cm and 1.37% at 20–30 cm reported by Son et al. (Citation2004b) in a 33-year-old Q. variabilis and Q. mongolica stand in Gwangju, Gyeonggi-do. However, our values were lower than those of 6.11% at 0–10 cm, 2.14% at 10–20 cm and 1.40% at 20–30 cm reported by Lee et al. (Citation2009) in a 45-year-old Q. mongolica stand in Hoengseong, Gangwon-do. Previous research reported that the soil C concentration of the thinned plot was higher than that of the control plot because the organic input to soil surface increases after thinning (Peichl and Arain Citation2006; Nilsen and Strand Citation2008). The soil C concentration in the surface soil is higher than that in the deeper layers because of organic matter such as litterfall, and litter decomposition input of C to the soil (Son et al. Citation2004a; Wang et al. Citation2009).
The mean soil C storage (Mg C ha−1) of all four different depth samples from 0–50 cm with different thinning intensities was 33.7 for control, 25.7 for L, 30.4 for M and 39.5 for H (). The soil C storage in H was higher than that in the other plots because the SWC and soil coarse rock content for H was lower than that in the other plots. The soil C storage of 0–10 cm was significantly higher than that in the other depths (), which was possibly due to the higher soil bulk density of the top soil in the thinned plots compared with the control. Yanai et al. (Citation2003) reported that the top soil C storage was higher than that at lower depths because the soil C concentration was higher due to the organic matter input in the soil surface after thinning. The soil C storage of our study was similar to that of 33.3 Mg C ha−1 (0–30 cm depth) reported by Lee et al. (Citation2009) for a 45-year-old Q. mongolica stand in Hoengseong, Gangwon-do, but was higher than that of 26.2 Mg C ha−1 (0–30 cm depth) reported by Son et al. (Citation2007) for a 33-year-old Q. variabilis and Q. mongolica stand in Gwangju, Gyeonggi-do because of lower soil sampling depth and stand age compared with our study.
The mean C concentration (%) and C storage (Mg C ha−1) of the forest floor with different thinning intensities were 43.5 and 4.2 for control, 45.8 and 4.3 for L, 45.1 and 6.2 for M and 46.4 and 4.6 for H (). The forest floor C concentration in H was higher than that in the control. However, the forest floor C storage in M was higher than that in the other plots because the dry weight of the forest floor in M was significantly higher than that in the other plots (). The forest floor C storage after thinning can be increased due to increasing logging residues, organic matter decomposition rate and leaf and wood litter input (Covington Citation1981; Kim et al. Citation2009), or decreased due to the effect of harvesting machines in disturbing the forest floor (Yanai et al. Citation2003). In our study, the time elapsed after thinning was too short to detect any clear tendency in the forest floor C storage.
Table 4. Carbon concentration and storage of forest floor and coarse woody debris (CWD) with different thinning intensities. Figures denoted with different letters indicate significant differences among thinning intensities (P < 0.05). The values in parentheses are standard errors.
The mean C concentration (%) and C storage (Mg C ha−1) of CWD with different thinning intensities were 48.9 and 0.6 for control, 47.4 and 1.1 for L, 48.2 and 20.3 for M and 47.9 and 1.3 for H (). The CWD C storage of the thinned plots was higher than that of the control because the logging residues were not removed after thinning (Peichl and Arain Citation2006). The CWD C storage in M was the highest among the three thinned plots because the CWD dry weight was the heaviest in M.
Total carbon storage
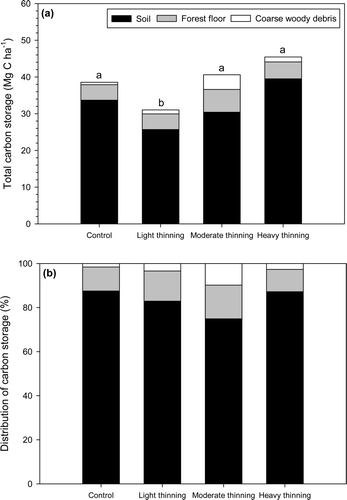
The total C storage (Mg C ha−1) of soil, forest floor and CWD with different thinning intensities was 38.5 for control, 31.1 for L, 40.6 for M and 45.8 for H (a). The total C storage in L was significantly lower than that in the other plots because the soil C concentration in L was much lower than that in the other plots. The proportion in soil (82.9%) to total C storage was higher than that in the forest floor (12.6%) and CWD C storage (4.5%) (b). This result was similar to the proportion in the soil (74.2%) and CWD C storage (3.8%), and lower than the proportion in the forest floor C storage (22.0%), reported by Lee et al. (Citation2009) for a 45-year-old Q. mongolica stand. We considered soil to be one of the most important components of change in the total C storage after thinning because the soil C storage was the largest of the components of the total C storage. In general, the soil C storage constituted a larger proportion of the total C storage along with the thinning intensity (Skovsgaard et al. Citation2006; Powers et al. Citation2011).
Figure 3. Carbon storage (a) and distribution of carbon storage (b) in soil, forest floor and coarse woody debris (CWD) in Quercus spp. stand with different thinning intensities. Figures denoted with different letters indicate significant differences in total C storage among thinning intensities (P < 0.05).
Although thinning often reduces the soil C storage, the total impacts on the soil C storage are more variable and highly influenced by soil chemistry and physical properties (Nave et al. Citation2010). Thinning has been shown to increase (Kim et al. Citation2009; Powers et al. Citation2011) or decrease (Nilsen and Strand Citation2008) the total C storage over time according to the thinning practice and thinning intensities. Our results were not conclusive as to the influence of thinning on the total C storage with different thinning intensities. We speculated that the elapsed time after thinning was too short to detect any consistent changes in the total C storage of soil, forest floor and CWD with different thinning intensities because the changes of the total C storage may vary annually (McHenry et al. Citation2006). Although our study was performed four months after thinning, further long-term monitoring will be needed to clarify the changes of the total C storage in soil, forest floor and CWD in this study stand because the total C storage after thinning may change over time.
Acknowledgment
This work was supported by Forest Practice Research Center, Korea Forest Research Institute in 2010. We would like to give thanks to Wooyong Jo, Koong Yi and Jun-Mo Jeong for their assistance in the field and laboratory.
References
- Bae , S W , Hwang , J , Lee , S T , Kim , H S and Jeong , J M . 2010 . Changes in soil temperature, moisture content, light availability and diameter growth after thinning in Korean pine (Pinus koraiensis) plantation . J Korean For Soc. , 99 : 397 – 403 . (in Korean with English abstract)
- Balboa-Murias , M A , Rodríguez-Soalleiro , R , Merino , A and Álvarez-González , J G . 2006 . Temporal variations and distribution of carbon stocks in aboveground biomass of radiata pine and maritime pine pure stands under different silvicultural alternatives . For Ecol Manage , 237 : 29 – 38 .
- Birdsey , R , Pregitzer , K and Lucier , A . 2006 . Forest carbon management in the United States: 1600–2100 . J Environ Qual , 35 : 1461 – 1469 .
- Brady , N C and Weil , R R . 2008 . The nature and properties of soils , Upper Saddle River , NJ : Prentice Hall .
- Covington , W W . 1981 . Changes in forest floor organic matter and nutrient content following clear-cutting in northern hardwoods . Ecology , 62 : 41 – 48 .
- Hwang , J , Bae , S W , Lee , K J , Lee , K S and Kim , H S . 2008 . Short-term effect of thinning on aboveground carbon storage in Korean pine (Pinus koraiensis) plantation . J Korean For Soc. , 97 : 605 – 610 . (in Korean with English abstract)
- Hwang , J and Son , Y . 2006 . Short-term effects of thinning and liming on forest soils of pitch pine and Japanese larch plantations in central Korea . Ecol Res , 21 : 671 – 680 .
- Jandl , R , Lindner , M , Vesterdal , L , Bauwens , B , Baritz , R , Hagedorn , F , Johnson , D W , Minkkinen , K and Byrne , K A . 2007 . How strongly can forest management influence soil carbon sequestration? . Geoderma , 137 : 253 – 268 .
- Johnson , D W . 1992 . Effects of forest management on soil carbon storage . Water Air Soil Pollut , 64 : 83 – 120 .
- Johnson , D W , Todd , DE Jr and Tolbert , V R . 2003 . Changes in ecosystem carbon and nitrogen in a loblolly pine plantation over the first 18 years . Soil Sci Soc Am J , 67 : 1594 – 1601 .
- Keeling , C D , Whorf , T P , Wahlen , M and Van der Plicht , J. 1995 . Interannual extremes in the rate of rise of atmospheric carbon dioxide since 1980 . Nature , 375 : 666 – 670 .
- Kim , C , Son , Y , Lee , W K , Jeong , J and Noh , N J . 2009 . Influence of forest tending works on carbon distribution and cycling in a Pinus densiflora S. et Z. stand in Korea . For Ecol Manage , 257 : 1420 – 1426 .
- Korea Forest Service . 2010 . Statistical yearbook of forestry , Korea Forest Service . (in Korean)
- Korea Meteorological Administration . 2010 . Annual climatological report , Seoul : Korea Meteorological Administration . (in Korean)
- Lee , S K , Son , Y , Noh , N J , Heo , S J , Yoon , T K , Lee , A R , Razak , S A and Lee , W K . 2009 . Carbon storage of natural pine and oak pure and mixed forests in Hoengseong, Kangwon . J Korean For Soc , 98 : 772 – 779 . (in Korean with English abstract)
- Lee , S T , Son , Y M , Lee , K J , Hwang , J , Choi , J C , Shin , H C and Park , N C . 2005 . Aboveground carbon storage of Quercus acuta stands by thinning intensity . Korean J Agric For Meteorol , 7 : 282 – 288 . (in Korean with English abstract)
- McHenry , M T , Wilson , B R , Lemon , J M , Donnelly , D E and Growns , I G . 2006 . Soil and vegetation response to thinning white cypress pine (Callitris glaucophylla) on the north western slopes of New South Wales, Australia . Plant Soil , 285 : 245 – 255 .
- Nave , L E , Vance , E D , Swanston , C W and Curtis , P S . 2010 . Harvest impacts on soil carbon storage in temperate forests . For Ecol Manage , 259 : 857 – 866 .
- Nilsen , P and Strand , L T . 2008 . Thinning intensity effects on carbon and nitrogen stores and fluxes in a Norway spruce (Picea abies (L.) Karst.) stand after 33 years . For Ecol Manage , 256 : 201 – 208 .
- Peichl , M and Arain , M A . 2006 . Above- and belowground ecosystem biomass and carbon pools in an age-sequence of temperate pine plantation forests . Agric For Meteorol , 140 : 51 – 63 .
- Powers , M , Kolka , R , Palik , B , McDonald , R and Jurgensen , M . 2011 . Long-term management impacts on carbon storage in Lake States forests . For Ecol Manage , 262 : 424 – 431 .
- SAS Institute Inc . 2009 . SAS/STAT user guide. Release 9.2 , Cary , NC : SAS Institute Inc .
- Skovsgaard , J P , Stupak , I and Vesterdal , L . 2006 . Distribution of biomass and carbon in even-aged stands of Norway spruce (Picea abies (L.) Karst): a case study on spacing and thinning effects in northern Denmark . Scan J Forest Res , 21 : 470 – 488 .
- Son , Y , Jun , Y C , Lee , Y Y , Kim , R H and Yang , S Y . 2004a . Soil carbon dioxide evolution, litter decomposition, and nitrogen availability four years after thinning in a Japanese larch plantation . Comm Soil Sci Plant Analys , 35 : 1111 – 1122 .
- Son , Y , Kim , D Y , Park , I H , Yi , M J and Jin , H O . 2007 . Production and nutrient cycling of oak forests in Korea: A case study of Quercus mongolicaand Q. variabilisstands , Kangwon National University . (in Korean)
- Son , Y , Park , I H , Yi , M J , Jin , H O , Kim , D Y , Kim , R H and Hwang , J O . 2004b . Biomass, production and nutrient distribution of a natural oak forest in central Korea . Ecol Res , 19 : 21 – 28 .
- Vitousek , P M . 1991 . Can planted forests counteract increasing atmospheric carbon dioxide? . J Environ Qual , 20 : 348 – 354 .
- Wang , Q , Wang , S and Zhang , J . 2009 . Assessing the effects of vegetation types on carbon storage fifteen years after reforestation on a Chinese fir site . For Ecol Manage , 258 : 1437 – 1441 .
- Waring , R H and Schlesinger , W H . 1985 . Forest ecosystems; concepts and management , 340 pp New York : Academic Press .
- Yanai , R D , Currie , W S and Goodale , C G . 2003 . Soil carbon dynamics after forest harvest: an ecosystem paradigm reconsidered . Ecosystems , 6 : 197 – 212 .
- Yang , A R , Son , Y , Noh , N J , Lee , S K , Jo , W , Son , J A , Kim , C , Bae , S W , Lee , S T , Kim , H S and Hwang , J . 2011 . Effect of thinning on carbon storage in soil, forest floor and coarse woody debris of Pinus densiflora stands with different stand ages in Gangwon-do, central Korea . For Sci Technol , 7 : 30 – 37 .