Abstract
This study was conducted to examine the soil aggregate distributions and their relationship with microbial biomass carbon (C) concentration and soil C in Pinus rigida and Larix kaempferi plantations. Soil samples of 0–10 cm, 10–20 cm, and 20–30 cm depth were collected and the microbial biomass C concentration was measured. The soils were then classified into four aggregate size classes by wet-sieving procedure [large macroaggregate (>2000 μm), small macroaggregate (250–2000 μm), microaggregate (53–250 μm), and silt-plus-clay (<53 μm)] and the C content of each aggregate size class was analyzed. The L. kaempferi plantation contained more macroaggregate over 250 μm than the P. rigida plantation did. The mean weight diameter (MWD) of the soil aggregate up to 30 cm depth was 1.26 mm and 1.45 mm in the P. rigida and L. kaempferi plantations, respectively, and it decreased with soil depth. The microbial biomass C concentration up to 30 cm depth was 510 μg C g soil−1 for the P. rigida plantation and 764μg C g soil−1 for the L. kaempferi plantation, and it was greatest in the surface soil in both plantations. The mean soil C concentration up to 30 cm depth was 2.00% for the P. rigida plantation and 2.88% for the L. kaempferi plantation. In both plantations, the soil C concentration was higher in the surface soil than in the deep soil. However, there was no significant difference of C concentration among the soil aggregate size classes. The soil C content up to 30 cm depth in the P. rigida and L. kaempferi plantations were 47.69 Mg ha−1 and 61.49 Mg ha−1, respectively, and were also higher in the surface soil than in the deep soil. In both plantations, macroaggregate contained more Ccontent than microaggregate did. The microbial biomass C and soil C concentrations were significantly higher (P < 0.05) in the L. kaempferi plantation than in the P. rigida plantation due to the effect of species difference. The MWD and C content tended to be greater in the L. kaempferi plantation than in the P. rigida plantation, but the differences were not significant. In this study, the soil aggregate size, microbial biomass C and soil C concentrations were positively correlated with one another.
Introduction
Soil is one of the largest reservoirs of organic carbon (C) in terrestrial ecosystems and plays an important role in the global C cycle (Houghton Citation2007). C content in forest soil is especially important to understand global C dynamics because forests store approximately half of C in terrestrial ecosystems around the world, about two-third of which is contained in forest soil pools (Dixon et al. Citation1994; Lal Citation2005). In the forest ecosystem, soil has a higher potential to store C than vegetation (Swift Citation2001). Therefore, it is important to improve our understanding of the numerous factors that affect forest soil C, of which soil aggregate is one that determines soil organic C content (Six et al. Citation2002) because most of the soil organic C in surface soils is contained within aggregates (Jastrow et al. Citation1996). Studies on the relationship between soil aggregate and soil organic C have mainly focused on the influences of crop and tillage type in the agroecosystem, particularly on the role of C for sustainable productivity (Martins et al. Citation2009). Little research, however, has examined the soil aggregate distribution in forests.
The formation and stabilization of soil aggregate isrelated to microorganisms, soil fauna, plant roots, inorganic binding agents, and other environmental factors (Six et al. Citation2004). In soils under vegetation, roots and microorganisms like fungal hyphae are the major factors that stabilize macroaggregate (Oades and Waters Citation1991; Tisdall Citation1994). Soil microorganisms form and stabilize soil aggregates by creating organic binding agents such as polysaccharides (Harris et al. Citation1966; Tisdall and Oades Citation1982). Stabilized soil aggregate contains lots of sequestrated C in the aggregate, which enables long-term storage of C (Tisdall and Oades Citation1982). The stability of soil aggregate and soil C content are also influenced by different plant species, because of their different productivity, chemical composition of their litter, and physical characteristics in adjusting the microclimate (e.g. root distribution) (Cerdá Citation1998; Kim et al. Citation2010; Ladygina and Hedlund Citation2010).
We hypothesized that the amounts of microorganisms, soil aggregate size, and C content are interrelated and that they are likely to be affected by the planted species in the forest soil. In this study, we analyzed the distribution of soil aggregate size in accordance with tree species and soil depth and its relationship with soil C content. We also examined the microbial biomass in soil to investigate the correlation between aggregate size and the amount of soil microorganisms in the Pinus rigida Mill. and Larix kaempferi (Lamb.) Carr. plantations in central Korea.
Materials and methods
Study area
The study was conducted at the Korea University Yangpyeong Experimental Forest in Gyoenggi-do, central Korea (37°30′N, 127°42′E). We selected two tree species, P. rigida and L. kaempferi, that have been planted throughout the country because of their rapid growth and suitability for growth in the Korean climate (Son and Kim Citation1996). The studied trees were afforested in 1956 with similar environmental conditions of soil type, aspect, slope and altitude after clear cutting of the natural oak forest (Kim et al. Citation1995). Therefore, we considered the environmental conditions of the two plantations to be identical, except for the tree species difference, because they are located adjacent to each other.
General characteristics of the plantations are presented in . Dominant understory species were Quercus serrata Thunb., Q. mongolica Fisch., Q.acutissima Carr., Prunus sargentii R., Fraxinus rhynchophylla Hance., Carpinus cordata Bl., and Rhus trichocarpa Miq. The annual average precipitation andtemperature in 2010 were 1903 mm and 11.4°C, respectively (data available online at http://www.kma.go.kr).
Table 1. General characteristics of the Pinus rigida and Larix kaempferi plantations with standard error in the parentheses.
Soil sampling
We established three 15 m × 15 m plots within each plantation. Two soil samples per plot were collected for analyzing soil aggregate distribution, microbial biomass C concentration, and soil C concentration and content with a 406.94 cm3 corer from three depths: 0–10 cm, 10–20 cm and 20–30 cm. Soils for measuring bulk density were additionally taken for each pit using the same corer with the same method. Then they were carried to the lab to be dried at 105°C for 72 hours and weighed to determine bulk density.
Microbial biomass C concentration
Soil samples were sieved with an 8-mm sieve to eliminate large detritus organic matter before they were dried. Ten grams of soil passing the sieve were taken from the sample and dried and weighed to measure the moisture content of the soil. The microbial biomass C concentration was analyzed by fumigation-extraction method with chloroform (Vance et al. Citation1987). Ten grams of fresh soil and another 10 g of soil fumigated with chloroform for 72 hours were extracted with a 0.5 M K2SO4 solution. The total organic C concentrations of the extracts were analyzed by using a TOC analyzer (TOC-V CPH, Shimadzu). The microbial biomass C concentration was calculated by the following equation,
Soil fractionation
The water-stable soil aggregate was fractionated by the wet-sieving method introduced by Elliott (Citation1986). Thesample was fractionated through a series of three sievesizes to classify four aggregate size classes: large macroaggregate (>2000 μm), small macroaggregate (250–2000 μm), microaggregate (53–250 μm), and silt-plus-clay (<53 μm) fraction. Briefly, 80 g of air-dried sample was submerged in distilled water on a 2-mm sieve in a basin for 5 minutes for slaking. After slaking, the sample was sieved by manually moving the sieve vertically 3 cm 50 times in 2 minutes. The fraction remaining on the sieve was transferred to an aluminum pan. Water and soil passing through a 2-mm sieve was poured into the next smaller-sized sieve and the sieving was repeated with the same procedure. This procedure was repeated for every sieve size (250 and 53 μm). Thefractionated soils were moved to a forced-convection oven and dried at 65°C for 72 hours. The dried soils were weighed to calculate the mean weight diameter (MWD) as the index of the water-stable aggregate size (Van Bavel Citation1949).
Soil carbon
The fractionated soils were ground to a fine powder to analyze the soil C concentration. The large macroaggregate was passed through a 2-mm sieve before grinding to exclude particles with a diameter greater than 2 mm which contained no organic C. The C concentration of each sample was measured by the drycombustion method using a vario Macro Elemental Analyzer (Elementar Analysensysteme GmbH, Germany). The C content of each aggregate size class was calculated according to
Statistical analyses
Analysis of variance and Duncan's multiple range testwere performed to compare the soil aggregate distribution, microbial biomass C, soil C concentration and content at various soil depths in different plantations; t-test was performed to determine the difference of MWD, soil C concentration, soil C content, and microbial biomass C concentration between the plantations within the same depth. The relationships between microbial biomass C concentration and MWD, between MWD and mean soil C concentration, and between mean soil C concentration and microbial biomass C concentration were analyzed by Pearson's correlation analysis and the correlation results were analyzed with regression analysis. All statistical analyses were conducted using SAS 9.2 (SAS Institute Inc., USA).
Results and discussion
Soil aggregate distribution
For both plantations, small macroaggregate accounted for most of the weight proportion, from 50.6% to 90.1%, in the whole soil samples. The mean weight proportion of large macroaggregate, small macroaggregate, microaggregate, and silt-plus-clay were 9.8%, 65.3%, 19.7%, and 5.3% in the P. rigida plantation, and 12.0%, 74.0%, 12.1%, and 3.9% in the L.kaempferi plantation, respectively ().
Figure 1. The weight proportion of different aggregate size class in the Pinus rigida (a) and Larix kaempferi (b) plantations with standard error bars; large macroaggregate (LM), small macroaggregate (SM), microaggregate (Mi), and silt-plus-clay (SC). Different letters indicate the differences among the depths within the same soil aggregate size (P < 0.05).
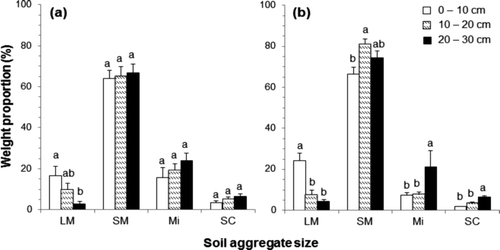
The aggregate distributions showed a similar tendency with the values reported by Chung et al. (Citation2008) in no-tillage crop land, 10.4% for large macroaggregate, 63.0% for small macroaggregate, 16.9% for microaggregate, and 8.8% for silt-plus-clay. In both plantations, the weight proportion of large macroaggregate was higher in the surface soil than in the deep soil, and the weight proportions of microaggregate and silt-plus-clay tended to increase with soil depth. Gama-Rodrigues et al. (Citation2010) also reported that the weight proportion of small aggregate increased with depth in forest soil. The mean MWD was 1.58 mm, 1.26 mm, and 0.93 mm in the P. rigida plantation and 1.97 mm, 1.31 mm, and 1.07 mm in the L. kaempferi plantation at depths of 0–10 cm, 10–20 cm, and 20–30 cm, respectively. The mean MWD of soil up to 30 cm in the L. kaempferi plantation (1.45 mm) was larger than that in the P. rigida plantation (1.26 mm). Also, the MWD in the surface soil was larger than that in thedeep soil. This indicated that the size of the water-stable soil aggregate and the amount of macroaggregate contained in the L. kaempferi plantation were greater than those in the P. rigida plantation.
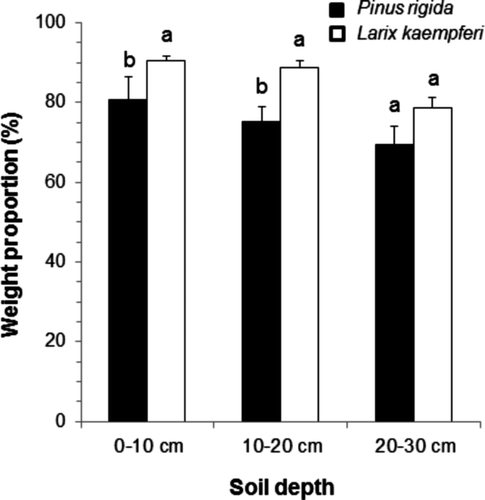
In order to clarify the differences among aggregate size, we classified the soil into two fractions based on the hierarchical theory of soil aggregate suggested by Tisdall and Oades (Citation1982); soil aggregate larger than 250μm (large macroaggregate + small macroaggregate) and soil aggregate under 250 μm. According to the theory, soil aggregates are formed by different mechanisms depending on their size. Small aggregates under 250 μm are formed mainly by persistent binding agents. These small aggregates are bound transiently and temporarily by organic binding agents such as microbial biomass and roots, creating macroaggregates over 250 μm (Tisdall and Oades Citation1982). In this study, the weight proportion of aggregate size over 250 μm was significantly higher in the L. kaempferi plantation (86.0%) than that in the P. rigida plantation (75.2%) (P < 0.05) (). There were significant differences in weight proportion between the two plantations at0–10 cm and 10–20 cm depths (P < 0.05), but not at 20–30 cm depth. This indicates that the activity of formation and stabilization of macroaggregate over 250 μm by microorganisms and roots may have been more active in the L. kaempferi plantation than in the P. rigida plantation, and in the surface soil than in the deep soil.
Figure 2. The weight proportion of macroaggregate over 250 μm (large macroaggregate + small macroaggregate) in the Pinus rigida and Larix kaempferi plantations with standard error bars. Different letters indicate the difference between the plantation within the same depth (P < 0.05).
Soil C concentration
The mean C concentration of the whole aggregate sizefractions was 2.82%, 1.77%, and 1.42% in the P.rigida plantation and 4.54%, 2.60%, and 1.50% in the L.kaempferi plantation at depths of 0–10 cm, 10–20 cm, and 20–30 cm, respectively. There were significant differences in C concentration between the plantations (P < 0.01) and among the depths (P < 0.01). Our values in the L. kaempferi plantation were similar to the results by Lee et al. (Citation2010) who reported 3.89 to 4.33% at 0–10 cm, 1.76 to 2.61% at 10–20 cm, and 1.06 to 1.58% at 20–30 cm depths for a 30-year-old L. kaempferi plantation in central Korea. The mean soil C concentrations up to 30 cm depth in the P. rigida and L. kaempferi plantations were 2.00% and 2.88%, respectively. The 0–10 cm depth had the highest soil C concentration among the depth classes. The difference in C concentration between the two plantations was clearer at the surface soil, and the gap was decreased with soil depth. On the other hand, there was no significant difference of soil C concentration among the aggregate size classes.
Generally, C concentration was higher in larger aggregates, since macroaggregate over 250 μm contains microaggregates under 250 μm plus organic matter as binding agents (Jastrow et al. 1996; Six et al. Citation2000). Also, forest soil normally contains more water-stable aggregate compared with soil of agricultural land because organic matter on the forest floor and the forest canopy protects the soil surface from disturbances such as raindrops that destroy the aggregate (Carmean Citation1957). Therefore, we expected the large aggregate over 250 μm to show higher C concentration than the microaggregate under 250 μm. However, the results were contrary to our expectations. The soil C concentration up to 30 cm in large macroaggregate, small macroaggregate, microaggregate, and silt-plus-clay was 1.97%, 1.84%, 2.21%, and 2.00% in the P.rigida plantation, and 2.74%, 2.62%, 3.23%, and 2.93% in the L. kaempferi plantation. Although there was no significant difference, the C concentration of microaggregate was slightly higher than those of other aggregate sizes in both plantations. Macroaggregate over 250 μm consists of microaggregate under 250 μm with transient and temporary organic binding agents (Tisdall and Oades Citation1982). These organic binding agents lose their stabilizing role as the soil gets drier, andbecome vulnerable points in the soil structure (Urbanek et al. Citation2011). When dried soil is re-wetted, the macroaggregate is easily broken down into microaggregates smaller than 250 μm (Denef et al. Citation2001). In this study, the drying period of the soil samples before the wet-sieving procedure was too long (approximately 2 months). Such a long drying period weakens the organic binding agents such as microorganisms in themacroaggregate (Van Gestel et al. Citation1993), which facilitate macroaggregate break-up during the wet-sieving process, causing C release. Therefore, the contrast of our results with those from other studies may have been caused by the altered physical characteristics of the macroaggregate during the long drying period, however, the reason has not yet been elucidated.
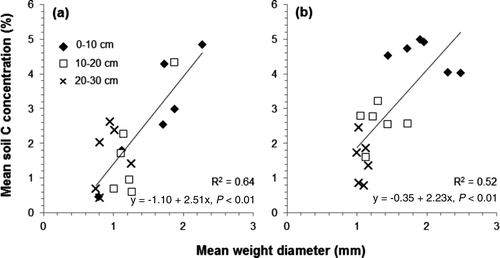
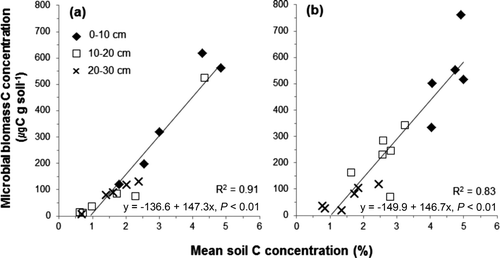
A strong correlation was observed between the MWD and mean soil C concentration (), which partially supports the hierarchical theory of soil aggregate. Macroaggregate contains C in the microaggregate plus C in the organic binding agents (Jastrow et al. Citation1996; Six et al. Citation2000). Furthermore, this result implies that surface soil with high C concentration contains relatively many more macroaggregates than deep soil does.
Figure 3. Relationship between the mean weight diameter of soil aggregate and the mean soil C concentration in the Pinus rigida (a) and Larix kaempferi (b) plantations.
Soil C content
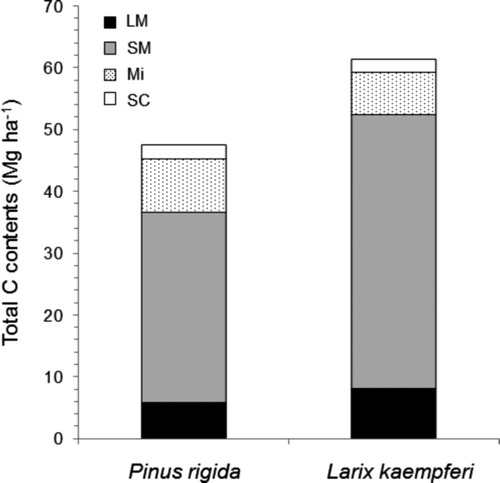
The soil C content within the 30 cm of depth was 47.69Mg ha−1 in the P. rigida plantation and 61.49Mg ha−1 in the L. kaempferi plantation. The C contents were significantly different among the different sizes (P < 0.01). Small macroaggregate had the highest C content in both plantations ().
Table 2. Soil C contents (Mg ha−1) in different aggregate size for the Pinus rigida and Larix kaempferi plantations. Values in parentheses are standard errors. The first capital letters indicate differences between plantations within the same aggregate size and the depth. Small letters indicate difference among the depths within the same aggregate size and the plantation. The second capital letters indicate differences among the aggregate size within the same plantation and the depth (P < 0.05); large macroaggregate (LM), small macroaggregate (SM), microaggregate (Mi), and silt-plus-clay (SC).
The soil C contents in each aggregate size were not related to their C concentration, but to their weight proportion. The C content in forest soil is usually determined by input and decay rate of organic matters from plants (Russell et al. Citation2009). Litter input depends on species, tree age, diameter at breast height (dbh), tree density, and basal area (Lee and Son Citation2006). According to a previous study conducted in the same area, due to the higher tree density, dbh, and basal area, the P. rigida plantation showed more annual litter input (6020 kg ha−1) than the L. kaempferi plantation (4191 kg ha−1) (Kim et al. Citation1996). However, the litter decay rate was relatively high in the L. kaempferi plantation (Hwang and Son Citation2002). Litter quality is one of the reasons for the difference of soil C content in different species (Kim et al. Citation2010). Generally, the litter decay rate increases when the nitrogen concentration in the litter on the forest floor is high or the C/N ratio of the litter is low (Finzi et al. Citation1998). Nitrogen contents in litterfall were almost twice as high in the L. kaempferi plantation than in the P. rigida plantation (Kim et al. Citation1996). Although the P. rigida plantation produced more litter, the litter decay rate was higher in the L.kaempferi plantation, so that the transfer of C from litter to soil was more rapid in the L. kaempferi plantation. Therefore, one of the major factors affecting the high C concentration of soil in the L.kaempferi plantation is the relatively fast litter decay rate on the forest floor.
The soil of the L. kaempferi plantation had a higher C concentration than that of the P. rigida plantation, except for large macroaggregate at 20–30 cm depth, but the soil C contents showed a slightly different tendency from the soil C concentration. In the P. rigida plantation, silt-plus-clay from whole depth and microaggregated soil deeper than 10 cm contained more soilC than that in the L. kaempferi plantation. This implied that the weight proportion of small aggregate under 250 μm was higher in the P. rigida plantation than in the L. kaempferi plantation. Although there was no significant difference in soil C content between the two plantations, the C content in large macroaggregate and small macroaggregate were higher in the L. kaempferi plantation (52.55 Mg ha−1) than in the P.rigida plantation (36.71 Mg ha−1) (). Macroaggregate over 250 μm contained 60.8% to 88.8% of soil C over the whole soil depth. The amount of C stored in soil aggregate over 250 μm was greater inthe L. kaempferi plantation than in the P. rigida plantation, resulting in the difference of soil C content between the two plantations. This indicated that the soil mostly comprising macroaggregate is able to store more C than that mostly comprising microaggregate.
Figure 4. Total soil C contents in the Pinus rigida and Larixkaempferi plantations with different soil aggregations; large macroaggregate (LM), small macroaggregate (SM), microaggregate (Mi), and silt-plus-clay (SC).
Microbial biomass C concentration
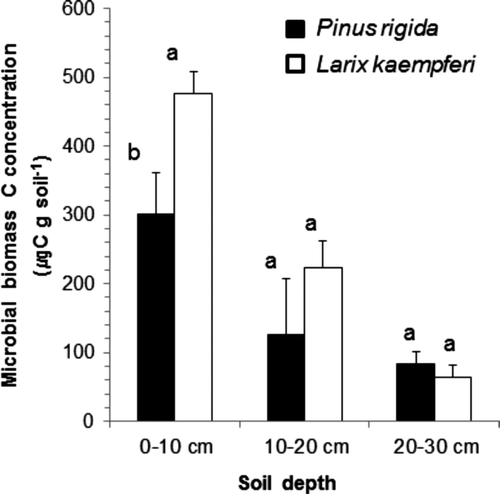
The mean microbial biomass C concentration up to 30 cm depth was 510 μg C g soil−1 in the P. rigida plantation and 764 μg C g soil−1 in the L. kaempferi plantation. The microbial biomass C concentration in the P. rigida and L. kaempferi plantations was 477 and 300 μg C g soil−1 at 0–10 cm, 224 and 126 μg C g soil−1 at 10–20 cm and 64 and 84 μg C g soil−1 at 20–30 cm depths (). The microbial biomass C concentration in the L. kaempferi plantation was higher than that in the P. rigida plantation except at 20–30 cm depth. The microbial biomass C concentration was significantly different between the plantations (P < 0.05) and among the depths (P < 0.01). The microbial biomass C concentration tended to decline in both plantations with increasing depth. The microbial biomass C concentration in the L. kaempferi plantation was much higher than that in the P. rigida plantation at the 0–10 cm depth, however, the gap was reduced at 10–20 cm and 20–30 cm. Significant difference was observed only in the surface soil (0–10 cm) (P < 0.05).
Figure 5. The mean microbial biomass C concentration at different soil depth in the Pinus rigida and Larix kaempferi plantations. Different letters indicate the difference between the two plantations at the same depth (P < 0.05).
The microbial biomass C can be an index of the soil organic C concentration since it is affected by the available C in the soil (Piao et al. Citation2001). In this study, astrong correlation was observed between the soil C concentration and microbial biomass C concentration ().
Figure 6. Relationship between the mean soil C concentration and the microbial biomass C concentration in the Pinus rigida (a) and Larix kaempferi (b) plantations.
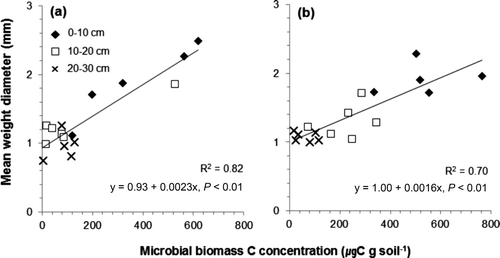
The microbial biomass C also can be affected by the structure of the plant roots (Carmean Citation1957). Hishi et al. (Citation2008) studied the relationship between fine root biomass and microarthropods, and found that the number of microarthropods increases with increasing fine root biomass. According to the study conducted in central Korea by Hwang et al. (Citation2007), the fine root mass of L. kaempferi is larger than that of P. rigida. In addition, L. kaempferi is a shallow-rooted species, so a large portion of its roots are located at a shallow depth. This indicates that the difference of soil C concentration and root structure between the two plantations explains the greater microbial biomass C concentration in the L. kaempferi plantation than in the P. rigida plantation and why the surface soil shows more microbial biomass C concentration than the deep soil. It was reported that MWD tends to be extended when the microbial biomass increases because microorganisms create lots of macroaggregate, by acting as an organic binding agent (Denef and Six Citation2005). In this study, the amount of microbial biomass C in each soilaggregate class was not measured. However, a positive correlation was observed between the microbial biomass C concentration and MWD in both plantations, which is consistent with the result of the previous study ().
Figure 7. Relationship between the microbial biomass C concentration and the mean weight diameter of soil aggregate in the Pinus rigida (a) and Larix kaempferi (b) plantations.
In the results, the microbial biomass C concentration and soil aggregate size tended to decrease with the soil depth. Several studies have reported correlations between microorganism and aggregate stability (Denef et al. Citation2001). Organic matter from microorganisms (e.g. bacterial extracellular polysaccharides) support the formation and stabilization of macroaggregate (Tisdall and Oades Citation1982). In addition, macroaggregate physically protects microorganisms against external disturbances (Denef et al. Citation2001).
In summary, soil aggregate size, microbial biomass C concentration, and soil C concentration were positively correlated with one another. In the L.kaempferi plantation, MWD was larger, and the microbial biomass C concentration and the soil C concentration and content were higher than in the P.rigida plantation. The study results suggested that the soil aggregate distribution is influenced by the planted species in the forest. Also, the forest soil had more C content because the soil contained more macroaggregate over 250 μm due to its binding mechanisms. Therefore, in order to increase the C storage capacity of the soil, it is important to maintain a larger aggregate size, which necessitates an improved understanding of the factors that affect the aggregate distribution. The soil aggregate distribution can be changed by soil management or land use. Therefore, further research should be conducted to examine the factors that affect soil aggregate distribution such as various forest managements including fertilization and thinning, and the changes of environmental conditions such as climate change.
Acknowledgements
This work was supported by a Korea University Grant (2011).
References
- Carmean , W H . 1957 . The structure of forest soils . Ohio J Sci , 57 : 165 – 168 .
- Cerdá , A . 1998 . Soil aggregate stability under different Mediterranean vegetation types . Catena , 32 : 73 – 86 .
- Chung , H , Grove , J H and Six , J . 2008 . Indications for soil carbon saturation in a temperate agroecosystem . Soil Sci Soc AmJ , 72 : 1132 – 1139 .
- Denef , K and Six , J . 2005 . Clay mineralogy determines the importance of biological versus abiotic processes for macroaggregate formation and stabilization . Eur J Soil Sci , 56 : 469 – 479 .
- Denef , K , Six , J , Bossuyt , H , Frey , S D , Elliot , E T , Merckx , R and Paustian , K . 2001 . Influence of dry–wet cycles on the interrelationship between aggregate, particulate organic matter, and microbial community dynamics . Soil Biol Biochem , 33 : 1599 – 1611 .
- Dixon , R K , Brown , S , Houghton , R A , Solomon , A M , Trexler , M C and Wisniewski , J . 1994 . Carbon pools and flux of global forest ecosystems . Science , 263 : 185 – 190 .
- Elliott , E T . 1986 . Aggregate structure and carbon, nitrogen, and phosphorus in native and cultivated soils . Soil Sci Soc Am J , 50 : 627 – 633 .
- Finzi , A C , Breemen , N V and Canham , C D . 1998 . Canopy tree–soil interactions within temperate forest: species effects on soil carbon and nitrogen . Ecol Appl , 8 : 440 – 446 .
- Gama-Rodrigues , E F , Niar , P KR , Nair , V D , Gama-Rodrigues , A C , Baligar , V C and Machado , C R . 2010 . Carbon storage in soil size fractions under two cacao agroforestry systems in Bahia, Brazil . Environ Manage , 45 : 274 – 283 .
- Harris , R F , Chesters , G and Allen , O N . 1966 . Soil aggregate stabilization by the indigenous microflora as affected by temperature . Soil Sci Soc Am J , 30 : 205 – 210 .
- Hishi , T , Fujimaki , R , McGonigle , T P and Takeda , H . 2008 . Relationships among fine roots, fungal hyphae and soil microarthropods among different soil microhabitats in atemperate coniferous forest of Chamaecyparis obtuse . Eur J Soil Biol , 44 : 473 – 477 .
- Houghton , R A . 2007 . Balancing the global carbon budget . Annu Rev Earth Pl Sci , 35 : 313 – 347 .
- Hwang , J H and Son , Y . 2002 . Effects of thinning, liming and litter layer treatment on soil CO2 efflux and litter decay in P.rigida and Larix leptolepis plantations . J Kor For Soc , 91 : 471 – 479 . (In Korean, with English abstract.)
- Hwang , J H , Son , Y , Kim , C , Yi , M J , Kim , Z S , Lee , W K and Hong , S K . 2007 . Fine root dynamics in thinned and limed pitch pine and Japanese larch plantations . J Plant Nutr , 30 : 1821 – 1839 .
- Jastrow , J D , Boutton , T W and Miller , R M . 1996 . Carbon dynamics of aggregate-associated organic matter estimated by C–13natural abundance . Soil Sci Soc Am J , 60 : 801 – 807 .
- Joergensen , R G . 1996 . The fumigation-extraction method to estimate soil microbial biomass: calibration of the KEC value . Soil Biol Biochem , 28 : 25 – 31 .
- Kim , C , Jeong , J , Cho , H S and Son , Y . 2010 . Carbon and nitrogen status of litterfall, litter decomposition and soil in even-aged larch, red pine and rigitaeda pine plantations . JPlant Res , 123 : 403 – 409 .
- Kim , J S , Son , Y and Kim , Z S . 1995 . Allometry and canopy dynamics of Pinus rigida, Larix leptolepis, and Quercus serrata plantations in Yangpyeong area . J Kor For Soc , 84 : 186 – 197 .
- Kim , J S , Son , Y , Lim , J H and Kim , Z S . 1996 . Aboveground biomass, N and P distribution, and litterfall in Pinus rigida and Larix leptolepis plantations . J Kor For Soc , 85 : 416 – 425 . (In Korean, with English abstract.)
- Ladygina , N and Hedlund , K . 2010 . Plant species influence microbial diversity and carbon allocation in the rhizosphere . Soil Biol Biochem , 42 : 162 – 168 .
- Lal , R . 2005 . Forest soils and carbon sequestration . Forest Ecol Manag , 220 : 242 – 258 .
- Lee , I K and Son , Y . 2006 . Effects of nitrogen and phosphorus fertilization on nutrient dynamics and litterfall production of Pinus rigida and Larix kaempferi. 2006 . J Ecol Field Biol , 29 : 205 – 212 . (In Korean, with English abstract.)
- Lee , S K , Son , Y , Lee , W K , Yang , A R , Noh , N J and Byun , J G . 2010 . Influence of thinning on carbon storage in a Japanese larch (Larix kaempferi) plantation in Yangpyeong, central Korea . For Sci Tech , 6 : 35 – 40 .
- Martins , M R , Cora , J E , Jorge , R F and Marcelo , A V . 2009 . Crop type influences soil aggregation and organic matter under no-tillage . Soil Till Res , 104 : 22 – 29 .
- Oades , J M and Waters , A G . 1991 . Aggregate hierarchy in soils . Aust J Soil Res , 29 : 815 – 828 .
- Piao , H C , Liu , G S , Wu , Y Y and Xu , W B . 2001 . Relationships of soil microbial biomass carbon and organic carbon with environmental parameters in mountainous soils of southwest China . Biol Fert Soils , 33 : 347 – 350 .
- Russell , A E , Cambardella , C A , Laird , D A , Jaynes , D B and Meek , D W . 2009 . Nitrogen fertilizer effects on soil carbon balances in midwestern U.S. agricultural systems . J Appl Ecol , 19 : 1102 – 1113 .
- Six , J , Bossuyt , H , Degryze , S and Denef , K . 2004 . A history of research on the link between (micro)aggregates, soil biota, and soil organic matter dynamics . Soil Till Res , 79 : 7 – 31 .
- Six , J , Conant , R T , Paul , E A and Paustian , K . 2002 . Stabilization mechanisms of soil organic matter: Implications for C-saturation of soils . Plant Soil , 241 : 155 – 176 .
- Six , J , Elliott , E T and Paustian , K . 2000 . Soil macroaggregate turnover and microaggregate formation: a mechanism for C sequestration under no-tillage agriculture . Soil Biol Biochem , 32 : 2099 – 2103 .
- Son , Y and Kim , H W . 1996 . Soil respiration in Pinus rigida and Larix leptolepis plantations . J Kor For Soc , 85 : 496 – 505 . (In Korean, with English abstract.)
- Swift , R S . 2001 . Sequestration of carbon by soil . Soil Sci , 166 : 858 – 871 .
- Tisdall , J M . 1994 . Possible role of soil microorganisms in aggregation in soils . Plant Soil , 159 : 115 – 121 .
- Tisdall , J M and Oades , J M . 1982 . Organic matter and water-stable aggregates in soils . J Soil Sci , 33 : 141 – 163 .
- Urbanek , E , Smucker , A JM and Hom , R . 2011 . Total and fresh organic carbon distribution in aggregate size classes and single aggregate regions using natural 13C/12C tracer . Geoderma , 164 : 164 – 171 .
- Van Bavel , CHM . 1949 . Mean weight diameter of soil aggregates as a statistical index of aggregation . Soil Sci Soc Am J , 14 : 20 – 30 .
- Van Gestel , M , Mercks , R and Vlassak , K. 1993 . Microbial biomass responses to soil drying and rewetting: the fate of fast- and slow-growing microorganisms in soils from different climates . Soil Biol Biochem , 25 : 109 – 123 .
- Vance , ED , Brookes , PC and Jenkinson , DS . 1987 . An extraction method for measuring soil microbial biomass C . Soil Biol Biochem , 19 : 703 – 707 .