Abstract
This study was conducted to determine the effect of thinning on the ecosystem respiration in a red pine forest in southern Korea. We measured the ecosystem respiration and its component respirations from soil, stem, leaf, and coarse woody debris (CWD) in thinned and control stands during 2010. The forest was thinned in October 2009. The total respiration was 8.37 and 8.82 Mg C ha−1 year−1 in the thinned and control stands, respectively. Estimated annual soil, leaf, stem, and CWD respirations in the thinned stand were 5.55, 1.41, 0.90, and 0.51 Mg C ha−1 year−1, accounting for 66, 17, 11, and 6%, respectively. Estimated annual soil, leaf, and stem respirations in the control stand were 5.54, 2.09, and 1.19 Mg C ha−1 year−1, accounting for 63, 24, and 13%, respectively. The organic C storage in tree biomass (149.24 vs. 198.61 Mg C ha−1), input from litterfall (6.79 vs. 7.92 Mg dw ha−1 year−1) and total tree biomass increment (7.67 vs. 9.28 Mg C ha−1 year−1) were all significantly lower (P < 0.05) in the thinned stand than in the control stand. However, the individual tree increment was higher in the thinned stand than in the control stand (9.35 vs. 8.24 kg C year−1). Organic C output through the loss rate of litter mass was significantly higher (55 vs. 50%, P < 0.05) in the thinned stand than in the control stand. These results indicate that ecosystem respiration was slightly increased by thinning, whereas tree biomass C dynamics, and organic C input and output through litter production and decomposition were decreased by thinning. Further long-term study and analyses will be required to define overall C cycling in red pine forests.
Introduction
Net ecosystem respiration (NEE) between the atmosphere and forests has been the subject of extensive climate change research because forests can reduce the increased atmospheric CO2 concentration (Tans et al. Citation1990; Fan et al. Citation1998; IPCC 2001). NEE is the small difference between the two large fluxes of photosynthetic CO2 uptake and carbon (C) release to the atmosphere by respiration (Goulden et al. Citation1996; Law et al. Citation1999). NEE is therefore sensitive to both respiration and photosynthesis and is often changing within and among sites (Euskirchen et al. Citation2006). Even though ecosystem respiration determines NEE (Valentini et al. Citation2000), respiration and its components in forest ecosystem have received much less attention in measuring and modeling (Law et al. Citation1999).
Respiration in forest ecosystems is composed of soil, stem, leaf, and coarse woody debris (CWD) respiration (Tang et al. Citation2008). Respiration is affected by several factors such as temperature, water content, and the quality of substrate for respiration (Ryan and Law Citation2005). Tang et al. (Citation2008) reported that the amount of respiration varies according to age and the relationship between chamber method and eddy covariance. Euskirchen et al. (Citation2006) reported the variance of NEE depending on age classes. However, little study has been focused on the proportion of each respiration component such as changes in the amount of ecosystem respiration according to forest management, especially, thinning.
The forest management practice of thinning, defined as the partial removal of trees from the forest, is an important and common silvicultural practice in Korea with the purpose of reducing competition among trees and wildfire risk, and of improving tree productivity and forest health (Tang et al. Citation2005). Thinning decreases stand density and leaf area, but increases light and nutrient availability, and ultimately alters soil temperature, soil water content, root density, and microbial community (Ma et al. Citation2004; Tang et al. Citation2005).
Soil respiration may be partitioned into root respiration and microbial respiration. Both types are primarily affected by soil temperature and water content (Lloyd and Taylor Citation1994), as well as by root density or biomass (Janssens et al. Citation1998), quantity and quality of organic matter (Rayment and Jarvis Citation2000; Epron et al. Citation2004), microbial biomass (Lee and Jose Citation2003), vegetation characteristics (Law et al. Citation2001), and soil texture or porosity (Dilustro et al. Citation2005). Stem respiration may be controlled by stem temperature and growth rates (Ceschia et al. Citation2002). Leaf respiration may be driven by temperature, species, and leaf nitrogen content (Bolstad et al. Citation1999). CWD decomposition may be controlled by temperature, humidity, O2/CO2 concentration, woody substrate quality, and organisms in CWD (Li et al. Citation2007). Although respiration is mainly influenced by temperature, the measurement and modeling of respiration components is difficult due to a variety of controlling factors.
Red pine (Pinus densiflora S. et Z.) is one of the dominant trees throughout the Korean Peninsula (Critchfield and Little Citation1966) and occupies one-third of all Korean forests (KFS 2002). However, little research has attempted to study the impact of thinning on ecosystem respiration and its components in such ecosystems.
The objectives of the study were to (1) estimate the annual respiration and its partitioning among different components, (2) compare C storage and increment of tree biomass in thinned and control stands, and (3) analyze the relationship between each respiration component and temperature.
Materials and methods
Site description
The research was conducted in a 20-year-old stand of red pine (Pinus densiflora S. et Z.) at Yeosu (34°49′N, 129°12′E, 75m), southern Korea (Figure 1). The annual precipitation in the area was 1408 mm and the annual mean temperature was 14.1°C at Yeosu meteorological administration. The experimental plots were located in two adjacent thinned and non-thinned Pinus densiflora stands, and thinning was performed in October 2009. Three plots sized 20 × 20 m were installed in each treatment site. The major species were Eurya japonica, Aralia elata, Ligustrum japonicum, and Rhus trichocarpa in the thinned plots, and Albizzia julibrissin, Eurya japonica, and Ligustrum japonicum in the control plots. The soil texture at the study site was clay loam with pH of 4.4. The stand characteristics are reported in .
Table 1. Stand characteristics in the thinned and control plots (n = 3).
Soil respiration
Soil respiration was measured using an infrared gas analyzer (LC pro + Portable Photosynthesis System, ADC, UK) equipped with a soil chamber. Nine soil collars (a height of 7 cm and a diameter of 11 cm) were inserted 5 cm into the soil in each plot at random locations with minimum disturbance of the organic horizon. During the soil respiration measurement, the soil temperature at 10 cm depth was measured adjacent to each soil collar with a portable temperature probe. The volumetric soil water content at 7 cm depth was measured by a T&D Thermo Recorder and Field Scout TDR 100 adjacent to each collar. Monthly measurements were performed between 10:30 AM and 14:00 PM from January 2010 to December 2010. We used an exponential equation (Equation (1)) to analyze the relationship between soil respiration rates and temperature, and soil respiration rates and litter decomposition rates. To define the sensitivity of respiration to temperature, we used the Q10 value derived from Equation (2).
Stem respiration
Stem respiration was measured on three trees in each plot, following the method of Bolstad et al. (Citation2004). The tree samples ranged from 13 to 26 cm in diameter at breast height (DBH). Collars with a height of 7 cm and a diameter of 11 cm were mounted with silicon sealant at a height of approximately 50 cm and a random direction. The sapwood temperature was measured with a portable temperature probe inserted into the sapwood near the collar of each tree. The sapwood thickness was measured with a tree core. The measured stem respiration rates per unit area were converted to rates per unit of sapwood volume assuming a wedge-shape volume that contributed to the respiration rates. To analyse the dependence of the sapwood respiration on the stem temperature in each stand, we used the exponential equation of Equation (1). The total sapwood volume per unit ground area in each plot was estimated for upscaling the chamber measurements of the stem respiration to the stand level. The tree stem and branch biomass volumes were calculated from regional allometric equations (Equation (3)) for red pine () (Lim et al., forthcoming). The total sap wood biomass was derived from Equation (4) by assuming that the branch biomass, excluding the bark, was all sapwood (Law et al. Citation1999; Wu et al. Citation2001; Bolstad et al. Citation2004). The total sapwood biomass was converted to sapwood volume based on wood density (0.53 g cm−3) for red pine (Lim et al., forthcoming). After estimating the sapwood volume of 16 sample trees, we found a good relationship between DBH and sapwood volume by a power function (Equation (5)).
To estimate the total stem respiration in the stand level, the total sapwood volume in the study site was calculated by the regression equation () and the monthly measured stem respiration predictions were summed by year.
Table 2. Parameters in the allometric equation (Equation (3)) used to plot the components biomass and sapwood volume against DBH.
Leaf respiration
Leaf respiration was measured from 30 leaves collected from 3 red pine trees with 3 sampling replications in each stand in June, July, and August. Branches with random height and direction in the canopy were detached at night, immediately placed in a plastic bag with a moistened paper towel and transported to a laboratory. Leaf respiration rates were measured with an infrared gas analyzer fitted with a leaf chamber (2.5 cm × 2.5 cm) within 3 h after branch harvest. Each leaf sample was measured at 15 and 30°C. The real leaf temperature, ranging from 19 to 33°C, was recorded with a thermocouple inside the chamber. The monthly leaf respirations were estimated from the monthly canopy temperature measurements. The canopy temperature was assumed to be similar at all sites. The leaves were oven-dried at 65°C for 72 hour and weighed. The leaf respiration measurement based on the chamber area was converted to leaf respiration per biomass. To estimate the stand leaf respiration, the total leaf biomass in the plots was calculated by regional allometric equation for red pine ().
Coarse woody debris (CWD) respiration
Coarse woody debris resulted from thinning was measured at the individual diameter and length with greater than 10 cm in a diameter in the thinned plots. Three soil collars with a height of 7 cm and a diameter of 11 cm were mounted with silicon sealant at randomly selected CWD. Similar to the protocol used for the soil respiration measurement, the CWD respiration was measured by an infrared gas analyzer. The CWD temperature at 10 cm depth was also measured adjacent to each CWD collar with a portable temperature probe. The measurement was recorded monthly from January 2010 to December 2010. To upscale the chamber measurement to the stand level, we used the surface area of CWD (Tang et al. Citation2008).
Litterfall and litter decomposition rate
To estimate the amount of litterfall in each stand, 5 circular litter traps with a diameter of 60 cm were placed above the forest floor at each plot. The monthly collected litter samples from the litter traps were oven-dried at 65°C for 24 hours. All samples were separated into leaf, bark, branch, seed and miscellaneous, and each component was weighed.
The organic C output from the litter decomposition was determined using the litterbag method (Kim et al. Citation1996). The fresh litter collected from each plot in January 2010 was oven-dried at 65°C for 72 hours and weighed. The sample weight was recorded on an aluminum tag and then the sample and tag were placed in a 20 × 20 cm nylon bag with a mesh size of 0.5 mm. The litterbags were randomly buried at 5 cm depth under the forest floor at each plot in February 2010. Three samples in each plot were collected monthly from March 2010 to December 2010, and oven-dried at 65°C for 24 hours in a laboratory to measure mass loss rates. The monthly decomposition rate, k, was derived from the exponential decay formula (Brinson et al. Citation1981).
Organic C storage and increment in tree components
The organic C storage of the tree biomass was calculated using an allometric equation based on DBH for red pine (). DBH of all the trees in each plot was measured in December 2009 and December 2010 so that the annual increment of tree biomass in each plot could be calculated. The tree C storage was then calculated by assuming a C concentration of 50% of the biomass (Davis et al. Citation2003).
Results
Soil respiration
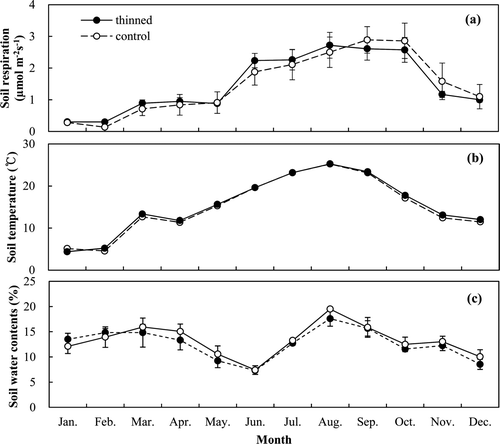
Soil respiration rates ranged from 0.3 to 2.27 μmol m−2 s−1 in the thinned stand and from 0.14 to 2.89 μmol m−2 s−1 in the control stand ( ), while the mean annual soil respiration rates were 1.49 and 1.48 μmol m−2 s−1, respectively. Neither of these two rates differed significantly between the two stands for the entire study period. The soil respiration peaked in August and September in the thinned and control stands, respectively. The soil temperature peaked in August in both stands at 25.2°C (b). The soil water contents at 7 cm varied from 7.3 to 17.6% and from 7.4 to 19.5% in the thinned and control stands, respectively, and reached maxima in June and minima in August in both stands. The soil water contents were not significantly different between the two stands (c).
Figure 1. Location of the study site.
Figure 2. Monthly variation of soil respiration rates (a), temperature (b), and volumetric water content (c) in the thinned and control stands (n = 18). Vertical bars indicate standard errors.
The soil respiration rates highly correlated with the soil temperature (R 2 = 0.89 in thinned and 0.78 in control, P < 0.05) using an exponential relationship (). Q10 was derived as 2.97 and 3.41 in the thinned and control stands, respectively (). There was a significant correlation between the soil Q10 value and the leaf biomass for all 6 plots (R 2 = 0.73, P < 0.05) (). In addition, the relationship between soil respiration and litter decomposition rates was significantly correlated (R 2 = 0.60 in thinned and 0.65 in control, P < 0.05) (). The estimated annual soil respiration was not significantly different (5.55 vs. 5.54 Mg C ha−1 year−1) ().
Figure 3. Relationship between soil respiration rates and soil temperature at 7 cm depth in the thinned and control stands.
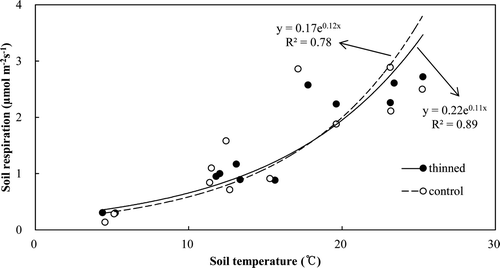
Figure 4. Relationship between soil Q10 values and leaf biomass in the six plots.
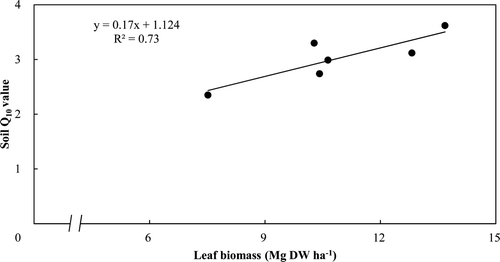
Figure 5. Relationship between soil respiration rates and litter decomposition rates.
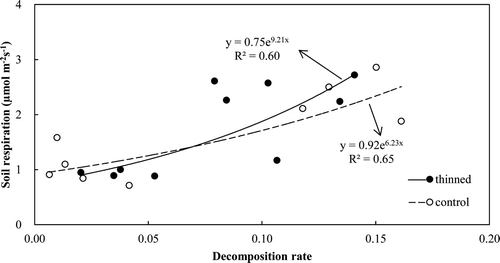
Table 3. Parameters in the exponential equation (Equation 1) used to determine the response of respiration components to temperature in the thinned and control stands.
Table 4. Estimated annual components and ecosystem respiration (Mg C ha−1 year−1) in the thinned and control stands (n = 3).
Stem respiration
The sapwood volume was estimated as 155.4 and 205.5 m3 ha−1 in the thinned and control stands, respectively (). The stem respiration rates ranged from 0.4 to 35.4 μmol m−3 s−1 and from 1.37 to 24.7 μmol m−3 s−1, respectively (). The stem respiration rates were not significantly different between the two treatments during the measurement period. The plot of the stem respiration rates against the sapwood temperature revealed an exponential relationship between the two (). Q10 was derived to be 2.94 and 2.37 in the thinned and control stands, respectively (). The estimated annual stem respiration was 0.90 and 1.19 Mg C ha−1 year−1, respectively (). The annual stem respiration in the control stand was higher, but not significantly.
Figure 6. Monthly variation of stem respiration rates (a) and sapwood temperature (b) in the thinned and control stands (n = 18). Vertical bars indicate standard errors.
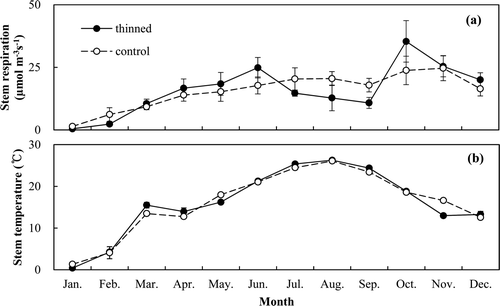
Figure 7. Relationship between stem respiration rates per sapwood volume and sapwood temperature in the thinned and control stands.
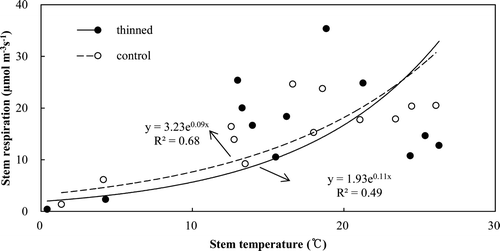
Table 5. Estimated sapwood volume, leaf biomass, and coarse woody debris (CWD) surface in the thinned and control stands (n = 3).
Leaf respiration
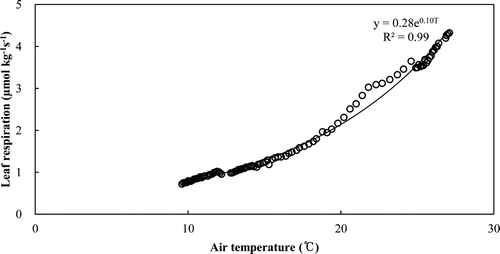
The same exponential equation was used to plot the leaf respiration rates per unit mass against the leaf biomass due to the lack of any significant difference of two equations between the two treatments. Q10 was obtained as 2.76 (, ). The leaf biomass derived from the allometric equation was 4.74 and 6.15 Mg ha−1 in the thinned and control stands, respectively (). The leaf respiration rates ranged from 0.04 to 0.88 (μmol kg−1 s−1) and from 0.06 to 1.31 (μmol kg−1 s−1), respectively. The cumulative annual leaf respiration was significantly different (1.41 and 2.09 Mg C ha−1 year−1, respectively, P < 0.0001) ().
Figure 8. Relationship between leaf respiration rates per leaf biomass and leaf temperature.
CWD respiration
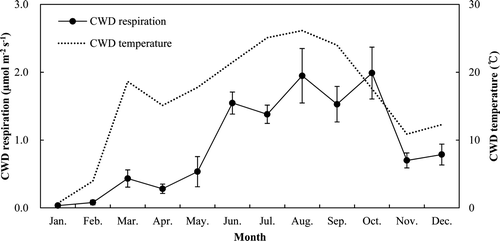
The CWD surface on the forest floor was 0.146 m2 m−2 (). The CWD respiration rates ranged from 0.03 to 1.99 over the temperature range from 0.69 to 26.15°C (). There was a significant correlation between CWD respiration rates and temperature (R 2 = 0.77, P < 0.05), with a Q10 value of 4.07 (). The annual CWD respiration was 0.51 Mg C ha−1 year−1 ().
Figure 9. Monthly variation of coarse woody debris (CWD) respiration rates with temperature in the thinned stand. Vertical bars indicate standard errors.
Ecosystem respiration
The ecosystem respiration rates ranged from 0.38 to 4.74 μmol m−2 s−1 in the thinned stand and from 0.41 to 5.63 μmol m−2 s−1 in the control stand during the measurement periods (), and reached maxima in August and minima in January in both stands. The mean annual ecosystem respiration rates were 2.52 and 2.96 μmol m−2 s−1, respectively. The cumulative annual ecosystem respiration was 8.37 and 8.82 Mg C ha−1 year−1, respectively (). The annual ecosystem respiration was not significantly different between the two stands. The cumulative annual soil, leaf, stem, and CWD respiration in the thinned stand was 5.55, 1.41, 0.90, and 0.51 Mg C ha−1 year−1, respectively, accounting for 66%, 17%, 11%, and 6%. The cumulative annual soil, leaf and stem respiration in the control stand was 5.54, 2.09, and 1.19 Mg C ha−1 year−1, respectively, accounting for 63%, 24%, and 13% ().
Litter production and decomposition rate
The annual litter production was lower in the thinned stand than in the control stand (6.79 vs. 9.60 Mg ha−1 year−1) (). The litter production was concentrated in the winter and summer seasons in both stands ().
Figure 10. Monthly variation of ecosystem respiration rates in the thinned and control stands. Vertical bars indicate standard errors.
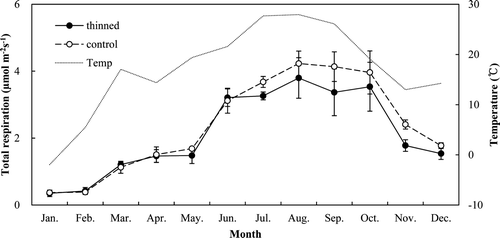
Figure 11. Monthly variation of litter production in the thinned and control stands.
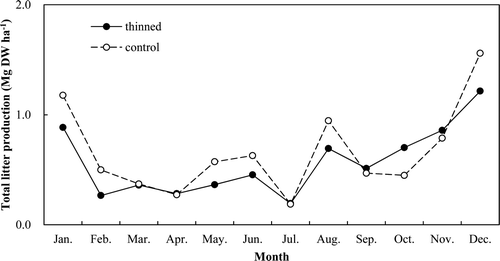
Table 6. Estimated annual litter production (Mg dw ha− 1 year− 1) in the thinned and control stands.
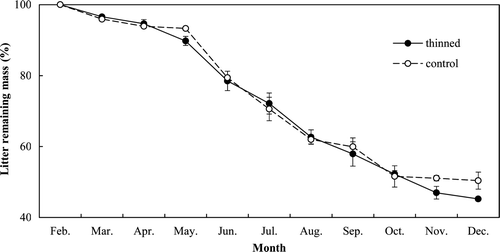
The monthly litter decomposition rates in March, November, and December were significantly higher in the thinned stand than in the control stand (P < 0.05) (). The mean monthly decomposition rate, k, was higher in the thinned stand than in the control stand (0.088 vs. 0.081), and the annual decomposition rate throughout the measurement period was significantly higher in the thinned stand than in the control stand (0.55 vs. 0.50, P < 0.05).
Figure 12. Monthly litter decomposition rates in the thinned and control stands. Vertical bars indicate standard errors.
Organic C stock and increment in tree components
The measured organic storage in 2009 and 2010 was 141.57 and 149.24 C Mg ha−1 in the thinned stand and 189.33 and 198.61 C Mg ha−1 in the control stand, respectively. The annual organic C increment was 7.67 and 9.28 Mg C ha−1 year−1 in the thinned and control stands, respectively. The organic C storage and annual increment were significantly lower (P < 0.05) in the thinned stand than in the control stand, except for bark and leaf. The highest thinning-induced loss of organic C in the tree biomass was stem, followed by root, branch, bark, and leaf.
Discussion
Ecosystem respiration
We observed the effect of thinning on the ecosystem respiration and its components. The estimated annual ecosystem respiration was not significantly different between the two stands, which was attributed to the offset derived from the emergence of CWD biomass but decreasing leaf biomass and sapwood volume.
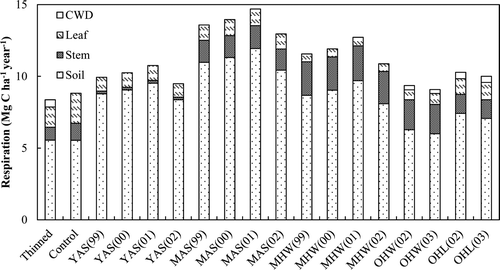
The age class and species are important in determining the proportion of respiration components and the amount of ecosystem respiration, and the ecosystem respiration tended to peak in mature stands (Curtis et al. Citation2005; Tang et al. Citation2008). We plotted the compositions of soil, leaf, stem, and CWD respiration from the young aspen, mature aspen, mature second-growth northern hardwood, old-growth hardwood, and old-growth hemlock as reported in two previous studies (Bolstad et al. Citation2004; Tang et al. Citation2008) and compared these results with those of the present study (). Although these studies were not conducted at the same site, we found that the proportion of leaf respiration was higher in the young stands than in the mature or old-growth stands. This may have been due to the tendency for the ratio of stem, including branch biomass, to leaf biomass to increase as trees mature from saplings to mature trees, and then decrease as they further age from mature trees to old-growth trees (Lim et al., forthcoming). The ecosystem respiration in this study was lower than that in other studies, which may have been due to the young age class.
Figure 13. Soil, leaf, stem, and coarse woody debris (CWD) respiration of the young aspen (YAS), mature aspen (MAS), mature hardwood (MHW), old-growth hardwood (OHW), old-growth hemlock (OHL), and the thinned and control stands of this study. The values in parentheses are measurement years.
Soil respiration
Thinning decreased the root respiration but increased the root and organic matter decomposition rate. In addition, the increased soil bulk density (0.94 vs. 0.88 in the thinned and control stands, respectively) due to the work conducted for thinning may have decreased the diffusion rates of soil respiration (Ponder Citation2005; Kim C et al. Citation2009). Although the separated soil and root respirations were not measured in this study, we considered that the soil heterotrophic respiration in the thinned stand was probably slightly higher than in the control stand due to the higher litter decomposition rates in the thinned stand () and the relationship between the soil respiration and litter decomposition rates ().
Because of the compensation probably caused by the decreasing autotrophic but increasing heterotrophic respiration, the annual soil respirations in the two stands were not significantly different ().
The relationship between soil respiration and temperature has been analyzed (Fang and Moncrieff Citation2001). The Q10 values determined herein for this relationship of 2.35 and 3.41 were similar to the range of 2.61 to 3.75 previously reported for temperate forest by Wang et al. (Citation2006), but higher than the range of 1.78 to 2.45 reported for red pine by Nakane et al. (Citation1983, Citation1984), and slightly lower than the range of 3.45 to 3.77 for red pine by Noh et al. (Citation2010), possibly due to differences of site condition and location (about 400 km from our site). The Q10 values reflect the sensitivity of soil respiration, including root respiration, to the temperature, which is related to the amount of translocated photosynthates from above ground (Högberg et al. Citation2001). This could also explain the observation that the soil respiration in September and October did not decrease despite the decrease in the soil temperature at the same time. This suggestion was strongly supported by Högberg (Citation2010), who found that below-ground C allocation was 500% higher in late summer than in early summer although the soil temperature was increased by only 2.4°C in boreal forest. Root respiration and proliferation may be more sensitive to seasonal variation of photosynthetic activity in deciduous trees than in evergreen trees (Yuste et al. Citation2004; Noh et al. Citation2010). Leaf biomass can be representative of photosynthetic capacity, which would support the relationship between Q10 and leaf biomass. Although our study could not examine the seasonal variation of leaf biomass due to evergreen trees, we found a significant relationship between Q10 and leaf biomass (P < 0.05) (), which may explain the lower Q10 value in the thinned stand.
Soil moisture plays an important role in determining soil respiration (Parker et al. Citation1983). Various models expressed as volumetric, gravimetric water content, and precipitation indices have been suggested to define the relationship between soil respiration and water content. Soil water content could be a major factor controlling ecosystem activity and the sensitivity of respiration in arid or semi-arid areas (Xu and Qi Citation2001; Tang et al. Citation2005). However, the effects of respiration on the water content have not been elucidated in non-arid areas (Chapman Citation1979). The lack of any relationship between soil respiration and water content in this study may have been due to unclear seasonal variation and the relatively narrower fluctuation of water content (7.4 to 19.5%) than that in the above-cited reports (a).
Stem, leaf and coarse woody debris (CWD) respiration
The capacity to produce respiratory products may increase after thinning at lower temperatures, while the rate of supply of reducing sugars to growing cells was less affected by thinning at higher temperatures (Lavigne Citation1987). We obtained similar results, although the stem respiration did not differ significantly in the two stands. At the higher temperatures of July, August, and September, the stem respiration tended to be slightly lower in the thinned stand than in the control stand, whereas the reverse was true at lower temperatures ().
Leaf respiration has been proposed to be exponentially related to temperature and linearly related to leaf nitrogen (Kajimoto Citation1990; Reich et al. Citation1996). The relatively lower concentration of leaf nitrogen and chlorophyll in fall may have depressed the leaf respiration (Amthor Citation1993). In the case of deciduous trees, the leaf nitrogen and chlorophyll, as well as leaf biomass, varied with seasonal changes. However, we used an exponential equation expressed by leaf temperature () due to the evergreen trees. The significant difference of leaf respiration was caused by the variation in leaf biomass ().
Temperature was the main factor determining CWD respiration (), possibly due to the increased microorganism activity and decomposition with increasing temperature. The previously reported annual CWD respiration in hardwood and Hemlock stands (0.36 Mg C ha−1 year−1) (Tang et al. Citation2008) was lower than our value of 0.51 Mg C ha−1 year−1. The different biomass (0.146 vs. 0.084 m2 m−2) was mainly attributed to the difference in CWD respiration.
Annual litter production and decomposition
The monthly litterfall was concentrated in January, August, and December, which was similar to a previous report (Kim et al. Citation1996), except for August. This may have been caused by the presence of snow in January and December, and the concentrated rainfall in the sampling period from July to August (about 40% of total annual rainfall).
As expected, the annual litterfall was significantly lower in the thinned stand than in the control stand (6.79 vs. 7.91 Mg ha−1 year−1; ). A previous study reported that litterfall decreased after thinning in a pine stand (Roig et al. Citation2005; Blanco et al. Citation2006). Kim S et al. (Citation2009) reported litter production for a red pine stand as 5.51 Mg ha−1 year−1, compared with 6.53 Mg ha−1 year−1 as reported by Mun and Joo (Citation1994) for a Pitch pine (Pinus rigida Mill.) stand. This difference may be attributed to tree density, age class, and site condition, but tree density might be the main factor determining litter production (Kim S et al. Citation2009).
Litter decomposition rates can be affected by abiotic factors, such as soil temperature, soil water content, and soil texture, and by biotic factors, such as lignin concentration (Kim S et al. Citation2009) and the decay of organisms (Berg and Laskowski Citation2006).
Both monthly litter decomposition rates and soil temperature in May, November, and December were significantly different between the two stands (P < 0.05) (b and 12). Thus, in this study, litter decomposition rate was mainly influenced by soil temperature.
Organic C storage and annual increment in tree biomass
As expected, the organic C storage and the annual increment in tree biomass following thinning were decreased as the stand density was reduced from 1125 to 820 trees ha−1 year−1 (). A similar decreasing result was reported by Kim C et al. (Citation2009). The annual increment in tree biomass was lower in the thinned stand than in the control stand. This suggests that thinning may not fix much more C in tree biomass than non-thinning. In addition, the increased thinning intensity decreased the C storage and sequestration by above-ground biomass in radiata pine and maritime pine stands (Balboa-Murias et al. Citation2006). However, individual tree carbon storage in the thinned stand was increased by 50% compared with that in the control stand in a Pitch pine stand in South Korea (Koo et al. Citation2004). Our results were similar: the annual average increment per tree was higher in the thinned stand than in the control stand (9.35 vs. 8.24, respectively). This suggests that the long-term growth rate would be higher in the thinned stand than in the control stand.
Table 7. Organic carbon storage and annual increment of tree components in the thinned and control stands (n = 3).
Conclusions
Thinning in a red pine stand is capable of altering the overall ecosystem respiration and its components, C dynamics and various soil characteristics. The ecosystem respiration was not different between the two stands due to the balance between the thinning-induced CWD respiration and the higher leaf and stem respiration in the control stand. The C storage and annual increment in tree biomass were critically lower in the thinned stand than in the control stand. The present study results have demonstrated that thinning may increase C output through respiration, but decrease C storage and annual increment due to the removal of above-ground trees.
However, the long-term, above- and below-ground C dynamics in each stand may differ according to variation in below-ground dead root decomposition rate and root respiration rate, and in above-ground CWD decomposition rate. Moreover, the annual increment in tree biomass may be affected by the thinning-induced increase in individual tree growth rates.
As in previous studies, the age class was important to determine the ecosystem respiration and its components. The study period was therefore important to define the effect of thinning on ecosystem respiration and C storage. Despite the limitation introduced by the uncertainties of our estimated annual sum of respiration that mainly resulted from the short-term effect, the study should prove useful in understanding the short-term effects of thinning on the C cycle in a red pine stand. Further long-term study and analyses will be required to understand C cycling in forest ecosystems following thinning.
Acknowledgements
This study was carried out with the support of “Forest Science & Technology Projects (Project No. S121010L010000)” provided by the Korea Forest Service.
References
- Amthor , J . 1993 . Higher plant respiration and its relationships to photosynthesis. Ecol Stud.: . Analys Synth , 100 : 71 – 102 .
- Balboa-Murias , M A , Rojo , A , Alvarez , J G and Merino , A . 2006 . Carbon and nutrient stocks in mature Quercus robur L. stands in NW Spain . Ann For Sci , 63 ( 5 ) : 557 – 565 .
- Berg , B R and Laskowski , R . 2006 . Litter decomposition: a guide to carbon and nutrient turnover , Vol. 38 , Amsterdam : Elsevier .
- Blanco , J A , Imbert , J B and Castillo , F J . 2006 . Influence of site characteristics and thinning intensity on litterfall production in two Pinus sylvestris L. forests in the western Pyrenees . For Ecol Manage , 237 : 342 – 352 .
- Bolstad , P V , Davis , K J , Martin , J , Cook , B D and Wang , W . 2004 . Component and whole-system respiration fluxes in northern deciduous forests . Tree Physiol , 24 : 493 – 504 .
- Bolstad , P V , Mitchell , K and Vose , J M . 1999 . Foliar temperature–respiration response functions for broad-leaved tree species in the southern Appalachians . Tree Physiol , 19 : 871 – 878 .
- Brinson , M M , Lugo , A E and Brown , S . 1981 . Primary productivity, decomposition and consumer activity in freshwater wetlands . Annu Rev Ecol Syst , 12 : 123 – 161 .
- Ceschia , É , Damesin , C , Lebaube , S , Pontailler , J-Y and Dufrêne , É . 2002 . Spatial and seasonal variations in stem respiration of beech trees (Fagus sylvatica) . Ann For Sci , 59 : 801 – 812 .
- Chapman , S B . 1979 . Some interrelationships between soil and root respiration in lowland Calluna heathland in southern England . J Ecol , 67 : 1 – 20 .
- Critchfield , W B and Little , E L . 1966 . Geographic distribution of the pines of the world , Washington , DC : U.S. Dept. of Agr. Forest Service .
- Curtis , P S , Vogel , C S , Gough , C M , Schmid , H P , Su , H B and Bovard , B D . 2005 . Respiratory carbon losses and the carbon-use efficiency of a northern hardwood forest, 1999–2003 . New Phytol , 167 ( 2 ) : 437 – 455 .
- Davis , M R , Allen , R B and Clinton , P W . 2003 . Carbon storage along a stand development sequence in a New Zealand Nothofagus forest . For Ecol Manage , 177 : 313 – 321 .
- Dilustro , J J , Collins , B , Duncan , L and Crawford , C . 2005 . Moisture and soil texture effects on soil CO2 efflux components in southeastern mixed pine forests . For Ecol Manage , 204 : 85 – 95 .
- Epron , D , Ngao , J and Granier , A . 2004 . Interannual variation of soil respiration in a beech forest ecosystem over a six-year study . Ann For Sci , 61 : 499 – 505 .
- Euskirchen , E S , Pregitzer , K S and Chen , J . 2006 . Carbon fluxes in a young, naturally regenerating jack pine ecosystem . J Geophys Res , 111 ( D1 )
- Fan , S , Gloor , M , Mahlman , J , Pacala , S , Sarmiento , J , Takahashi , T and Tans , P . 1998 . A large terrestrial carbon sink in North America implied by atmospheric and oceanic carbon dioxide data and models . Science , 282 ( 5388 ) : 442 – 446 .
- Fang , C and Moncrieff , J B . 2001 . The dependence of soil CO2 efflux on temperature . Soil Biol Biochem , 33 : 155 – 165 .
- Goulden , M L , Munger , J W , Fan , S M , Daube , B C and Wofsy , S C . 1996 . Exchange of carbon dioxide by a deciduous forest: response to interannual climate variability . Science , 271 ( 5255 ) : 1576 – 1578 .
- Högberg and P . 2010 . Is tree root respiration more sensitive than heterotrophic respiration to changes in soil temperature? . New Phytol , 188 ( 1 ) : 9 – 10 .
- Högberg , P , Nordgren , A , Buchmann , N , Taylor , A FS , Ekblad , A , Hogberg , M N , Nyberg , G , Ottosson-Lofvenius , M and Read , D J . 2001 . Large-scale forest girdling shows that current photosynthesis drives soil respiration . Nature , 411 ( 6839 ) : 789 – 792 .
- IPCC 2001. Climate change . 2001 . The scientific basis , Cambridge : Cambridge University Press .
- Janssens , I A , Barigah , S T and Ceulemans , R . 1998 . Soil CO2 efflux rates in different tropical vegetation types in French Guiana . Ann Sci Forestieres , 55 : 671 – 680 .
- Kajimoto , T . 1990 . Photosynthesis and respiration of Pinus pumila needles in relation to needle age and season . Ecol Res , 5 ( 3 ) : 333 – 340 .
- Korea Forestry Services (KFS) . 2002 . Statistical yearbook of forestry , Seoul : Korea Forestry Services . (in Korean)
- Kim , C , Son , Y , Lee , W K , Jeong , J and Noh , N J . 2009 . Influences of forest tending works on carbon distribution and cycling in a Pinus densiflora S. et Z. stand in Korea . For Ecol Manage , 257 : 1420 – 1426 .
- Kim , C S , Sharik , T L and Jurgensen , M F . 1996 . Canopy cover effects on mass loss, and nitrogen and phosphorus dynamics from decomposing litter in oak and pine stands in northern Lower Michigan . For Ecol Manage , 80 : 13 – 20 .
- Kim , S , Jung , N and Lee , K . 2009 . Soil CO2 efflux and leaf-litter decomposition of Quercus variabilis and Pinus densiflora stands in the southern region of Korean peninsula . J Kor For Soc , 98 : 183 – 188 .
- Koo , G S , Won , H K , Kim , C S , Lee , Y Y , Jeong , J H and Lee , C Y . 2004 . Changes of carbon storage by thinning and application of fertilizer in Pinus rigida and Pinus koraiensis stand . J Kor For Soc , 2 : 191 – 193 .
- Lavigne , M B . 1987 . Differences in stem respiration responses to temperature between balsam fir trees in thinned and unthinned stands . Tree Physiol , 3 : 225 – 233 .
- Law , B E , Kelliher , F M , Baldocchi , D D , Anthoni , P M , Irvine , J , Moore , D and Van , Tuyl S . 2001 . Spatial and temporal variation in respiration in a young ponderosa pine forest during a summer drought . Agr Forest Meteorol , 110 : 27 – 43 .
- Law , B E , Ryan , M G and Anthoni , P M . 1999 . Seasonal and annual respiration of a ponderosa pine ecosystem . Global Change Biol , 5 ( 2 ) : 169 – 182 .
- Lee , K H and Jose , S . 2003 . Soil respiration and microbial biomass in a pecan–cotton alley cropping system in southern USA . Agrof Syst , 58 : 45 – 54 .
- Li , W H , Zhang , C , Gao , G , Zan , Q and Yang , Z . 2007 . Relationship between Mikania micrantha invasion and soil microbial biomass, respiration and functional diversity . Plant Soil , 296 : 197 – 207 .
- Lloyd , J and Taylor , J A . 1994 . On the temperature dependence of soil respiration . Funct Ecol , 8 : 315 – 323 .
- Ma , S Y , Chen , J Q , North , M , Erickson , H E , Bresee , M and Le , Moine J . 2004 . Short-term effects of experimental burning and thinning on soil respiration in an old-growth, mixed-conifer forest . Environ Manage , 33 : S148 – S159 .
- Mun , H and Joo , H . 1994 . Litter production and decomposition in the Querces acutissima and Pinus rigida forests . J Ecol Field Biol , 17 ( 3 ) : 345 – 353 .
- Nakane , K , Tsubota , H and Yamamoto , M . 1984 . Cycling of soil carbon in a Japanese red pine forest I. Before a clear-felling . J Plant Res , 97 ( 1 ) : 39 – 60 .
- Nakane , K , Yamamoto , M and Tsubota , H . 1983 . Estimation of root respiration rate in a mature forest ecosystem . Jap J Ecol , 33 ( 4 ) : 397 – 408 .
- Noh , N J , Son , Y , Lee , S K , Yoon , T K , Seo , K W , Kim , C , Lee , W K , Bae , S W and Hwang , J . 2010 . Influence of stand density on soil CO2 efflux for a Pinus densiflora forest in Korea . J Plant Res , 123 : 411 – 419 .
- Parker , L W , Miller , J , Steinberger , Y and Whitford , W G . 1983 . Soil respiration in a Chihuahuan desert rangeland . Soil Biol Biochem , 15 : 303 – 309 .
- Ponder , F . 2005 . Effect of soil compaction and biomass removal on soil CO2 efflux in a Missouri forest . Commun Soil Sci Plant Anal , 36 : 1301 – 1311 .
- Rayment , M B and Jarvis , P G . 2000 . Temporal and spatial variation of soil CO2 efflux in a Canadian boreal forest . Soil Biol Biochem , 32 : 35 – 45 .
- Reich , P B , Oleksyn , J and Tjoelker , M G . 1996 . Needle respiration and nitrogen concentration in Scots pine populations from a broad latitudinal range: a common garden test with field-grown trees . Funct Ecol , 10 : 768 – 776 .
- Roig , S , del Rio , M , Canellas , I and Montero , G . 2005 . Litter fall in mediterranean Pinus pinaster Ait. stands under different thinning regimes . For Ecol Manage , 206 : 179 – 190 .
- Ryan , M G and Law , B E . 2005 . Interpreting, measuring, and modeling soil respiration . Biogeochemistry , 73 : 3 – 27 .
- Tang , J , Qi , Y , Xu , M , Misson , L and Goldstein , A H . 2005 . Forest thinning and soil respiration in a ponderosa pine plantation in the Sierra Nevada . Tree Physiol , 25 : 57 – 66 .
- Tang , J W , Bolstad , P V , Desai , A R , Martin , J G , Cook , B D , Davis , K J and Carey , E V . 2008 . Ecosystem respiration and its components in an old-growth forest in the Great Lakes region of the United States . Agr Forest Meteorol , 148 : 171 – 185 .
- Tans , P P , Fung , I Y and Takahashi , T . 1990 . Observational constraints on the global atmospheric CO2 budget . Science , 247 ( 4949 ) : 1431 – 1438 .
- Valentini , R , Matteucci , G , Dolman , A J , Schulze , E D , Rebmann , C , Moors , E J , Granier , A , Gross , P , Jensen , N O , Pilegaard , K , Lindroth , A , Grelle , A , Bernhofer , C , Grunwald , T , Aubinet , M , Ceulemans , R , Kowalski , A S , Vesala , T , Rannik , U , Berbigier , P , Loustau , D , Guomundsson , J , Thorgeirsson , H , Ibrom , A , Morgenstern , K , Clement , R , Moncrieff , J , Montagnani , L , Minerbi , S and Jarvis , P G . 2000 . Respiration as the main determinant of carbon balance in European forests . Nature , 404 ( 6780 ) : 861 – 865 .
- Wang , C K , Yang , J Y and Zhang , Q Z . 2006 . Soil respiration in six temperate forests in China . Global Change Biol , 12 : 2103 – 2114 .
- Wu , D M , Schneiderman , T , Burgett , J , Gokhale , P , Barthel , L and Raymond , P A . 2001 . Cones regenerate from retinal stem cells sequestered in the inner nuclear layer of adult goldfish retina . Invest Ophthalmol Visual Sci , 42 : 2115 – 2124 .
- Xu , M and Qi , Y . 2001 . Spatial and seasonal variations of Q10 determined by soil respiration measurements at a Sierra Nevadan forest . Glob Biogeochem Cycles , 15 : 687 – 696 .
- Yuste , J C , Janssens , I A , Carrara , A and Ceulemans , R . 2004 . Annual Q10 of soil respiration reflects plant phenological patterns as well as temperature sensitivity . Global Change Biol , 10 : 161 – 169 .