
Abstract
There is little available information on lichen diversity and air quality in forests in South Korea. To address this, the present study aims to correlate corticolous lichen diversity with air quality in selected forests in South Korea. Two sites located on Jeju Island and one site located at Mt. Hambaek, Kangwon Province were selected for this study. Twenty trees representing two species (Quercus sp. and Pinus japonica) were chosen at each site. The coverage and frequency of corticolous lichens found on the selected trees were recorded by using 2500 cm2 grids. Ambient SO2, NO2, and O3 levels at each site were determined using Ogawa™ passive samplers having filter pads coated with absorbing reagents. Lichen diversity data collected on selected trees were used to formulate the index of atmospheric purity (IAP). A total of 65 lichen species were found. A negative correlation was observed between lichen diversity expressed as IAP and the concentrations of SO2, NO2, and O3 levels. The results revealed that corticolous lichens could be used as indicators to monitor the air quality of forests in South Korea on a large scale.
Introduction
Since air pollution and climate change are the main threats to maintaining the ecological health of protected areas, an effective and low cost way of measuring the impacts of these threats is required. Lichens provide a relevant, sensitive, and measurable indicator for long-term monitoring since they have been successfully used as bioindicators of environmental pollution and ecosystem health (Giordani Citation2007; Geiser et al. Citation2010; Giordani et al. Citation2012; Das et al. Citation2013).
Lichens show higher sensitivity to air quality because they are dependent on airborne nutrients and water and also lack protective structures such as cuticles found in vascular plants. Trees and other vascular plants are affected by pollution but are much slower to show impacts than lichens (Muir and McCune Citation1988). Hundreds of studies have linked lichen communities to air quality, and several long-term lichen monitoring programs, mainly in Europe and the USA but also in some tropical countries, are using lichens to assess climate change (McCune Citation2000; van Herk et al. Citation2002). According to previous studies (Caruso et al. Citation2008; Rogers et al. Citation2008; Giordani et al. Citation2012; Nascimbene et al. Citation2012; Das et al. Citation2013), there is a strong correlation of lichen abundance to ecosystem biodiversity and productivity.
To estimate levels of air pollution using lichens, two main methods were developed in the 1960s. One is the index of atmospheric purity (IAP; Gombert et al. Citation2004) and the other, known as the community approach, uses a qualitative scale for estimating levels of air pollutants, mainly SO2 (Hawksworth and Rose Citation1970). Scientists have modified these two basic methods to correlate lichen diversity with air pollution. All methods currently in use can be classified as quantitative or qualitative (van Haluwyn and van Herk Citation2002).
In the quantitative method, overall lichen composition of the sampling plot is reduced to a single IAP value as an expression of air quality (van Haluwyn and van Herk Citation2002). Low IAP values identify areas that are low in species diversity, whereas high IAP values indicate areas with high species diversity. Although IAP values are often interpreted as indicators of air pollution, differences in IAP or lichen species richness can also arise due to habitat disturbance (Gombert et al. Citation2004; Perhans Citation2009). The IAP method is useful to find out the areas in which air quality standards are regularly exceeded, and large areas can be studied without expensive apparatus or equipment (Giordani Citation2007).
In Europe, and in some tropical countries, it has been very well demonstrated that air quality has a good correlation with lichen diversity and distribution (McCune Citation2000; Geiser Citation2010; Attanayaka and Wijeyaratne Citation2013). However, there is no, or very little, information available on lichen diversity and air quality in temperate regions of northeast Asian countries. Although several taxonomical works on Korean lichen have been carried out recently, there are few records on lichen distribution related to selected pollution sources (Yu et al. Citation1995; Kim and Kang Citation2001), lichen distribution within and outside cities in relation to pollution levels (Ahn et al. Citation2011), and selection of possible lichen bioindicators for air pollution (Hur and Kim Citation2000). In the present study, attempts were made to correlate air quality and lichen diversity in selected forest areas in South Korea and to find out whether lichen can be used as an air quality indicator for forest health assessment.
Materials and methods
Study area
The first survey was carried out in South Korea during July to September 2012. Three plots (100 × 50 m) were selected in three different forest types including Quercus forest, coniferous forest, and deciduous forest (). Latitudes, longitudes, and altitudes of the three plots are given in . All the plots were located in natural forest and there are no point sources of air pollutants such as power stations or industrial sites within 10 km of the study plots.
Figure 1. Studied places, Quercus forest (•), coniferous forest (▴), and deciduous forest (★).
Table 1. Latitude, longitude and altitude of the studied plots in South Korea.
Lichen sampling
Twenty individual trees whose girth at 1.50 m is ≥ 20 cm were mapped in each site using Garmin eTrex GPS (Olathe, KS). The plant Quercus spp. was selected in Quercus forest and deciduous forest, and Pinus japonica was selected in coniferous forest. For each individual tree, its stem diameter was measured using a 5 m metal scale. The light intensity at 1.50 m was measured using Histest Lux meter model LX1010B (Union City, CA) at 2000 range. Quantification of lichens was done by placing the transparency lichen grid (50 × 50 cm) on the tree at 1.50 m ± 30 cm from ground level depending on the lichen availability. With the help of a hand lens lichen colonies behind the grid were carefully observed and located. Each colony was assigned a number while recording its area. The same lichen present outside the grid on the same tree was collected for identification. A special numbering code was marked on the lichen cover graph (transparency lichen grid) as well as lichen specimen bag using a permanent marker pen. Collected lichens were air dried in the laboratory and identified using stereo and light microscopy and with the help of chemical tests (Orange et al. Citation2010).
Pollutant monitoring
The fieldwork took place from September 2012 to June 2013. A total of 18 two-sided Ogawa™ passive samplers (Ogawa and Company, Pompano Beach, FL) were installed in groups of two per air pollutant (NO2, SO2, O3) at a height of 2.5 m, at the center of each of the three lichen sampling plots (). The samplers consist of a solid Teflon cylinder with two open unconnected ends, each containing a reactive glass-fiber filter impregnated with triethalnolamine (for NO2 and SO2) and nitrite ions (for O3). The filter is mounted between two stainless steel screens (0.152 cm2 open area, 0.02 cm thick), situated behind a diffusion barrier end cap containing 25 holes (open area 0.785 cm2, 0.6 cm thick) (www.ogawausa.com). All samplers were installed the same day, their time of installation was recorded, and they were removed 30 days after installation during the sampling period. Another group of three samplers (one sample with two filters per pollutant) was left in their airtight containers inside the refrigerator to be used as field blanks. Duplicate filters of each pollutant were extracted in deionized water and nitrite and sulphate content in each sample were determined by ion chromatography. Two field blanks were analyzed in each chromatography run, and results were corrected by subtracting the mean nitrite and sulphate level found in the blanks.
Determination of lichen diversity and IAP
The Shannon diversity index (H′) and Simpson index (D) (Magurran Citation1988) were calculated. H′ was calculated using the formula:
where pi is the proportion of species x, and ln is the natural logarithm. D was calculated using the formula:
where ni is the number of individuals in the ith species, and N is the total number of individuals. The Simpson index of diversity is measured by 1–D. The IAP formula uses the occurrence and frequency of lichens at the study sites and an ecological index for each species (Krick and Loppi Citation2002). The formula is:
where, n is the number of lichen species found at a given site, Q is the ecological index of a species or the average species richness (i.e., the average number of species that coexist with each species), and f is the number of sampled trees on which this lichen species was found at the site. The value for Q × f is divided by 10 to give a more manageable number (Johnsen and Søchting Citation1973). Data were analyzed using SPSS 18.0 software.
Results and discussion
Almost all specimens collected during the study were identified to species level. Altogether 65 species belonging to 30 genera were represented in all forest types (; ). These species types were represented by two fruticose, 22 crustose, 40 foliose, and one leprose. The highest lichen richness was observed in the Quercus forest (37 species), while the least (21 species) was observed for the deciduous forest plot. The coniferous forest plot had 27 species (). The species Lecanora sp., Lepraria sp., and Myelochroa irrugans were represented in all three forest types, while 11 species were found in both the Quercus and the Coniferous forest and 3 species were present in both the Quercus forest and the Deciduous forest (). Interestingly, one lichen species, Anaptychia tentaculata, was found as a common species in both the coniferous and the deciduous forest, in addition to the three common species found at all the sites (). The lichen species belonging to the genera Graphis, Ochrolechia, Parmelinopsis, Pertusaria, and Pyrenula were found only in the Quercus forest site, while the lichen genera Hypotrachyna, Lecidia, Menegazzia, and Ramalina were restricted to the coniferous forest site. The deciduous forest site provided habitat for the genera Lobaria and Leptogium. Interestingly, most of the crustose species were found only in the Quercus forest site. These habitat variations may be due to differences in light intensities, type of substrate, or elevation gradient. Brunialti and Giordani (Citation2003) have also stated that ecological factors play an important role in the growth, development, distribution, and diversity of lichen species.
Table 2. Lichen species in each plot.
Figure 2. Total number of species and lichen genera found in three forest plots.
Figure 3. Mathematical set indicating distribution of all lichen species in three forest types.
According to the number of colonies and cover values of lichen species found in the coniferous forest plot, Myelochroa aurulenta had the highest number of colonies (514) and cover value (2397.3 cm2). The second highest values of colony count (105) and lichen cover (611.5 cm2) was shown by Cladonia ramulosa. The species Ramalina yasudae and Heterodermia hyperleuca were represented by a single colony at the coniferous plot (data not shown).
Similarly, the highest cover value (3423.8 cm2) in the deciduous forest plot was observed for Myelochroa irrugans followed by M. entotheochroa (805.45 cm2). Although the highest number of colonies (217) belonged to Phaeophyscia hispidula, its cover was relatively small (372.9 cm2) compared to the other species within the deciduous forest plot. Within this site Anzia opuntiella, Collema sp., and Phaeophyscia denigrata were represented as a single colony (data not shown).
With 284 colonies Myelochroa entotheiochroa shows the highest cover value (1513.0 cm2) in the Quercus forest plot. The second highest (1245.0 cm2) was observed for Myelochroa irrugans in the same plot. The following species including Cladonia coniocraea, Heterodermia flabellata, Ochrolechia cf. africana, Parmelinopsis subalbicans, and Punctelia borreri were represented as a single colony in this plot (data not shown).
Both the Shannon diversity index (H') and the Simpson diversity index (D) consistently showed that the Quercus forest has the highest lichen diversity compared to the other two forest plots. The second highest lichen diversity was observed for the coniferous forest plot and the least was observed for the deciduous forest plot (). The Quercus forest and the coniferous forest were located at Jeju Island where relative humidity is much higher than inland on the Korean Peninsula, the site of the deciduous plot. The high humidity may positively influence lichen diversity and growth on the island. There are several factors that affect the distribution and diversity of lichens. The composition of the epiphytic lichen flora is strongly influenced by microclimate, which not only varies vertically along the trunk, but also between tree fractions, such as trunk and branches (Kermit and Gauslaa Citation2001; Coxson and Coyle Citation2003). In addition, the diversity of corticolous lichens may change due to characteristics such as tree age or tree species (Jüriado et al. Citation2003) or even due to tree health status (Hauck and Runge Citation2002).
Table 3. Variation of diversity indices, IAP, and pollutant concentrations within each forest plot.
The highest average SO2 concentration (6.74 ppb) was observed in the deciduous forest, while the lowest (1.80 ppb) was observed in the Quercus forest. Similarly, the highest average NO2 concentration (0.64 ppb) and the lowest concentration (0.24 ppb) were observed for the coniferous forest followed by the Quercus forest. Variation of O3 concentration within the study sites showed quite a different pattern. The highest O3 concentration (27.49 ppb) was recorded from the Quercus forest, and the lowest (21.23 ppb) was recorded in the coniferous forest (data not shown). However, all three pollutant concentrations recorded were very low when compared to air pollutant limits in South Korea (i.e., SO2 ≤ 0.05 ppm, NO2 ≤ 0.06 ppm, O3 ≤ 0.06 ppm; Airkorea Citation2014). Thus, the average concentration of NO2, SO2, and O3 observed for the period of 9 months indicates that the air quality in all the forests is comparatively high (). These findings are further confirmed when compared with the work recently carried out by Ahn et al. (Citation2011) in Seoul. According to their findings, only four lichen species were recorded from six parks around the Seoul city center with somewhat higher SO2 (40–60 ppb), NO2 (10–50 ppb), and somewhat less O3 (< 10 ppb) pollutant concentrations. Although more recent information about pollution levels in South Korea are not available, the general trend has been one of decreasing air pollution levels since 1995 (Airkorea Citation2014).
Figure 4. Variation of average pollutant concentration and diversity indices among the plots.
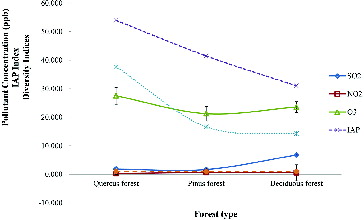
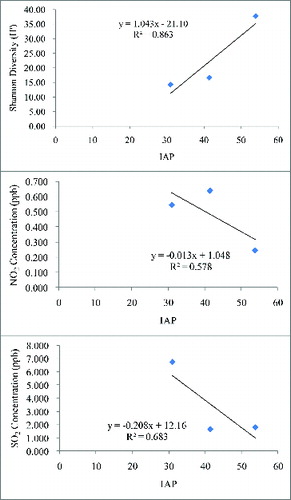
The IAP values obtained for the three forest plots are given in . According to these values the lowest and the highest IAP values were shown by the deciduous forest (30.98) followed by the Quercus forest (53.93). IAP values negatively correlated with all the SO2 (r2 = 0.68) and NO2 (r2 = 0.58) concentrations at all forest plots (). Not only the IAP values but also the diversity values of lichen correlated negatively with pollutant concentrations (data not shown). Furthermore, lichen diversity was positively correlated (r2 = 0.86) with the IAP value (). This indicates that higher IAP values always represent good air quality in a particular place. Many researchers have used IAP to monitor the effects of atmospheric pollutants (especially SO2 and NO2) on living organisms (Krick and Loppi Citation2002; Gombert et al. Citation2004). The results obtained for IAP in this study are somewhat similar to those of LeBlanc et al. (Citation1974) and Attanayaka and Wijerathne (Citation2013). According to their findings, the lower IAP values and higher IAP values were obtained for highly disturbed city center sites, followed by the rural areas.
Figure 5. Correlation of lichen diversity, NO2, and SO2 concentrations with IAP.
According to Conti and Cecchetti's (Citation2001) categorization of air quality levels based on IAP values, the Quercus forest site IAP value falls into Level E (IAP > 50), which indicates a very low level of pollution. IAP values at Coniferous forest falls into Level D category (37.5 < IAP ≤ 50), which indicates a low level of pollution. On the other hand, IAP values at Deciduous forest corresponds to Level C category (25 < IAP ≤ 37.5), which indicates a moderate level of pollution. Thus, a high IAP value indicates better air quality. However, as our study was carried out in a temperate region of northeast Asia, Conti and Cecchetti's categorization may not be applicable due to different climate conditions and lichen species composition from northeast Asia. Therefore, we need to develop our own IAP categories which would be applicable to the temperate regions of northeast Asia.
During the study, the lichen Myelochroa irrugans was found as the most abundant species at all three sites. Therefore, this species could be selected as a widespread air quality bioindicator. However, further studies need to be carried out within South Korea including polluted metropolitan areas such as Seoul, Busan, and Gwangju to make a good comparison and to find out more pollutant tolerant or sensitive lichen indicators.
Conclusion
The present study was conducted to correlate corticolous lichen diversity with air quality in selected places in South Korea. A negative correlation was observed between lichen diversity expressed as IAP and the concentrations of SO2, NO2, and O3 levels at the study sites. According to the results of this study, it can be concluded that the ambient air quality in the study areas is high. Furthermore, the IAP values indicate that forest health in the selected areas is good, with high lichen diversity. Therefore, corticolous lichens could be used as indicators to monitor the air quality of forests in South Korea on a large scale.
Acknowledgments
This work was supported by the Korean Forest Service Program through Korea Forest Research Institute and Korean National Arboretum [KNA 2013]. Author UJ thanks Mr. Woo Jung Jae for calculating cover values of lichens.
Disclosure statement
No potential conflict of interest was reported by the authors.
References
- Ahn C, Chang E, Kang H. 2011. Epiphytic macrolichens in Seoul: 35 years after the first lichen study in Korea. J Ecol Field Biol. 34:381–391.
- Airkorea. 2014. http://www.airkorea.or.kr/airkorea/eng/realtime/main.jsp?item=khai.
- Attanayaka ANPM, Wijeyaratne SC. 2013. Corticolous lichen diversity, a potential indicator for monitoring air pollution in tropics. J Natn Sci Foundation of Sri Lanka. 41:131–140.
- Brunialti G, Giordani P. 2003. Variability of lichen diversity in a climatically heterogeneous area (Liguria, NW Italy). Lichenologist. 35:55–69.
- Caruso A, Rudolphi J, Thor G. 2008. Lichen species diversity and substrate amounts in young planted boreal forests: a comparison between slash and stumps of Picea abies. Biol Conserv. 141:47–55.
- Conti ME, Cecchetti G. 2001. Biological monitoring: lichens as bioindicators of air pollution assessment: a review. Environ Pollut. 114:471–492.
- Coxson DS, Coyle M. 2003. Niche partitioning and photosynthetic response of alectorioid lichens from subalpine spruce-fir forest in north-central British Columbia, Canada, and the role of canopy microclimate gradients. Lichenologist. 35:157–175.
- Das P. Joshi S, Rout J. Upreti DK 2013. Lichen diversity for environmental stress study: application of index of atmospheric purity (IAP) and mapping around a paper mill in Barak Valley, Assam, northeast India. Trop Ecol. 54 (3):355–364.
- Geiser LH, Jovan SE, Glavich DA, Porter MK. 2010. Lichen-based critical loads for atmospheric nitrogen deposition in western Oregon and Washington forests, USA. Environ Pollut. 158:2412–2421.
- Giordani P. 2007. Is the diversity of epiphytic lichens a reliable indicator of air pollution? A case study from Italy. Environ Pollut. 146:317–323.
- Giordani P, Bruniati G, Bacaro G, Nascimbene J. 2012. Functional traits of epiphytic lichens as potential indicators of environmental conditions in forest ecosystems. Ecol Indic. 18:413–420.
- Gombert S, Asta J, Seaward MRD. 2004. Assessment of lichen diversity by index of atmospheric purity (IAP), index of human impact (IHI) and other environmental factors in an urban area (Grenoble, southeast France). Sci Total Environ. 324:183–199.
- Hauck M, Runge M. 2002. Stem flow chemistry and epiphytic lichen diversity in dieback affected spruce forest of the Harz Mountains, Germany. Flora. 197:250–261.
- Hawksworth DL, Rose F. 1970. Qualitative scale for estimating sulphur dioxide air pollution in England and Wales using epiphytic lichens. Nature. 227:145–148.
- Hur JS, Kim PG. 2000. Investigation of lichen species as a biomonitor of atmospheric ozone in ‘Backwoon’ mountain, Korea. J Kor Forest Soc. 89:65–76. (in Korean)
- Johnsen I, Søchting U. 1973. Air pollution influence upon the epiphytic lichen vegetation and bark properties of deciduous trees in the Copenhagen area. Oikos. 24:344–351.
- Jüriado I, Paal J, Liira J. 2003. Epiphytic and epixylic lichen species diversity in Estonian natural forests. Biodivers Conserv. 12:1587–1607.
- Kermit T, Gauslaa Y. 2001. The vertical gradient of bark pH of twigs and macrolichens in a Picea abies canopy not affected by acid rain. Lichenologist 33:353–359.
- Kim JH, Kang SK. 2001. Estimation of air pollution by lichens in Chongju. J Kor Geogr Soc. 36:313–328. (in Korean)
- Krick R, Loppi S. 2002. The IAP approach. In: Nimis PL, Scheidegger C, Wolseley PA, editors. Monitoring with lichens – Monitoring Lichens. Dordrecht, the Netherland: Kluwer Academic Publishers; p. 21–37.
- LeBlanc F, Robitaille G, Rao D. 1974. Biological response of lichen and Bryophytes to environmental pollution in the Murdochville Copper mines area, Quebec. J Hattori Bot Lab. 38:405–433.
- Magurran AE. 1988. Ecological diversity and its measurements. Princeton: Princeton University Press.
- McCune B. 2000. Lichen communities as indicators of forest health. Bryologist. 103:353–356.
- Muir PS, McCune B. 1988. Lichens, tree growth, and foliar symptoms of air pollution: are the stories consistent? J Environ Qual. 17:361–370.
- Nascimbene J, Nimis PL, Benesperi R. 2012. Mature non-native black-locust (Robinia pseudoacacia L.) forest does not regain the lichen diversity of the natural forest. Sci Total Environ. 421–422:197–202.
- Orange A, James PW, White FJ. 2010. Microchemical methods for the identification of lichens. 2nd ed. London: British Lichen Society.
- Perhans K, Appelgren L, Jonsson F, Nordin U, Söderström B, Gustafsson L. 2009. Retention patches as potential refugia for bryophytes and lichens in managed forest landscapes. Biol Conserv. 142:1125–1133.
- Rogers PC, Ryel RJ. 2008. Lichen community change in response to succession in aspen forests of the southern Rocky Mountains. Forest Ecol Manag. 256:1760–1770.
- Yu JH, Ka KH, Park H. 1995. Air pollution effects on soil chemical properties, lichens, denitrifying and sulfur reducing bacteria around the Yeochun industrial estate. J Kor Forest Soc. 84:178–185. (in Korean)
- van Herk CM, Aptroot A, van Dobben HF. 2002. Long–term monitoring in the Netherlands suggests that lichens respond to global warming. Lichenologist. 34:141–154.
- van Haluwyn C, van Herk CM. 2002. Bioindication: the community approach. In: Nimis PL, Scheidegger C, Wolseley PA, editors. Monitoring with lichens – monitoring lichens. Dordrecht, the Netherland: Kluwer Academic Publishers; p. 39–64.