
Abstract
Geospatial information of small mangrove islands in the Philippines is usually lacking. Such information is vital to monitor mangrove cover change and craft plans for their sustainable management. This study was conducted to provide some land use information about Banacon Island in Bohol province. The island is renowned for its vast mangrove plantations, community-initiated reforestation, and double reef system. To determine the different forest land uses therein, the study employed a maximum likelihood classification method using two Landsat images of different periods. Results revealed three distinct forest land uses, namely: dense mature stand; dense intermediate stand; and sparse mangrove area. Land use change detection analysis was also conducted. Findings suggest that mangrove cover has generally improved from 1993 to 2004, as seen in the expansion of dense plantations over sparsely vegetated areas. Such change is attributable to continuous reforestation activities by the local community. Minor deforestation was also recorded due to various natural and anthropogenic causes. Comparing the area of deforestation with the increase in plantations, the results suggest that reforestation has compensated or exceeded the rate of cover loss. In order to further improve the geospatial results, the study recommends the use of high resolution images covering other years for better analysis of land use change.
Introduction
Mangrove forest is one of the world's most productive ecosystems. It contains a diverse group of halophytic species belonging to eight different families (Lugo and Snedaker Citation1974). Mangroves also enrich coastal waters, yield commercial forest products, protect coastlines, and support coastal fisheries. About 55% of the world's population lives on mangrove ecosystems and draw heavily from their goods and services. In a less documented role, mangrove trees also regulate flooding, erosion, siltation, and tidal surges, thereby providing habitats for humans and countless other organisms. Nearly two-thirds of all kinds of commercial fishes also depend on mangroves for their growth, reproduction, and survival.
The proximity of mangroves to population centers leads to their massive degradation and loss. In many regions, mangrove areas are used for sewage disposal, are converted to human settlement and industrial sites, and excavated for aquaculture ponds. Globally, there are only 15.2 million ha of mangroves left, and deforestation of c. 102,000 ha year−1 is alarming (FAO Citation2007). Massive loss was reported in Asia of about 1.9 million ha since 1980. In some regions, mangrove areas are already in the danger of complete collapse (Kathiresan and Bingham Citation2001).
The Philippines shares a similar story because 70% of its original mangrove forest has been lost over the past century. Overharvesting of mangrove trees for fuelwood, charcoal, and pole, and conversion of mangrove areas to fish ponds, are the main drivers of mangrove deforestation (Brown and Fischer Citation1920; Chapman Citation1976; Primavera Citation2000; Gevana and Pampolina Citation2009). Today, Philippine mangroves cover c. 247,362 ha with an annual deforestation rate of 0.8%. Notwithstanding this historical decline, deforestation is now showing signs of easing because of the appreciation of the need to conserve broader values such as ecotourism, biodiversity, and carbon sequestration. Further, the adoption of community-based forest management programs in conserving rural coastal areas has spurred efforts to restore degraded mangroves and protect the remaining stands by local communities. This progress must continue to ensure the sustainable delivery of key ecological and economic benefits. Moving forward on this aim, however, demands sufficient information about mangrove forests’ status. This is where geospatial information is needed. Information about land cover and trends of forest cover changes could provide a yardstick for better crafting of policies and programs, most especially related to community development. Geospatial information on forest cover or land use and land use changes in a small island mangrove site of Banacon Island in the Philippines could also demonstrate the potential of the mangrove ecosystem in climate change mitigation.
Materials and methods
Study site
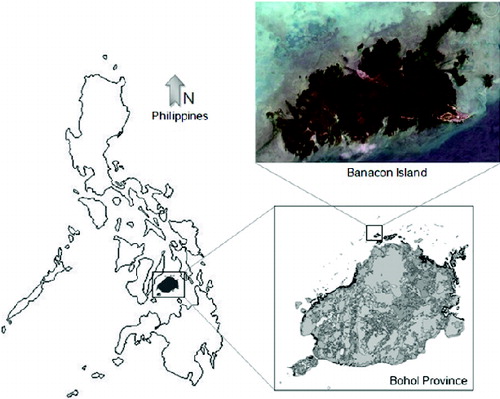
Banacon Island is located at the northwestern part of Bohol Province covering two small barangaysFootnote namely, Banacon and Jagoliao that are home to at least 300 households (). It has an area of c. 660 ha, which lies along 10°03′30″–10°15′30″ N and 124°03′30″–124°14′30″ E, and forms part of the eco-diverse protected marine sanctuary of Danajon Double Barrier Reef (Pichon Citation1977). Roughly 1115 ha of the nearby marine protected sandbars and seagrasses were additionally devolved by the Department of Environment and Natural Resources (DENR) and Municipal Government of Getafe to the local community as expansion sites for their mangrove plantation projects. The island is also renowned as one of the largest mangrove plantations in Asia (Camacho et al. Citation2011). Its climate belongs to Type IV of the Corona Classification which depicts ‘no distinct dry season’. Its sediment is typically sandy to mud with pH ranging from 7.65 to 8.59.
Figure 1. Location map of Banacon Island, Bohol, Philippines.
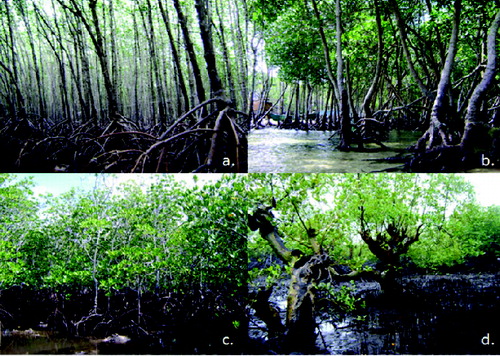
Banacon Island is primarily composed of two vegetation types: plantation; and natural forest stands (). Plantation is mainly composed of Rhizophora stylosa, locally known as bakhau. This species is very adaptive to high saline sand and corraline substrates. It is also resilient against frequent tidal surges compared with other Rhizophora species. Ages of these plantations range from newly planted to 55-year-old mangroves. Sparse natural mangroves are also common on the island. Trees that belong to Avicennia and Sonneratia genera predominate these stands. Sparse natural mangroves are common along subtidal sediments and shallow mudflats. They also serve as the main source of fuelwood for the local people.
Figure 2. General view of mangrove forest in Banacon Island. A, B, Dense mature stand 30 to 55-years-old; C, dense intermediate stand ≤ 29-years-old; D, sparse mangrove area.
Data acquisition and analysis
Land use classification and land use change detection was performed following the methodological framework in . This framework suggests the straightforward sequence for analyzing remotely sensed images. Image analysis was done using ENVI 4.3 (ITT Visual Information Solutions, Boulder, CO); while final maps were created using ARCGIS 9.2 (ESRI, Redlands, CA).
Figure 3. Methodological framework for analyzing remotely sensed data.
Data availability
Landsat 5 TM images were used to generate geospatial information of the study site (). These images can be freely accessed online from the US Geological Survey (USGS) Earth Resources Observation and Science Center (http://earthexplorer.usgs.gov/). However, only two datasets (for 1993 and 2004) were used for image classification and change detection analyses as other Landsat scenes for the study site have either scan line errors or severe cloud cover. Budgetary constraints to purchase images from other commercial sources (e.g.. IKONOS) had also limited the data acquisition. Hence, the 2004 image was therefore temporarily used as the platform for current ground-truthing or validation, recognizing that large portions of plantations and sparse natural mangrove areas remained almost intact when compared with the latest image shown from Google Earth v4.3.7284.3916 in 2012 and findings of field validation. However, this was underlined as a major limitation of the study since there had been considerable changes in mangrove cover from 2004 to 2012.
Table 1. List of land satellite images used in the study.
Image preprocessing
Satellite images were orthorectified and projected to UTM 51 N coordinate system and WGS 1984 datum. Image sharpening was not done because of the superb quality of images in terms of intensity, hue, saturation, and sharpness. However, radiometric correction was performed to minimize innate internal (remote sensors of Landsat pre-lunch and in-flight adjustments) and external (effect of atmosphere, terrain, aspect, etc.) errors on the images. Radiometric improvement included radiance (Equation [1]) and reflectance (Equation [2]) corrections as suggested by Chander and Marksham (Citation2003):
(1) where Lλ is cell value as radiance, Qcal is digital number that users receive with Level 1 Landsat products, LMINλ is spectral radiance scales to Qcalmin, LMAXλ is spectral radiance scales to Qcalmax, Qcalmin is the minimum quantized calibrated pixel value (typically 1), and Qcalmax is the maximum quantized calibrated pixel value (typically 255).
(2) where Pλ is unitless planetary reflectance, Lλ is spectral radiance (from earlier step), D is Earth–Sun distance in astronomical units, ESUNλ is mean solar exoatmospheric irradiances, and Θs is solar zenith angle.
Image classification and detection
Supervised classification of Landsat 5 TM images was performed using maximum likelihood algorithm with ENVI 4.3 (ITT Visual Information Solutions, Boulder, CO, USA). According to Bolstad and Lillesand (Citation1991), this approach is the most statistically robust in assessing remotely sensed images. The procedure is based on Bayes Theory of Joint Probabilities that accounts marginal distributions of datasets and their respective internal correlations under the assumption of multivariate normality in N-dimensional Euclidean space (Conese and Maselli Citation1992).
Selection of end-member training dataset for pixel-based classification was performed for initial classification of land, water, and vegetation features. Determination of specific forest land cover types (e.g., plantation, natural stand, and sparse mangrove area) was based on the rough site characterization done by Camacho et al. (Citation2011) for carbon stock assessment study. At least 1.90 level of training data separability among training data was observed to yield better classification results.
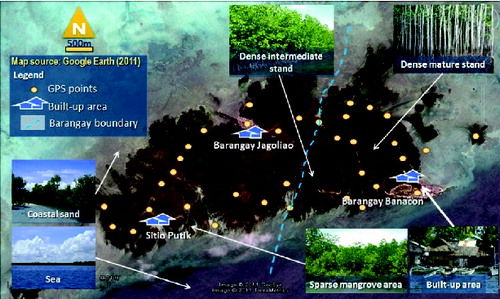
To measure the accuracy of classification results, 81 ground-truth or reference points were collected using Garmin Etrex GPS Receiver (Garmin Inc. Kansas City, KS). This activity was done from June to November 2012. Reiterating the foreseen limitation in classifying the older image (2004) using recent (2012) ground-truth points, this study temporarily dismissed the likely differences in growth and forest cover expansion because of three major premises. First, Rhizophora trees grow at a very slow rate of 0.26 ± 0.01 cm yr−1 (Saenger Citation2002). Second, new plantations from year 2000 were established outside the main island (the area being assessed and classified in this study); hence, not much increase in forest cover (in terms of dense intermediate stands) was expected. Finally, land use classification for the 2004 satellite image coincided well with recent data such as ground-truth points, information from key informant interviews, and Google Earth image comparison. Consequently, six major classes or attributes that are relevant for image classification were identified ().
Figure 4. Year 2012 Google Earth image showing land and sea attributes of Banacon Island; identification based on ground-truthing, key informant interviews, and site characterization of Camacho et al. (Citation2011).
Accuracy testing
Accuracy test was also performed using ENVI4.3 (ITT Visual Information Solutions, Boulder, CO) to assess the validity of the supervised classification performed. Classification results were compared with ground data to assess the likely errors. There were two types of errors measured, as suggested by Congalton (Citation1991). Omission error was assessed to determine the percentage of pixels that should have been put into a given class but were not. On the other hand, commission error was computed to determine the percentage of pixels that were placed in a given class that should actually belong to other class. Both these errors also reflect user's accuracy and producer's accuracy. User's accuracy indicates the probability that a given pixel will appear on the ground as it is classed, while producer's accuracy represents the percentage of a given class that is correctly identified on the map. Kappa index (k) was also obtained to further describe the proportion of agreement between the classification and the validation results after random agreements by chance are removed to consider these data (Bishop et al. Citation1975). Values range from 1 (which indicates a perfect agreement) to –1 (which then indicates no agreement at all). Null value or 0 represents agreement which is exactly equal to the agreement that can be expected by chance. Kappa index can be measured by:
(3) where k is kappa index, and Xii is sum of diagonal inputs of error matrix.
Land use change analysis
Likely changes in forest cover were assessed by comparing the results of pixel-based classification of two Landsat 5 TM images (for 1993 and 2004). Change detection was done using ENVI 4.3 (ITT Visual Information Solutions, Boulder, CO) and ARCGIS 9.2 (ESRI, Redlands, CA).
Results and discussion
Image preprocessing
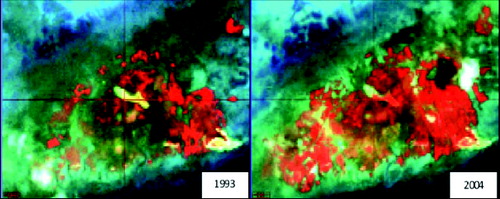
Using gain and offset parameters, band radiances were re-scaled back to their correct values. Reflectance correction using ρλ values was also performed to address the environmental distortion effects in the satellite images. Corrected images are shown in .
Figure 5. Radiance and reflectance calibrated images.
Vegetation cover classification
Results of classification revealed three major classes: forest; coastal sand (including built-up areas); and sea (). Forest was further classified into three types: dense mature stand; dense intermediate stand; and sparse mangrove area (). Dense mature stand was primarily composed of R. stylosa plantations with ages of at least 30 years and stand density of 100 stems m−2. Old natural stands composed of huge diameter Avicennia and Sonneratia sp. were also identified in this class. Tree diameter and height of these stands ranged from 4.1 to 68.2 cm and 4.5 to 12 m, respectively. Similarly, dense intermediate stand was predominantly R. stylosa plantations with ages 15- to 29-years-old and stand density of 149 to 324 stems 100 m−2. Tree diameter and height range of these stands ranged from 2.1 to 11.0 cm and 5 to 8 m, respectively. Lastly, sparse mangrove area was natural vegetation with around 100 stems 100 m−2. The most common species found in this vegetation include stunted (< 10 cm diameter, < 6m height) Avicennia marina, Avicennia marina var. rumphiana, and Sonneratia alba. Thinned portions or gaps in R. stylosa plantations were classified under this category.
Table 2. Area distribution of land and sea attributes of Banacon Island in 1993 and 2004.
Figure 6. Forest land use map of Banacon Island in 1993 and 2004.
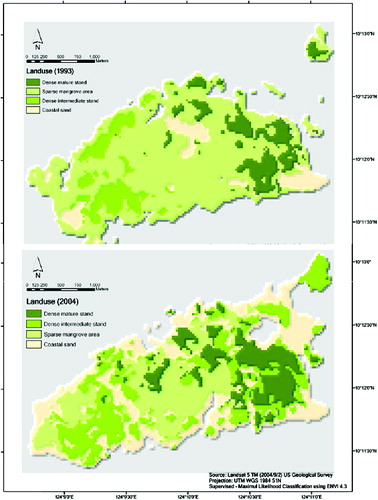
Based on the 1993 image, sparse mangrove area was largest among the forest cover classes with 393.2 ha. It was found commonly from western to middle sectors of the island. Dense mature stand covered c. 80 ha. This stand was frequent in the eastern sector of the island surrounding the built-up areas. Finally, dense intermediate stand was estimated at c. 66.5 ha in the western sector. Non-forest classes such as sea and coastal sand covered c. 952 ha and 56.7 ha, respectively.
In view of the 2004 image, sparse mangrove area remained the largest among forest cover classes with 173.9 ha. Dense intermediate stand followed with 172.0 ha, which are now also common in the western and central sectors. Dense mature stand remained common in the eastern sector with 113.0 ha. Non-forest classes showed 886.2 ha for sea and 203.2 ha for coastal sand.
Classification accuracy
An overall accuracy of 80.6% and kappa index of 0.66 were achieved in the classification of the 1993 image. Errors in the image classification were obtained for dense intermediate stand with a producer accuracy of only 29.7%. Misclassifications were due to difficulties in classifying the boundaries between dense intermediate stand, sparse mangrove area, and dense mature stands (). Commonly, intermediate stands overlap with other forest cover classes because they portray the transition stage between sparse mangrove area to dense mature stand. On the other hand, fairly accurate classification was achieved in the 2004 image with an overall accuracy of 75% and kappa index of 0.62. Most of the errors were due to misclassification among dense intermediate stand, sparse mangrove area, and coastal sand that yielded producer accuracy of 39.2%, 44%, and 72.7%, respectively. The difficulties of classifying the transition zones between coastal sand to sparse mangrove areas, and sparse mangroves to intermediate stands were due to the limited resolution of the satellite images used. This therefore suggests the need to revalidate these results using high resolution maps.
Table 3. Accuracy level of supervised classification.
Vegetation cover change
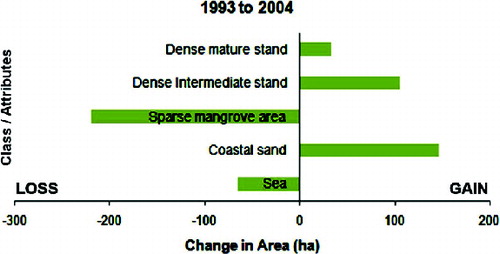
The comparison of two images revealed that mangrove cover has improved after a decade, as seen in the expansion of dense mature and intermediate stands (; and ). In total, dense forest cover has increased from 146.5 ha to 285 ha from 1993 to 2004. The area covered by dense mature stand has increased by 41%, which can be attributed to maturation of dense intermediate stand (17%). More than half (59%) of its original cover was also retained owing to protection activities of Banacon Fisherfolks and Mangrove Planters Association or BAFMAPA (a local people's organization), particularly forest patrolling around the plantation areas that are within 0.5 km of their office. However, about 20% of it also became sparse at the northeastern sector where there were fewer protection activities. Domestic cutting for poles and fuelwood on this site was the major cause of this loss. It is estimated that at least 120 trees a month are being harvested by the local community for seaweed poles, house construction posts, and fuelwood. This contributes to 1.6 ha yr−1 denudation in the area. Roughly 21% became dense intermediate stand, which indicates that sparse and bare areas were immediately replanted after timber extraction. Comparing this loss with the rate of plantation development (3 ha yr−1), planting has exceeded cutting by a net rate of 1.4 ha yr−1.
Table 4. Percentage distribution of 2004 land uses reflecting the contribution from various land uses in 1993 (as baseline).
Figure 7. Major exchanges in area (%) among mangrove land uses between 1993 and 2004.
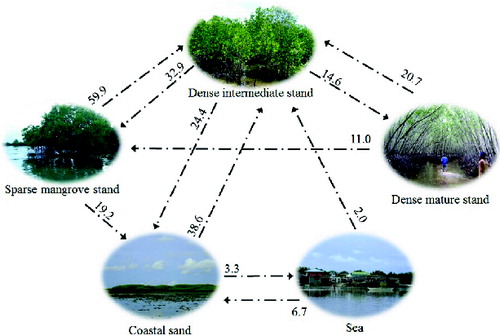
Figure 8. Change in attributes between 1993 and 2004.
Dense intermediate stand has also expanded by 61%, which is mainly due to reforestation activities. However, at least 40 ha of original cover has been lost, mainly due to cutting for fuelwood because electricity and gas supply services are still absent on the island. Fuelwood harvesting (whole tree chopped into fuelwood pieces) was estimated to be at least 156 trees a year. This contributes to not less than 3 ha yr−1 deforestation rate in the area. Young trees are also being cut for seaweed fences at a rate of 200 trees per household per year. Comparing this estimate with the progress in plantation establishment, there is a net change of 7.5 ha yr−1 on this stand, indicating that reforestation was able to compensate for the area that had been lost due to cutting.
About 85% of the sparse mangrove area was converted to other classes. The largest part of this area (60%) became dense intermediate plantation in 2004 with a rate of about 11 ha yr−1 because of planting. Conversely, 19% became bare area or coastal sand particularly along the peripheries of the island.
The increase in coastal sandy areas can be attributed to two likely reasons. Information obtained from key informant interviews revealed that: (1) young regenerants of Avicennia and Sonneratia were naturally removed in the southwest monsoon (June to September) when storms and strong tides are more frequent; and (2) cutting of mature trees for fuelwood has opened more spaces in already sparsely vegetated sites that were not replanted. An estimated 146.7 ha was added to this class. However, comparing this loss with the expansion of plantations, at least 30 ha or a net change of 2.8 ha yr−1 was estimated which also suggests that planting efforts by the local community was able to offset denudation. A small portion (66 ha) of the sea area was also classified as coastal sand (6.7%), sparse mangrove (2.3%), and plantation stand (2.1%) in the 2004 image. Seaward expansion of plantations over this site was estimated at 4.5 ha or 0.4 ha yr−1.
Conclusions and recommendations
Supervised classification using a maximum likelihood approach revealed three distinct forest land uses in Banacon: dense mature stand; dense intermediate stand; and sparse mangrove area. Dense stands were primarily composed of monoculture plantations of R. stylosa while sparse mangrove areas were natural stands predominated by Avicennia and Sonneratia sp. Large sections of sparse mangrove area were converted to dense plantations because of the continuous planting by the local community. This has compensated the rate of thinning for pole and fuelwood. Overall, the expansion of plantations suggest that forest cover has improved after a decade. In order to refine these findings, high resolution images (other than Landsat sources) are needed to minimize the errors committed in classifying the overlaps between the classes identified. Furthermore, acquiring satellite images for other years (particularly the most recent) will also help validate and enrich the findings obtained.
On the management side, the results of this study could serve as a basis for sustainable planning and implementation of Community Based Forest Management Agreement (CBFMA) projects. Denuded portions of the stands should be targeted for future reforestation in order to avoid detrimental impacts on marine biodiversity. Furthermore, the island also possesses good ecotourism potential because of its scenic mangrove plantations and double barrier reef ecosystem. For this reason, proper zoning of mangroves into productive (tree plantations and seaweed farms), protective (tidal buffer), and ecotourism zones is necessary to achieve effective forest management. Finally, local government should hasten its work in providing electrification facilities in the area to help ease the dependency of the local community on mangrove fuelwood.
Note
Acknowledgments
This research was made possible through the ASEAN-Korea Environmental Cooperation Project (AKECOP) and the assistance of the Banacon Fisherfolks and Mangrove Planters Association (BAFMAPA) and DENR-CENRO Talibon, Bohol.
Disclosure statement
No potential conflict of interest was reported by the authors.
Notes
1. Barangay pertains to village or smallest political or administrative division in the Philippines.
References
- Bishop Y, Fienberg S, Holland P. 1975. Discrete multivariate analysis: theory and practice. Cambridge, MA: MIT Press. 557 pp.
- Bolstad P, Lillesand T. 1991. Rapid maximum likelihood classification. Photogrammetric Engineering Remote Sensing. 57:67–74.
- Brown WH, Fischer AF. 1920. Philippine mangrove swamps. In: Brown W.H. (Ed.), Minor products of Philippine forests I, Bureau of Forestry Bulletin. 22:9–125.
- Camacho L, Gevaña D, Carandang A, Camacho S, Combalicer E, Rebugio L, Youn Y. 2011. Tree biomass and carbon stock of a community-managed mangrove forest in Bohol, Philippines. Forest Science and Technology. 7(4):161–167.
- Chander G, Markham B. 2003. Revised Landsat-% TM radiometric calibration procedures and postcalibration dynamic ranges. IEEE Trans Geosci Remote Sens. 41(11):2674–2677.
- Chapman VJ. 1976. Mangrove vegetation. New York: J. Cramer, Vaduz. 477 p.
- Conese C, Maselli F. 1992. Use of error matrices to improve area estimates with maximum likelihood classification procedures. Remote Sens Environ. 40:113–124.
- Congalton R. 1991. A review of assessing the accuracy of classifications of remotely sensed data. Remote Sens Environ. 37(1): 35–46.
- FAO. 2007. The world's mangrove: 1980–2005: A thematic study prepared in the network of the Global Forest Resource Assessment 2005. FAO Paper No. 153. Food and Agriculture Organization. Rome.
- Gevaña D, Pampolina N. 2009. Plant Diversity and Carbon Storage of a Rhizopora Stand in Verde Passage, San Juan, Batangas, Philippines. Environment Sci Manag. 12(2):1–10.
- Kathiresan K, Bingham B. 2001. Biology of mangroves and mangrove ecosystems. Adv Mar Biol. 40:81–251.
- Lugo A, Snedaker SC. 1974. The ecology of mangroves. Annual Review of Ecology and Systematics 5:39–65.
- Pichon M. 1977. Physiology, morphology and ecology of the Double Barrier reef of North Bohol (Philippines). Proceedings of the Thirds International Coral Reef Symposium, Miami, USA. pp. 261–267.
- Primavera JH. 2000. Development and conservation of the Philippine mangroves: Institutional issues. Ecol Econ. 35:91–106.
- Saenger P. 2002. Mangrove ecology, silviculture and conservation. Dordrecht, The Netherlands: Kluwe Academic Publishers. 360pp.