
Abstract
The objective of this study was to estimate crown closure using different satellite images, Landsat TM and QuickBird. As reference data, forest cover type map were used in the study, and two different methods were used to determine the crown closure. First, to classify crown closures from satellite images, a supervised classification method was used. Second, the linear mixture modeling (LMM) fuzzy classification method was used to determine the stand crown closure. Landsat TM and QuickBird data were used in this frame. The training dataset was derived from a fine spatial resolution land cover classification of QuickBird imagery. This classification was combined to estimate the percentage crown closure in Landsat TM spatial resolution. The research also focused on classifying and mapping the crown closure classes with the spatial analysis functions of geographical information systems (GIS). The results showed that the QuickBird image had the highest classification accuracies compared to the spatial analyses results of Landsat TM and fuzzy classification.
Introduction
For several decades remote sensing has played an important role in forestry in terms of understanding, monitoring, and managing forest resources (Chubey et al. Citation2006; Günlü et al. Citation2008). The classical approach of deriving forest inventory data through survey studies and manual interpretation of aerial photographs is generally expensive, cumbersome, and time-consuming (Chubey et al. Citation2006). Although the traditional forest inventory has long provided trustworthy forest ecosystem information, it is costly in terms of time and resources, and often does not fulfill the information requirements for other forest values in terms of detail, accuracy, and currency (Chubey et al. Citation2006). However, remote sensing and geographical information systems (GIS) provide new and reliable opportunities for forest inventory and forest ecosystem values, and it has long been considered a low-cost in large forest areas (Franklin et al. Citation2003). In this context, an alternative to surveying and interpreting aerial photographs in forestry is to use remotely sensed data.
According to conventional inventory methods, significant forest metrics including stem volume, basal area, height, increment, crown closure, and diameter at breast height are assessed at these stands by measuring sample plots using personal experience (Hyyppa et al. Citation2000). In recent years, remote sensing has been applied with success for large-area applications of forest ecosystem inventories such as land use and land cover change (Kammerbauer and Ardon Citation1999; Chen et al. Citation2001; Sader et al. Citation2001; Çakır et al. Citation2008; Keleş et al. Citation2008), age (Jensen et al. Citation1999; Franklin et al. Citation2003; Chubey et al. Citation2006) crown closure (Spanner et al. Citation1990; Franklin et al. Citation2003; Pu et al. Citation2003; Andersen et al. Citation2005; Chubey et al. Citation2006), height (Hyyppa et al. Citation2000; Franklin et al. Citation2003; Chubey et al. Citation2006), and stem volume (Gemmel Citation1995; Hyyppa et al. Citation2000; Reese et al. Citation2002; Poulain et al. Citation2010). A few studies have been focused on estimating forest cover change and stand parameters such as development stages and crown closure at the same time using different remotely sensed data.
Crown closure is defined as the percentage of forest canopy projected on a horizontal plane over a unit ground area, and becomes a very important parameter in developing forest, ecological, hydrological, and climate models. However, its measurement in the field is troublesome, time-consuming, and expensive (Pu et al. Citation2003). In this context, remote sensing is an alternative to field measurements in accurate crown closure estimation (Franklin et al. Citation2003).
The main objective of this study was to estimate the accuracy of different remote sensing data and different methods for the retrieval of stand crown closure in a forest ecosystem. The research also focuses on classifying and mapping the crown closure. Furthermore, crown closure classes determined by forest cover type maps and remote sensing methods were compared and discussed to evaluate the potential use of remote sensing methods.
Materials and methods
Study area
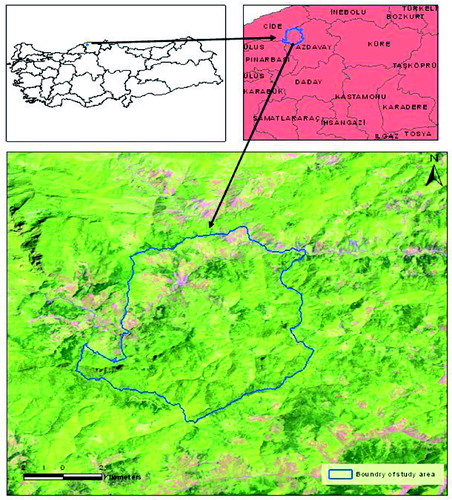
The study area is located in the Kızılcasu Forest Management Unit, which covers 7950 ha of the central Black Sea Region of Turkey (). The average slope of the study area is 38%. The altitude ranges from 240 to 1500 m above sea level. The vegetation consists of forest dominant species such as Oriental Beech (Fagus orientalis L.), fir (Abies nordmanniana [Stev.] Spach. subsp. bornmuelleriana [Mattf.]), Scotch Pine (Pinus sylvestris L.), Common Hornbeam (Carpinus betulus L.), Anatolian Crimean pine (Pinus nigra Arnold. subsp. pallasiana [Lamb.] Holmboe), Platanus orientalis, and oak species. The mean annual temperature of the study area is 13.4 °C and the mean annual precipitation is 1229.5 mm. The main soil types are sandy clay loam and clay loam.
Figure 1. Map of the study area.
Data preparation
Landsat TM and QuickBird satellite image were used in this study. The first was the moderate resolution image from Landsat TM acquired on 15 August 2008 and the second image was the high spatial resolution satellite image from QuickBird acquired on 6 September 2008. The first six bands were: visible (blue, red, green); NIR (near infrared wavelength); and MIR (middle infrared wavelengths) data of the Landsat TM sensor with a spatial resolution of 30 m. The QuickBird satellite image consisted of four multispectral bands (blue 0.45–0.52 μm, green 0.52–0.60 μm, red 0.63–0.69 μm, and NIR 0.76–0.90 μm) with a spatial resolution of 2.4 m and a panchromatic image (0.45–0.90 μm) of 0.6 m × 0.6 m. A panchromatic band with four spectral bands was fused through IHS transformation using Erdas Imagine 2014 version (Erdas Citation2014). Fused pan-sharpened QuickBird satellite data were used in this study. Other data used in this research were a forest cover type map at 1/25.000 scale for the year 2008 and 1/25.000 scale topographical maps.
Data processing involved a number of steps. First, the forest cover type map (2008) was digitized and processed using a GIS (Arc/Info 9.3.) with a maximum root mean square (RMS) error under 10 m and the associated attribute data were punched into the computer to create the spatial database of the area. Second, Landsat TM and QuickBird images were rectified and classified to create crown closure classes. Third, spatial accuracy was evaluated using both the forest cover type map and Landsat TM and QuickBird images. Crown closure obtained from the forest cover type map and Landsat TM/QuickBird images were overlaid and areas that were in the same classes in both the forest cover type map and satellite images were estimated by GIS.
A ground control point is a position in a study area that can be recognized in a satellite image for geometric correction. The road and road–river intersections in a study area can be used as a ground control point. In this study, the road and road–river intersections in the study area and 1/25.000 topographic map were collected as 40 ground control points in total for the QuickBird satellite image (0.6 m), and the QuickBird satellite image was manually georeferenced. The root mean square error (RMSE) for the QuickBird satellite image was 3.5 m. However, these points collected for the QuickBird satellite image could not be used for the geometric correction of the Landsat TM satellite image owing to the fact that it has low spatial resolution. Therefore, for the geometric correction of the Landsat TM satellite image, the rectified image of the QuickBird satellite image was used. The RMSE of the Landsat TM satellite image was 0.5 m. In addition, atmospheric correction of the QuickBird and Landsat TM satellite images were performed using actor module in Erdas Imagine 2014 version (Erdas Citation2014). Image processing, classification, and spatial analysis were carried out using Erdas Imagine 2014 version and Arc/info 9.3.
The study area consists of mixed types of tree species. Conventional, per pixel classification of satellite images is restricted by mixed pixels (Cracknell Citation1998). Fuzzy classification overcomes this situation by estimating the proportional combination of each pixel to each class. Satellite images are a very important source for land use mapping. Generally, mapping is accomplished through the use of a conventional statistical method, which assigns each pixel to a land use class. The aforementioned methods are not suitable for mixed pixels which include two or more land use classes. Therefore, the fuzzy classification method should be used (Foody Citation1996). In addition, fuzzy classifications, in which each pixel on the satellite image is allocated a membership position in all classes, have been offered as a rational alternative to traditional fixed classifications (Wang Citation1990; Foody Citation1992; Foody Citation1996; Foody Citation1999). In the past few years, several studies to predict percentage crown closure as a continuous variable have been conducted by multiple linear regression (DeFries et al. Citation2000; Berberoğlu et al. Citation2009), a linear mixture model (Iverson et al. Citation1989), and regression tree modeling (Hansen et al. Citation2003). In this study, the LMM fuzzy classification method was used to determine the stand crown closure. The LMM is based on the assumption that class mixing is achieved in a linear manner. This model adopts a least squares technique to predict the class proportions within each pixel. The fact is that a continuous scene can be modeled as the sum of the radiometric interactions among cover types weighted by their relative proportions (Graetz Citation1990). The training ground dataset was obtained from the forest cover type map and a fine spatial resolution land cover classification (maximum likelihood classification) of the QuickBird satellite image. In particular, this classification was clumped to estimate stand crown closure in the Landsat TM satellite image. The QuickBird image with a spatial resolution of 0.6 m was used to subtract the reference percentage stand crown closure data required to train in the study area. The QuickBird image acting as different forest cover types were classified and detailed in forest and non-forest pixels. Later, the classification results were transformed into estimate percentage stand crown closure in the Landsat TM. The form of the mixture model is depicted in (EquationEquation 1(1) ):
(1) where, DNi is the reflectance value of a pixel in waveband i, ∫ic is the pure pixel function of the cover type c to be calculated for each band, n is the band number, (DN)ic is the spectral contribution of cover type c and i is the error term (Berberoğlu et al. 2009). Fine spatial resolution (0.6 m) QuickBird data were classified using maximum likelihood classifier to identify forest and non-forest areas. The result was rescaled to Landsat TM data (30 m spatial resolution) to obtain the training and testing dataset so that 1 Landsat pixel could be covered with the mean of 2500 QuickBird pixel values (tree canopy cover) (Günlü and Başkent, Citation2015). The methodological workflow is given in .
Figure 2. The methodological workflow.
Results
Supervised classification of Landsat TM image
The Landsat TM image was classified into four crown closure classes ( and ). The overall classification accuracy and kappa statistics were 94% and 0.85, respectively. When the crown closure values of the forest cover type map and Landsat TM image were analyzed, it was clearly seen that there were significant differences between areas of low and full coverage classes. The medium coverage class was 960 ha (12% of the landscape) in the forest cover type map and 602 (7.6%) ha in the classified Landsat TM image, indicating a 358 ha difference. For Günlü et al. (Citation2008), crown closure was classified into five classes in a Landsat-7 ETM image; the overall accuracy of classification was 86% and the kappa statistic was 0.81, which was quite acceptable. Franklin et al. (Citation2003) showed that the discrimination of two crown closure classes using Landsat-5 imagery in the Canadian Northwest Territories resulted in accuracies ranging from 60% to 90%.
Figure 3. Crown closure map produced from (a) forest cover type map and (b) Landsat TM image.
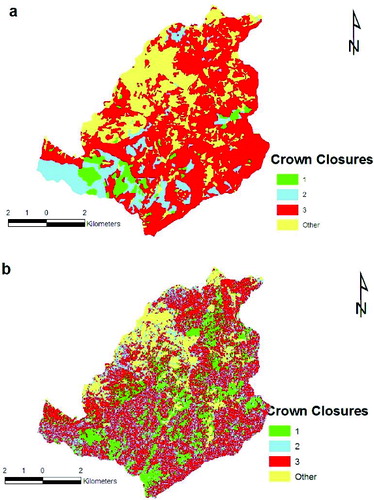
Table 1. Changes in crown closure classes in forest cover type map and Landsat TM image, and spatial analysis results.
Fuzzy classification of Landsat TM image
According to fuzzy classification, the Landsat TM image was classified into four crown closure classes ( and ). When the crown closure values of the forest cover type map and Landsat TM image were analyzed, it was clearly seen that there were significant differences between areas of low and medium coverage classes. The full coverage class was 4617 ha (58% of the landscape) in the forest cover type map and 4639 ha (58%) in the classified Landsat TM image with a 22 ha difference which was quite acceptable.
Figure 4. Crown closure map produced from (a) forest cover type map and (b) fuzzy classification (Landsat TM image).
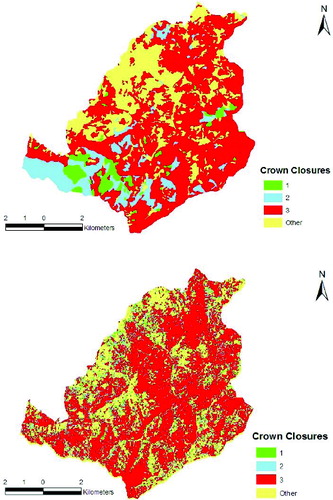
Table 2. Changes in crown closure classes in forest cover type map and fuzzy classification (Landsat TM image) and spatial analysis results.
Classification of QuickBird image
Three crown closure classes were discriminated in the QuickBird image ( and ). The overall classification accuracy and kappa statistics were 96% and 0.95, respectively. When the crown closure values of the forest cover type map and QuickBird image were analyzed, it was clearly seen that the full coverage class (3) was successfully classified with a 237 ha difference in the satellite image. However, there was a significant difference between the areas of medium coverage class compared to the values of both methods. The low coverage class was 359 ha (4.5% of the landscape) in the forest cover type map and 219 (2.3%) ha in the classified QuickBird image with a 140 ha difference.
Figure 5. Crown closure map produced from (a) forest cover type map and (b) QuickBird image.
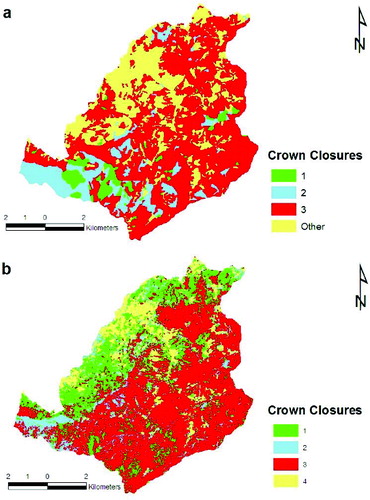
Table 3. Changes in crown closure class in forest cover type map and QuickBird image, and spatial analysis results.
The results are also comparable to other studies related to the discrimination of land use/forest cover and stand parameters. For example, Chubey et al. (Citation2006) used object-based analysis of IKONOS imagery for the extraction of forest inventory parameters. They found that the overall accuracies of land cover and crown closure classification were 93% and 85%, respectively.
Spatial analysis results of satellite images
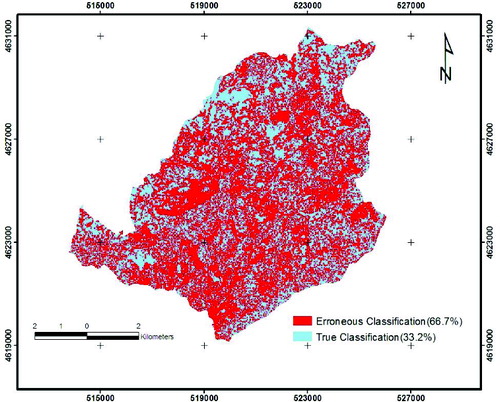
According to spatially analysis results, 140 ha (4%) area of low closure, 110 ha (18%) area of medium closure, and 1485 ha (62%) area of full closure were spatially classified in Landsat TM image. Of the 2213 ha of full closure, nearly 1485 ha (62%) were determined in the same class. Seven hundred and twenty-eight ha (38%) of the full closure area were in other crown closure classes, indicating erroneous interpretation of sites. Taking into consideration all classes in crown closure, the spatial accuracy of crown closure class was 33% in Landsat TM ().
Figure 6. Comparisons of spatial analysis with crown closures and in Landsat TM image.
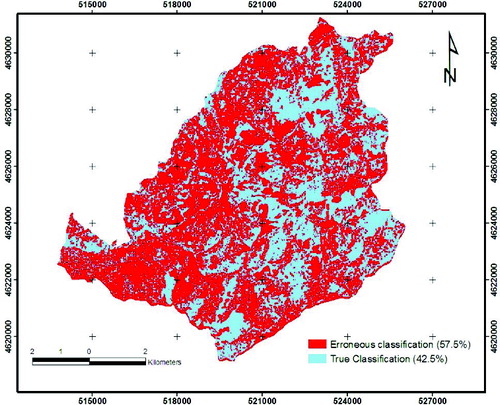
According to fuzzy classification, when crown closure was spatially analyzed, 473.4 ha (5.9%) area of low closure, 1153.3 ha (14.5%) area of medium closure, and 4639.5 ha (58.4%) area of full closure were spatially classified in Landsat TM image. Of the 4639.5 ha of full closure, nearly 2783.9 ha (60%) were determined in the same class while 1855.6 ha (40%) of the full closure area were in other crown closure classes, indicating erroneous interpretation of sites. Taking into consideration all classes in crown closure, the spatial accuracy of crown closure class was 42.5% in Landsat TM ().
Figure 7. Comparisons of spatial analysis with crown closures and in fuzzy classification (Landsat TM image).
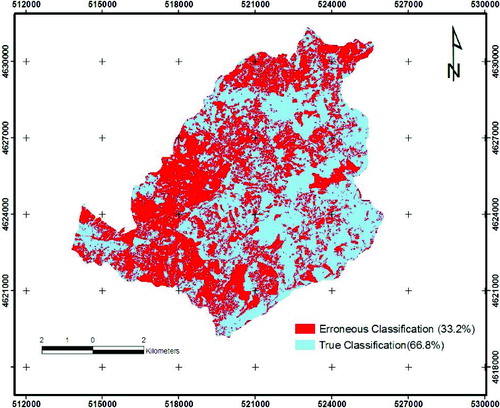
The spatial analysis results of crown closure classes in the QuickBird image indicated that 5 ha (2%) area of low closure, 531 ha (34%) area of medium closure, and 3603 ha (74%) area of full closure were spatially classified. The success of the spatial analyses related to crown closure estimation in QuickBird image was found to be 67% (). The results showed that the estimation of low and medium closure areas was quite low for the three methods.
Figure 8. Comparisons of spatial analysis with crown closures and in QuickBird image.
Discussion and conclusions
In this study, the crown closure obtained from forest cover type map and two different satellite images were overlaid and the areas that were in the same classes in both the forest cover type map and the satellite images were spatially computed by GIS and image processing software. The results of the satellite images were further compared to the forest cover type map values in the context of crown closure classes. The results showed that:
Landsat TM and QuickBird satellite images were successfully classified with a kappa statistic value and the overall accuracy assessments were 0.85 and 94%, and 0.95 and 96%, respectively.
The QuickBird image had the highest classification accuracy results compared to the Landsat TM image.
General analysis showed that the spatial accuracies of crown closure were 33.2%, 42.5%, and 66.8% percentage of spatial accuracies for Landsat TM, fuzzy classification method and QuickBird satellite image, respectively.
For both remotely sensed data, spatial accuracies were lower than classification accuracies.
The best spatial accuracies were obtained as 61.8%, 60.0% and 74.2% for 66.8% percentage of spatial accuracies for Landsat TM, fuzzy classification method and QuickBird satellite image in the full closure class, respectively; whereas the lowest spatial accuracies were found to be 4.1%, 3.1%, and 2.3% in low closure, respectively.
Landsat TM image provide relatively good means to map crown closure at a landscape level. However, Landsat TM image do not provide the means to map or monitor minor vegetation community and stand types due to low resolution.
It could be stated that the discrimination of stand crown closures in forest ecosystems could be determined at an acceptable level using high resolution QuickBird satellite image.
Comparing the results of two different methods of success (overall accuracy, kappa statistic and spatial), the best classification classes were obtained in QuickBird satellite image.
As a result, stand parameters such as development stages and crown closures need to be determined using different satellite data in order to make better decisions for the sustainable management of forest ecosystems.
Acknowledgments
We would like to extend our appreciation and thanks to the forest management team leader, Caner Akgül and the staff involved in preparing the forest management plan in Kızılcasu. Many thanks also to the TUBİTAK for partial support of the work.
Disclosure statement
No potential conflict of interest was reported by the authors.
References
- Andersen HE, McGaughey R, Reutebuch SE. 2005. Estimating forest canopy fuel parameters using LIDAR data. Remote Sensing Environ. 94:441–449.
- Berberoğlu S, Satir O, Atkinson PM. 2009. Mapping percentage tree cover from Envisat MERIS data using linear and nonlinear techniques. Int J Remote Sensing. 30 (18):4747–4766.
- Chen L, Wang J, Fu B, Qiu Y. 2001. Land-use change in a small catchment of northern Loess Plateau, China, Agriculture. Ecosystems Environ. 86:163–172.
- Chubey MS, Franklin SE, Wulder MA. 2006. Object-based analysis of IKONOS-2 imagery for extraction of forest inventory parameters. Photogrammetric Eng. Remote Sensing. 72 (4):383–394.
- Cracknell AP. 1998. Synergy in remote sensing: what's in a pixel? Int J Remote Sensing. 19:2025–2047.
- Çakır G, Sivrikaya F, Keleş S. 2008. Forest cover change and fragmentation using Landsat data in Maçka State Forest Enterprise in Turkey. Environ Monit Assess. 137:51–66.
- Defries RS, Hansen MC, Townshend JRG. 2000. Global continuous fields of vegetation characteristics: a linear mixture model applied to multi-year 8 km AVHRR data. Int J Remote Sensing. 21:1389–1414.
- Erdas. 2014. Erdas 2014 Software, USA.
- Foody GM. 1992. A fuzzy sets approach to the representation of vegetation continua from remotely sensed data, an example from lowland heath. Photogrammetric Eng Remote Sensing. 58:221–225.
- Foody GM. 1996. Approaches for the production and evaluation of fuzzy land cover classifications from remotely sensed data. Int J Remote Sensing. 17:1317–1340.
- Foody GM. 1999. The continuum of classification fuzziness in thematic mapping. Photogrammetric Eng Remote Sensing. 65(4): 443–451.
- Franklin SE, Hall RJ, Smith L, Gerylo GR. 2003. Discrimination of conifer height, age and crown closure classes using Landsat-5 TM imagery in the Canadian Northwest Territories. Int J Remote Sensing. 24:1823–1834.
- Gemmel FM. 1995. Effects of forest cover, terrain, and scale on timber volume estimation with Thematic Mapper data in a Rocky Mountain site. Remote Sensing Environ. 51:291–305.
- Graetz RD. 1990. Remote sensing of terrestrial structure: an ecologist's pragmatic view, in Remote Sensing of Biosphere Functioning. Ecological Stud. 79:5–30 (New York: Springer Verlag).
- Günlü A, Başkanet EZ. 2015. Estimating crown closure of forest stands using Landsat TM data: A case study from Turkey. Environ Eng Manag J. 14(1):183–193.
- Günlü A, Sivrikaya F, Başkent EZ, Keleş S, Çakir G, Kadiogullari AI. 2008. Estimation of stand type parameters and land cover using Landsat-7 ETM image: a case study from Turkey. Sensors. 8:2509–2525.
- Hansen MC, Defries RS, Townshend JRG, Carroll M, Dimiceli C, Sohlberg RA. 2003. Global percent tree cover at a spatial resolution of 500 metres: first results of the MODIS vegetation continuous fields algorithm. Earth Interactions. 7:1–15.
- Hyyppa J, Hyyppa H, Inkinen M, Engdahl M, Linko S, Zhu YH. 2000. Accuracy comparison of various remote sensing data sources in the retrieval of forest stand attributes. For Ecol Manag 128:109–120.
- Iverson LR, Cook EA, Graham RL. 1989. A technique for extrapolating and validating forest cover across large regions: calibrating AVHRR data with TM data. Int J Remote Sensing. 10:1805–1812
- Jensen JR, Qiu F, Mınhe J. 1999. Predictive modeling of coniferous forest age using statistical and artificial neural network approaches applied to remote sensor data. Int J Remote Sensing. 20:2805–2822.
- Kammerbauer J, Ardon C. 1999. Land use dynamics and landscape change pattern in a typical watershed in the hillside region of central Honduras. Agric Ecosystems Environ. 75:93–100.
- Keleş S, Sivrikaya F, Çakır G, Köse S. 2008. Urbanization and forest cover change in regional directorate of Trabzon forestry from 1975 to 2000 using Landsat data. Environ Monit Assess. 140:1–14.
- Poulain M, Pena M, Schmidt A, Schmidt Schulte HA. 2010. Relationship between forest variables and remote sensing data in a Nothafagus pumilio forest. Geocarto Int. 25:25–43.
- Pu R, Xu B, Gong P. 2003. Oakwood crown closure estimation by unmixing Landsat TM data. Int J Remote Sensing. 24:4433–4445.
- Reese H, Nilsson M, Sandström P, Olsson H. 2002. Applications using estimates of forest parameters derived from satellite and forest inventory data. Comput Electron Agric. 37:37–55.
- Sader SA, Hepinstall DJH, Coan M, Soza C. 2001. Forest change monitoring of a remote biosphere reserve. Int J Remote Sensing. 22:1937–1950.
- Spanner MA, Pierce L, Running SW, Peterson DL. 1990. Remote sensing of temperate coniferous forest leaf area index: the influence of canopy closure, understory vegetation and background reflectance. Int J Remote Sensing. 11:95–111.
- Wang F. 1990. Fuzzy supervised classification of remote. IEEE Trans Geoscience Remote Sensing. 28:194–201.