
ABSTRACT
The goal of the present study was to provide basic data for establishing climate change adaptation measures and to support appropriate forest management in Jeollabuk-do, Republic of Korea. An assessment of forest vulnerability to landslide caused by localized torrential rainfall was conducted for Jeollabuk-do, taking into consideration the local climate characteristics and the regional characteristics of the forest. CCGIS, a climate change adaptation software toolkit based on GIS, was used to carry out the vulnerability assessment of each city and county of Jeollabuk-do. To improve the assessment, locally specific variable weights were prepared, based on the results of a Delphi investigation targeting public forestry staff in Jeollabuk-do. The regionally specific weight was greatest for the variable of climate exposure, followed by sensitivity and adaptability. According to the vulnerability assessment over the course of time, in most of the forest the vulnerability rating decreased from 2000s to 2020s, and later it decreased once again in all urban areas. The vulnerability of forests was predicted to be greatest in the 2050s. Hence, if the local government sets up an adaptation policy using this research data that assessed the landslide vulnerability of forest in Jeollabuk-do, Korea taking account of the characteristics of the local area, we consider that an effective policy can be established and forest management can incorporate measures to adapt to climate change.
Introduction
Global warming and global climate change have been recognized as international problems, and greenhouse gases caused by economic activities have exceeded the Earth's self-cleaning ability, causing abnormal weather phenomena such as rising temperature, floods, droughts, and typhoons, along with environmental disasters (Hong et al. Citation2014). It is forecasted that the mean temperature of Earth would increase by 6.3 °C at most by the end of the twenty-first century; if the annual mean temperature increases by 3 °C it is predicted that more than 7 million people in Asia will face flood damage (IPCC Citation2007). Yet the temperature will keep rising, and will increase by an average of 4 °C worldwide in 2080 (Middelkoop et al. Citation2001).
Korea, as well, has recorded a temperature increase of 1.7 °C, which is higher than the increase of Earth's average temperature (0.74 ± 0.03 °C) during the past century (1912–2008), while annual total precipitation in Korea has increased by around 19% compared to 1910 (National Institute of Meteorological Research, Korea Meteorological Administration Citation2009).
With the progression of global warming, during the last 10 years (1998–2007) 80% of all natural disasters were related to damage by heavy rains and floods brought about by storms and typhoons. Moreover, the scale of damage is being enlarged and diversified (Jeon et al. Citation2009). Abnormal climatic events such as localized torrential rainfall are mostly observed in cities, where population and infrastructure are concentrated (Hwang Citation2015). Compared to such incidents generally, the influence and extent of damage of events in cities are more severe, and while the cost of such damage is very high it is relatively infrequent (Kim Citation2015).
In the case of Korea, 23 recent natural disasters, including heavy snow and localized torrential rainfall, have brought about two deaths, affected a total of 7691 people and caused property loss of 180 billion Korean won. Especially, regional torrential rainfall in southern regions on 25 August brought significant damage to the areas of Busan, Ulsan, and Gyeongnam. In other words, Korea is being considerably affected by climate change (Ministry of Public Safety and Security Citation2014).
For human beings to adapt well to such climate change, information about vulnerability must be made available (Ryu & Kim Citation2008). Analysis of vulnerability to climate change can lead to relief of damage, or may allow a valuable opportunity for identification of natural or artificial controls to guard against ripple effects and the influence of climate change that is presently occurring or that might occur in future (IPCC Citation2001). Vulnerability analysis therefore expresses the relationship between the risks of climate impact and the system. A system is regarded as vulnerable if the climate impact is high and the adaptability of the system is low (UNDP Citation2005).
In Korea, to investigate regional vulnerability to climate change, research at the government level has begun (Han et al. Citation2007) and a vulnerability assessment software tool called CCGIS (a climate change adaption toolkit based on GIS) has been developed and distributed (Hwang Citation2015). Because vulnerability to climate change varies locally, even among adjacent regions of local government, it is very important to understand the vulnerability characteristics of each local government area in order to establish appropriate adaptation measures for each region (Koh Citation2009).
Accordingly, the goal of the present study was to provide basic data to support the establishment of climate change adaptation measures and to support forest management in Jeollabuk-do, South Korea, at both the provincial and local level. An assessment of forest vulnerability to landslide caused by localized torrential rainfall was conducted for Jeollabuk-do taking into consideration the local climate characteristics and the regional characteristics of the forest. CCGIS was used to carry out the vulnerability assessment of each city and county of Jeollabuk-do, and locally specific variable weights for the assessment were prepared based on local and regional characteristics.
Materials and methods
Selection of study sites
Subject forests located in 14 cities and counties of Jeollabuk-do were selected as study sites: Jeongeup City; Namwon City; Gimje City; Gunsan City; Iksan City; Jeonju City; Gochang County; Jinan County; Imsil County; Sunchang County; Wanju County; Buan County; Muju County; and Jangsu County.
Weight calculation of the vulnerability assessment analysis
Delphi survey
The Delphi survey method used in the present research omitted the stage in which experts are requested to predict variation items. An indirect proxy indicator was derived by separating the climate exposure, sensitivity, and adaptability of each item of the vulnerability assessment performed by the Korea National Institute of Environmental Research, focusing on its details, and experts were asked to answer a structured survey.
To predict upcoming phenomena relevant to the subject forest, an expert group of 100 participants was selected for study. This group comprised staff belonging to the administrative organization of the provincial offices, city halls, and county offices, who either had field experience or had been in charge of field management and operations. The survey procedure was as follows: after the subject forest and survey participants were selected, 100 questionnaires were answered via e-mail, postal mail, and direct response to in-person surveying. Questionnaires were sent out in November 2011 and surveys were conducted twice until 15 February 2012. The analysis was carried out on 58 among 100 questionnaires that were returned.
Contents for Delphi analysis
The survey included elements intended to calculate the weight of proxy variables such as climate exposure, sensitivity, and adaptability, because it is difficult to directly assess vulnerability to landslides caused by localized torrential rainfall. Specific proxy variables were identified for each variable of the assessment to allow calculation of their weights. At this stage, we recorded ratios for each of the proxy variables that would sum to 100% for the corresponding main variable. The same division was performed for specific variables within the category of each proxy variable.
Correlation between variables
Correlation analysis was carried out using SPSS v12.0 to analyze linear correlations between the vulnerability–resilience index (VRI) of each subsection of the assessment of vulnerability to landslides caused by localized torrential rainfall performed in the 14 cities and counties of Jeollabuk-do, Korea. We calculated the coefficient of correlation and the Pearson coefficient of determination, which shows the linear correlation between variables based upon the principle of continuous variables (Park et al. Citation2010).
Vulnerability assessment
Vulnerability assessment tool
CCGIS v3.1 software was employed for this research. The time range established in CCGIS was divided into the 2000s (1996–2005), the 2020s (2016–2025), the 2050s (2046–2055), and the 2100s (2095–2099), and the future scenario data used were the six climate change scenarios (SRES A2, A1B, A1T, A1F1, B1, B2) of the Intergovernmental Panel on Climate Change (IPCC). The climate forecast data of each scenario were downscaled by means of a regional climate model relating the integrated systems of climate and atmospheric environment, developed by the National Institute of Environmental Research of the Republic of Korea.
Weight of variables in the vulnerability assessment
In this research, instead of using the default weight, a modified weighting scheme for evaluation of the forest in Jeollabuk-do was prepared based on the Delphi survey. Bayesian statistical analysis was used based on Bayes’ theorem (1763). This theorem is largely used in uncertain situations where decisions must be made on the basis of statistical information.
The use of Bayesian methods increases the prediction validity of the Delphi method and selects the weight as a tool to diminish the uncertainty, using the Bayes theorem equivalent to (Equation1(1) ) (Lee Citation2001):
(1) where
is probability of event A, given event B,
is the prior probability, and
is the event not B.
Vulnerability assessment method
The vulnerability of the forest in the 14 cities and counties of Jeollabuk-do was assessed using the newly calculated modification weight instead of the default weight built into CCGIS. The concept of the IPCC scenarios was applied for the VRI equation (Equation2(2) ):
(2) where
is climate change vulnerability,
is the modified weight for A (climate exposure),
is the modified weight for B (sensitivity), and
is the modified weight for
(adaptability).
CCGIS is programmed to calculate the VRI as shown in equation (Equation3(3) ), using the concept of the IPCC scenarios:
(3) where
is the modified weight for A1 (climate exposure-specific proxy variables 1),
is the modified weight for B1 (sensitivity-specific proxy variables 1), and
is the modified weight for
(adaptability-specific proxy variables 1).
Results and discussion
Correlation between the variables
lists the calculated correlations between the variables used in assessing the vulnerability to landslide caused by localized torrential rainfall. Among the correlations, two were statistically significant at the 1% level: that between the sensitivity and VRI, and that between adaptability and VRI. The Pearson coefficient of correlation (r) describing the correlation between sensitivity and VRI was high and positive, at +0.917, and that of the correlation between adaptability and VRI was high and negative, at −0.698. That is to say, higher sensitivity is correlated with higher vulnerability and higher adaptability is correlated with lower vulnerability.
Table 1. Correlations between variables used to assess vulnerability to landslide under heavy rain.
Analysis of variable weights for use in the vulnerability assessment
shows the weights calculated for proxy variables and for specific proxy variables used in the vulnerability assessment. The result of these calculations was that climate exposure (0.4283) was weighted more heavily than the sensitivity (0.3103) and the adaptability (0.2614). This result was the same as the vulnerability assessment for pine and pine mushrooms (Lim et al. Citation2014).
Table 2. Weights of variables used in assessment of vulnerability to landslide under heavy rain.
The specific proxy variable of climate exposure which had the strongest influence upon climate exposure, and thus was weighted the most strongly, was the number of days with more than 80 mm daily precipitation (0.2833), followed by the maximum daily precipitation (0.2622), the daily precipitation in summer (0.2350), and the maximum amount of precipitation in any 5-day period (0.2195).
With regard to sensitivity, the proxy variable with the biggest impact was the gradient within the forest (0.4154), which seems to arise from the high gradient of the forest in Jeollabuk-do, whereas the lowest was the impact of unstocked area (0.0340) which was likely due to the small amount of unstocked area in Jeollabuk-do forest. For adaptability, the most impactful proxy variable was the prevention of forest destruction area (0.2862) and the lowest was the financial independence rate (0.2138).
Results of vulnerability assessment
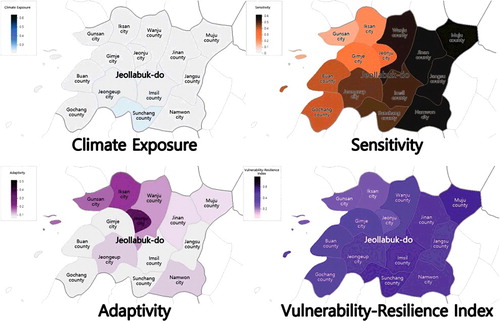
lists the results of the vulnerability assessment for each of the 14 counties and cities in the study area. In the near-present time period (2000s), the highest values of climate exposure in the context of vulnerability to landslide caused by localized torrential rainfall in Jeollabuk-do were those of Sunchang County (0.2405), Jeongeup City (0.2346), Imsil County (0.2282), and Jeonju City (0.2015).
Table 3. Assessment of vulnerability to landslide under heavy rain, 2000s.
With regard to sensitivity, the areas of Muju County (0.5976), Jinan County (0.5816), Namwon County (0.5769), and Jangsu County (0.5728) appeared to be the most vulnerable, while the areas of Jeonju City (0.3478), Iksan City (0.2026), Gunsan City (0.1722), and Wanju County (0.1426) showed the greatest adaptability.
Regarding overall vulnerability to landslide caused by localized torrential rainfall, the areas of Muju County (0.5329), Sunchang County (0.5203), Imsil County (0.5172), and Namwon City (0.4983) were found to be the most vulnerable. In general, western areas within Jeollabuk-do showed greater climate exposure, southern areas showed the least adaptability, and eastern areas, including the eastern mountain area, were most sensitive. As a result, it was realized that the most vulnerable areas tended to coincide with the most sensitive areas ().
Figure 1. Assessment of vulnerability to landslide under heavy rain, 2000s.
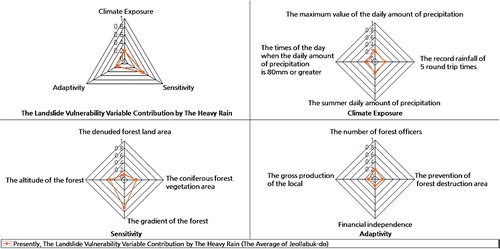
lists the contributions to overall vulnerability by proxy variables and by specific proxy variables, averaged throughout Jeollabuk-do. Among the proxy variables, sensitivity (0.44) had the highest contribution, followed by climate exposure (0.19) and adaptability (0.12). Among the specific proxy variables of climate exposure, the daily maximum precipitation (0.23) and the daily summer precipitation (0.23) showed the greatest contributions, followed by the maximum 5-day precipitation (0.19) and the number of days with more than 80 mm precipitation (0.13).
Table 4. Assessment of vulnerability to landslide under heavy rain: averages throughout Jeollabuk-do, 2000s.
In the case of sensitivity, the slope (0.69) within the forest had a remarkably high contribution and the altitude (0.05) within the forest showed the smallest contribution. Regarding adaptability, the number of forestry public officials (0.18) showed the highest contribution and the gross regional domestic product (GRDP) (0.09) and financial independence rate (0.09) both showed the least. The finding that sensitivity had the highest contribution was likely a result of the high values of specific proxy variables within the category of sensitivity for the places throughout Jeollabuk-do.
According to the analysis, there was little contribution by climate exposure and adaptability; sensitivity had a much greater influence (). However, as it is very difficult practically to affect the factors of sensitivity, it is necessary to establish a climate change adaptation policy to improve the adaptability. Therefore, considering that the greatest contribution to adaptability was the number of public officials in the field of forestry, we can surmise that employing more forestry officials may improve adaptability.
Figure 2. Contribution of individual variables to overall vulnerability to landslide under heavy rain: average throughout Jeollabuk-do, 2000s.
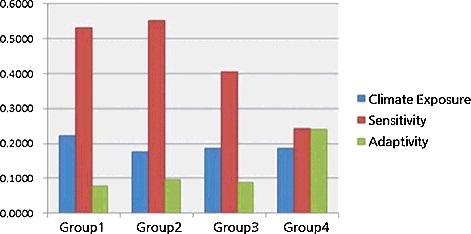
Each city and county was divided into four groups representing the four quartiles of VRI, as listed in ; group 1 was the most vulnerable and group 4 was the least.
Table 5. Climate exposure, sensitivity, and adaptability index averages by group, 2000s.
The result analysis showed that from group 1 to group 3 the value decreased in order of sensitivity, climate exposure, adaptability, and had the same tendency as the average contribution to Jeollabuk-do of proxy variables. Group 4 showed relatively high climate exposure but very low sensitivity and outstanding adaptability, accounting for its lowest vulnerability overall. Group 2 showed lower climate exposure and better adaptability than group 3, but owing to its noticeably higher sensitivity was more vulnerable overall ().
Figure 3. Climate exposure, sensitivity, adaptability: average index by group, 2000s.
During a recent 10-year period (1996–2005), the annual precipitation of Jeollabuk-do rose from 1282.8 mm, which is the average value of past years (1971–2000), to 1447.0 mm, a rise of 13% that is both large itself and greater than the average increase of 11% throughout the Republic of Korea. Furthermore, annual precipitation, number of days with precipitation, maximum 5-day precipitation, precipitation intensity index, and heavy precipitation events of over 95%, have all risen, increasing the potential for flooding (Jang & An Citation2009).
Because of this risk, the vulnerability of Jeollabuk-do to landslide caused by localized torrential rainfall was assessed for various future periods – the 2020s, 2050s, and 2100s. The evaluation of future VRI showed that most areas in Jeollabuk-do will be increasingly vulnerable to landslide from localized torrential rainfall until the 2050s, and then decreasingly vulnerable from the 2050s to the 2100s. All 14 cities and counties showed their greatest vulnerabilities during the 2050s (, ).
Figure 4. Assessment of vulnerability to landslide under heavy rain: VRI results for the 2000s, 2020s, 2050s, and 2010s.
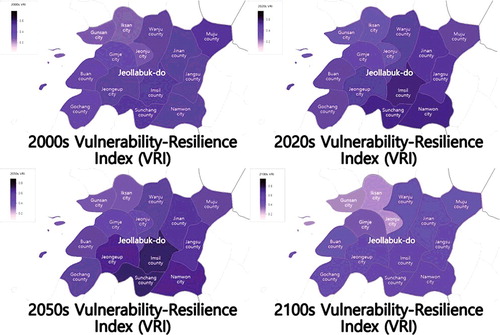
Table 6. VRI of landslide under heavy rain during four time periods.
Conclusions
In this research, the weights of proxy variables and of specific proxy variables of landslide risk from localized torrential rainfall were calculated based on consideration of local climate characteristics and regional characteristics, with the purpose of establishing measures to improve forest adaptability to climate change in Jeollabuk-do and to promote appropriate management. Vulnerability to landslide from localized torrential rainfall was assessed for several time ranges of approximately the 2000s, 2020s, 2050s, and 2100s, and the vulnerability features of the forest in Jeollabuk-do were analyzed.
Weights were calculated for the proxy variables and the specific proxy variables used in the vulnerability assessments, taking into consideration the local climate characteristics and the regional characteristics; climate exposure was the most heavily weighted variable, followed by sensitivity and adaptability.
The following areas within Jeollabuk-do showed relatively high climate exposure values in the near-present period (2000s): Sunchang County; Jeongeup City; Imsil County; and Jeonju City. The following areas appeared to be the most sensitive: Muju County; Jinan County; Namwon City; and Jangsu County. The most adaptable areas appeared to be Jeonju City, Iksan City, Gunsan City, and Wanju County. Overall, the urban areas tended to show high capability to adapt to climate change. A vulnerability evaluation based upon the use of proxy variables showed that forest vulnerability was highest in Namwon City, followed by Sunchang County and Jangsu County.
Finally, similar vulnerability assessments were carried out for various near-present and future time periods. Except in six cities, forestry vulnerability was projected to decrease between the 2000s and 2020s, and then to increase in all urban areas until the 2050s, falling again in the period between the 2050s and 2100s. The forest in Jeollabuk-do demonstrated the highest vulnerability in the 2050s. This is presumably due to the clear increasing trend of climate exposure in the period between the 2020s and 2050s.
The CCGIS based vulnerability assessments conducted in this work provide information necessary to build effective climate change adaptation measures in the forest of Jeollabuk-do. This research allows vulnerable regions to be shown among the cities and counties, providing basic data required to establish adaptation measures at the local government level, such as determining priorities for taking action against climate change.
To allow reduction of the uncertainty of future predictions and to provide more reliable assessment data, the present work included the use of the Delphi method and Bayesian analysis to improve the weights assigned to the proxy variables and specific proxy variables used in the vulnerability assessment. The VRI provides information about the forest in Jeollabuk-do, and is a comparison value of 14 cities and counties which cannot be used to compare with other local governments as an absolute value.
In summary, the present research provided data and analysis of local vulnerability to landslide caused by localized torrential rainfall in 14 cities and counties in Jeollabuk-do. This spatial information can be utilized as a basic data source to inform the selection of adaptation measures at the local government level, such as determining priorities for taking action against climate change.
Disclosure statement
No potential conflict of interest was reported by the authors.
References
- Han HJ, Lee JT, Choi EJ, Lee WG, Bae DH. 2007. Climate change impact assessment and development of adaptation strategies in Korea. Seoul: Korea Environment Institute.
- Hong EP, Jang EH, Kim JS. 2014. Implications of policy and strategy for climate change adaptation in leading countries. Seoul: Korea Legislation Research Institute.
- Hwang DJ. 2015. A research on the assessment of disaster risk in Kangwon region using climate change scenario and disaster risk index. Seoul: Kangwon National University.
- IPCC (Intergovernmental Panel on Climate Change). 2001. Climate change 2001: impacts, adaptation and vulnerability. Third assessment report of the Intergovernmental Panel on Climate Change. Geneva: IPCC.
- IPCC (Intergovernmental Panel on Climate Change). 2007. Climate change 2007: the physical science basis. Contribution of Working Group I to the Fourth Assessment Report of the Intergovernmental Panel on Climate Change. Geneva: IPCC.
- Jang NJ, An JE. 2009. Establishing measures for climate change adaptation Jeonbuk climate change vulnerability research. Jeonju: Jeonbuk Development Institute.
- Jeon JB, Lee HJ, Kim JH, Lee SM. 2009. The study on development of emergency action system against extreme flood. Korea Water Resour Assoc. 21:1482–1488.
- Kim YK. 2015. A hierarchical Bayesian modeling of temporal trends in return levels for extreme precipitations. The Korean J App Stat. 28(2):137–149.
- Koh JK. 2009. A study on adapting to climate change in local governments – focusing on natural disasters. J Korean Regional Dev Assoc. 22(1):67–86.
- Lim SJ, Kim HJ, Lee SH. 2014. Forest vulnerability assessment of pine and pine mushrooms using GIS. J Agr & Life Sci. 48(2):1–11.
- Lee JS. 2001. Delphi method. Seoul: University of Kyoyookbook.
- Middelkoop H, Daamen K, Gellens D, Grabs W, Kwaijk JCJ, Lang H, Parmet BWAH, Schulla J, Wilke K. 2001. Impact of climate change on hydrological regimes and water resources management in the Rhine Basin. Clim Change. 49:105–128.
- Ministry of Public Safety and Security. 2014. Disaster yearbook. Seoul: Ministry of Public Safety and Security.
- National Institute of Meteorological Research Korea Meteorological Administration. 2009. Understanding climate change (II). Seoul: National Institute of Meteorological Research Korea Meteorological Administration.
- Park SJ, Han WS, Jeong NJ. 2010. Biostatistics. Seoul: Korea National Open University.
- Ryu KY, Kim IE. 2008. Development and application of a climate change vulnerability index. Seoul: Korea Environment Institute.
- UNDP (United Nations Development Programme). 2005. Adaptation policy framework for climate change; developing strategies, policy and measures. New York: UNDP.