
Abstract
This study was carried out in the teaching and research forest of the University of Dschang in Belabo, with the aim of analysing land-cover and land-use changes as well as carbon stocks dynamic. The databases used are composed of three Landsat satellite images (5TM of 1984, 7ETM + of 2000 and 8OLI of 2016), enhanced by field missions. Satellite images were processed using ENVI and ArcGIS software. Interview, focus group discussion methods and participatory mapping were used to identify the activities carried out by the local population. An inventory design consisting of four transects was used to measure dendrometric parameters and to identify land-use types. An estimation of carbon stocks in aboveground and underground woody biomass was made using allometric models based on non-destructive method. Dynamic of land-cover showed that the average annual rate of deforestation is 0.48%. The main activities at the base of this change are agriculture, house built-up and logging. Seven types of land-use were identified; adult secondary forests (64.10%), young secondary forests (7.54%), wetlands (7.39%), fallows (3.63%), savannahs (9.59%), cocoa farms (4.28%) and mixed crop farms (3.47%). Adult secondary forests had the highest amount of carbon (250.75 t C ha−1). This value has decreased by more than 60% for mixed crop farms (94.67 t C ha−1), showing the impact of agricultural activities on both forest cover and carbon stocks. Agroforestry systems that allow conservation and introduction of woody species should be encouraged as part of a participatory management strategy of this forest.
Introduction
Tropical forests are among the richest ecosystems in the world, but they are also habitat with the highest rate of degradation (WWF Citation2016). Men in their interactions with the environment in recent decades have created unprecedented changes in ecosystems and landscapes (Kushwaha et al. Citation2010). Currently, almost all tropical regions are experiencing major changes that modify their structure through either shifting cultivation or logging activities (Cuny Citation2011). In tropical developing countries characterized by agriculture-based economies and rapid population growth, land-cover change is very intense (Yeshaneh et al. Citation2013; Romijn et al. Citation2015). Each year, about 13 million hectares of forest are converted into other types of land-use (Parker et al. Citation2009). This land-use change is responsible for about 17 percent of total greenhouse gas emissions resulting from human activity (FAO Citation2008). Land-use remains an important factor in habitat degradation and biodiversity loss (Lucas et al. Citation2015).
As the second largest tropical forest ecosystem after the Amazon, the Congo basin forest massif plays a very important role in the continental and global climate system and these forests provide livelihoods for about 60 million people who live nearby and also perform social and cultural functions (de Wasseige et al. Citation2014, Citation2015). However, deforestation rate is increasing, ranging from 0.13% between 1990 and 2000 to 0.26% from 2000 to 2005 (Ernst et al. Citation2013). Deforestation in Congo basin is correlated with population density and related subsistence activities (agriculture and energy) that usually occur at the expense of the forest (Dibi N’Da et al. Citation2008). Deforestation negatively affects environmental services provided by forests, including the loss of biodiversity and the reduction of carbon sequestration potential.
Some mechanisms have been put in place to mitigate climate change including reducing the emissions from deforestation and degradation of forests (REDD+). This mechanism aims to remunerate developing countries for their efforts in the fight against deforestation and forest degradation on a voluntary basis (Langevin Citation2012). In order to reduce deforestation, forests mapping and the monitoring of their evolution are very important. Mapping areas of forest cover change is essential for developing locally adapted strategies to better control these dynamics (de Wasseige et al. Citation2014). Remote sensing has proven to be an essential low-expensive and effective technology for determining land cover and land use dynamics over several decades and at different scales (Loveland and Dwyer Citation2012; Hansen et al. Citation2013; Wani et al. Citation2016; Mukete et al. Citation2017; Barakat et al. Citation2018). One of the first steps in implementing REDD + is the estimation and monitoring of carbon stocks in different land-use. Carbon stock data by land-use are used to quantify avoided emissions in order to appropriately allocate carbon credits to avoided deforestation (Salimon et al. Citation2011).
The teaching and research forest of the university of Dschang (FER-UDs), has been a reserve since 1985 and its classification process ended in April 2016. This forest that is intended for teaching and research is facing various human pressures, such as agriculture, logging, firewood and non-timber forest products collection (Ndoh-Nyemble Citation2016). Over time, these activities have led to a change in vegetation and land-cover. For the enhancement and sustainable management of this forest, the University of Dschang intends to take advantage of opportunities offered by REDD + mechanism. Hence there is a need to determine land cover and land-use dynamic and assess carbon stocks in this forest. Thus, the necessity of this study which aims at assessing the spatial and temporal dynamic of land-cover of this forest between 1984 and 2016 and the dynamic of carbon stocks.
Material and methods
Study site
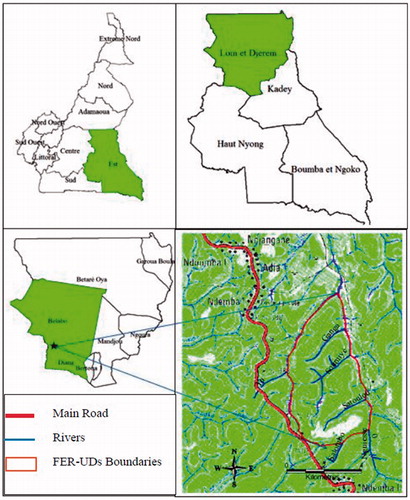
The study was carried out in the teaching and research forest of the university of Dschang, located in Lom and Djerem division, in the Eastern-Cameroon, between latitudes 4° 55'–4° 61'N and longitudes 13° 25'–16° 28'E (). It covers an area of 2 400 hectares spreading over Belabo and Diang subdivisions. The climate is equatorial, of Guinean type and it is characterized by 04 seasons with two dry seasons (mid-October to March and June to mid-August) and two rainy seasons (mid-August to October and March to June) (CTFT Citation2013). Temperatures vary from 20 °C (between July and August) to 30 °C (between January and February). The average annual rainfall is 1 550 mm. The vegetation is a dense humid semi-deciduous forest dominated by species of Sterculiaceae and Ulmaceae families (Letouzey Citation1985).
Figure 1. Localization of study site in the Eastern Region of Cameroon.
Data collection and analysis
Land cover change
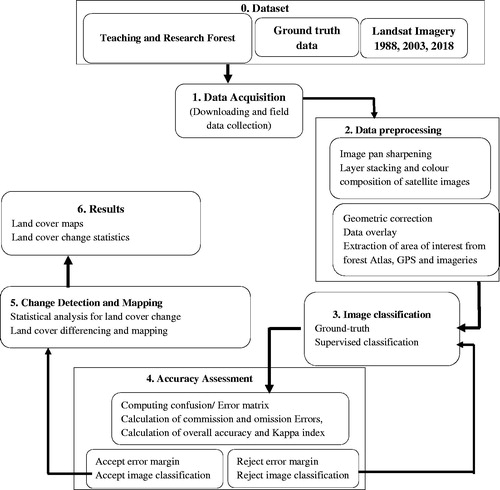
Assessment of land cover change was made using Landsat 5TM, Landsat 7ETM+ and Landsat 8OLI_TIRS satellite images taken in 1984, 2000 and 2016 respectively. Area considered for these diachronic analyses included the FER-UDs and the two neighbouring villages (Ndemba 1 and Ndemba 2). Inclusion of these two villages is justified by the fact that they are the ones having a direct influence on this forest through activities carried out by local populations. Images were acquired approximately for the same period, during the dry season (December) to make sure that the phenological stages of plant cover were not too different between dates. These different images were processed using ENVI 4.7 software to extract desired information. The first phase of the treatment consisted of coloured composition with the combination of the different spectral bands of each image in order to form a scene. Extraction of the study zone was made using a geo-rectified vector map (UTM 33 WGS 84). We then carried out a supervised classification (a field mission has been fulfilled previously with a view to identifying different land-cover types). Maximum likelihood classification was adopted for this study as it is considered to be the most accurate of the classifiers compared to other algorithms for its multi criteria checks on the a given pixel before assigning it to a given class. Error matrixes to assess the accuracies and errors of the classification were computed. The Kappa index (the ratio of the number of well-ranked pixels to the total of the pixels surveyed) was calculated. Post-classification change detection technique was applied to compare independently produced classified images. Finally, vectorization was done and vectors derived from digital processing in ENVI were imported into ArcGIS 10 software for the extraction of the layers to be used, digitization, generation of databases, and production of maps. shows the different steps of image processing.
Figure 2. Flow-diagram representing different steps of land use/land cover change analysis.
Activities carried-out by local population
Participatory rural appraisal was used, notably small group discussions, interviews, participatory mapping and participatory observation to identify the activities carried out in the FER-UDs and the location of the various resources (rivers for fishing, hunting areas, agricultural areas, etc.).
Land-use type and carbon stock
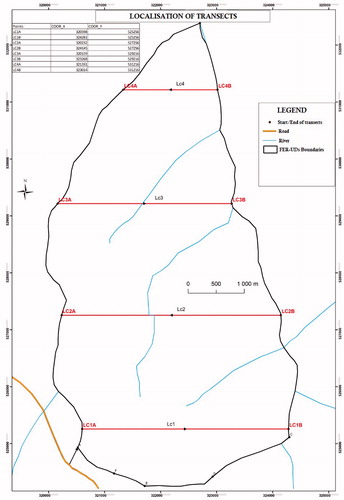
Floristic inventory was conducted by transects method which has the advantage of cutting cross most biotopes that might exist in the ecosystem. Thus 4 transects of total 12 km in length over 20 m in width were established (). Each transect was subdivided along with plots of 0.5 ha (250 m × 20 m). At the beginning of each plot, individuals with diameter at breast height (DBH) between 5 and 20 cm were counted for a distance of 10 m. All individuals of at least 20 cm of DBH were numbered throughout the remaining 240 m. Diameter at 1.30 m from the ground, local name and height of each tree were recorded. Correspondences with scientific names were established from the identification manual of Vivien and Faure (Citation2012). Identification of land-use types was done using guidelines established by ONADEF (Citation1991).
Figure 3. Localization of transects.
Data analysis
Data analysis was performed with Excel 2013 software. Density and basal area was estimated by the formula given by Kent and Coker (Citation1992) and Pial et al. (Citation2007). Density (D): density is the number of individuals per hectare. It was calculated by converting the total number of individuals encountered in all plots to equivalent number per hectare, following this formula:
(1)
with: D the density (stems ha−1), N the number of stems present on the considered surface and S the area considered (ha).
Basal area (BA): provides information on the area occupied by tree sections at 1.30 m from the ground. The formula is
(2)
where BA is basal area (m2 ha−1), d is diameter (cm).
Aboveground biomass: Tree biomass was estimated according to allometric equation developed by Chave et al. (Citation2014). In the absence of specific equation for each species is was suitable to use this common equation because this model is based on trees harvested from moist tropical forest sites around the world. The equation is as follow:
(3)
where: AGB is the aboveground biomass of the tree (kg); D the diameter (cm); H the total height (m); ρ the specific density (g.cm−3). The specific densities of species given by Vivien and Faure (Citation2012) were used.
Estimation of belowground biomass was in conformity with the guidelines established by IPCC (Citation2006). The equivalence in root biomass of standing trees was found by multiplying the value of the aboveground biomass (AGB) by a coefficient R whose value is estimated at 0.24.
(4)
where: BGB is the belowground biomass; AGB the aboveground biomass and R the root/stem ratio.
Carbon stock: carbon stock was obtained by multiplying the sum of the biomasses (aboveground and belowground) by a conversion factor of 0.47 (IPCC Citation2006) and converted to tons of carbon per hectare (t C ha−1).
(5)
where: C is total carbon stock, AGB is aboveground biomass and BGB is belowground biomass.
The total stock of carbon (estimated in t C ha−1) was converted into equivalent amount of CO2 absorbed using the ratio 44/12 corresponding to the CO2/C Ratio.
Statistical analysis
One-way analysis of variance (ANOVA) was used to find whether the land-use type influences trees density, basal area and carbon stock. The student test was used to separate the means when the difference was significant.
Results and discussion
Dynamic of land-cover from 1984 to 2016
The land cover mapping identified four classes namely bare soil and built up area, dense forest, clear forest and savannah ().
Bare soil and built up area have been grouped because in the villages bordering the FER-UDs, most houses have roofs made of straw and therefore have the same reflectance as the ground.
Dense forest consists of primary and secondary forests, as well as swamp forests.
Clear vegetation appears to be a degraded forest. In the field, it can also correspond to farms planted with trees and cocoa plantations.
Savannah and cropland have the same reflectance in the Satellite images and are concentrated along the roads and around the habitats of the two villages.
Burned areas appear to the 2016 image within the savannah probably due to bushfires
Figure 4. Dynamic of land-cover of FER-UDs from 1984 to 2016.
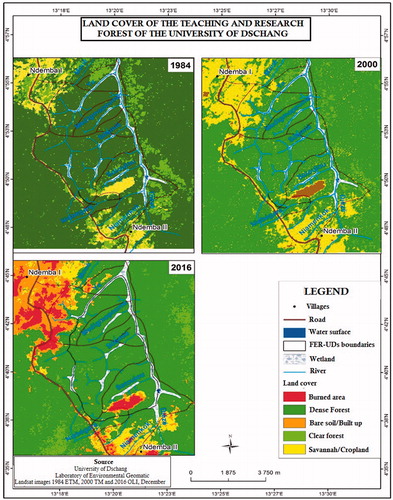
shows that forest cover of FER-UDs has evolved in recent years. The evolution is however less marked when one moves away from the two neighbouring villages which are Ndemba I and II. This shows the progressive influence of man on his living environment with a continuous quest for new and more fertile lands for agricultural activities and the exploitation of wood to supply cities. Swamps are virtually the only land-use that has not changed. This is because these areas are not very accessible and are not very suitable for agriculture.
On the 2016 image, however, there was less disturbance in the north-western part of the FER-UDs. This observation is justified by the transformation of the mixed crop fields that were found there to cocoa plantations in recent years. shows the changes in surface areas of different land-cover from 1984 to 2016.
Table 1. Surface area (ha) and proportions (%) of land cover types in FER- UDs in 1984, 2000 and 2016.
Table 2. Values of overall accuracies and Kappa index.
It appears from that dense forest was the dominant land-cover but it is declining progressively, losing 937 ha between 1984 and 2000, or 8.44% of its original area. This loss becomes 931 ha between 2000 and 2016, which is 9.16% of its area in 2000. Clear forest firstly decreased of 734 ha (0.72% of its initial surface area) between 1984 and 2000, in favour of savannah vegetation, before rising and almost returning to its original size (1027 ha in 1984, 293 ha in 2000 and 1.024 ha in 2016). This translate the interest that populations are gradually developing in cocoa cultivation.
Bare soil/built up area expanded slowly from 1984 (0.39%) to 2000 (1.46%) but the expansion became exponential between 2000 (1.46%) and 2016 (12.46%). The high evolution of bare soils/built up reflects the rapid population growth due not only to the high birth rate, but also to the return to village of young people who are unable to find jobs in big cities. This phenomenon has been also described by Boudigou et al. (Citation1996) in south Cameroon.
Bush fire is also a driver of this degradation, this is what explains the appearance of burned areas in 2016. The appearance of bush fire may be explained by a much rougher dry season that dried up biomass, source of fuel for bush fires.
By grouping clear vegetation and dense vegetation in the forest class, we obtain a decrease in forest area of 1871 ha between 1984 and 2016, or 15.43% compared to its surface area in 1984. These losses imply a deforestation rate of 0.48% per year between 1984 and 2016. By decomposing this rate of deforestation according to the two time intervals, there were forest losses of 13.78% between 1984 and 2000 (i.e. an annual net deforestation rate of 0.86%). Restoration of deforested land between 2000 and 2016 results in a net deforestation rate of 0.06% per year for this period. This low rate of deforestation for the second period does not mean a decline in human activities in the area, but rather a change in the type of land-use. Many cocoa farms were indeed, created in the north-western part of the FER-UDs. As the resolution of the Landsat images used was rather low (30 m), disturbances due to the creation of cocoa farms could not be detected. These cocoa farms are therefore represented on these images as open vegetation in the same way as young secondary forests.
All image classifications as can be seen in shown an overall confusion of less than 20% with overall accuracy and degree of representation of world real world ground truths (Kappa index) of more than 80% (). These values of Kappa index prove that the classifications performed are reliable if we refer to the scale of Landis and Koch (Citation1977). The rate of deforestation observed in our study area is smaller than that of 0.65% reported by de Wasseige et al. (Citation2014) for 1990–2000 period in eastern region of Cameroon, but is higher than that of 0.13% found by Ernst et al. (Citation2013) for the Congo Basin for the same period. However, the trend is not further deforestation because in recent years, following the pre-classification meetings of this forest in teaching and research forest, it has been agreed that only cultivation of cocoa under shade will be allowed inside the forest. As a result, populations for fear of being dispossessed of agricultural plots, have a keen interest in cultivation of cacao. The latter being under shade, conserve part of the trees and forest cover. Agriculture like all other activities carried out by local populations is concentrated in the easily accessed zones (forest borders, zones close to the villages) as shown in .
Figure 5. Mapping of activities carried out within FER-UDs.
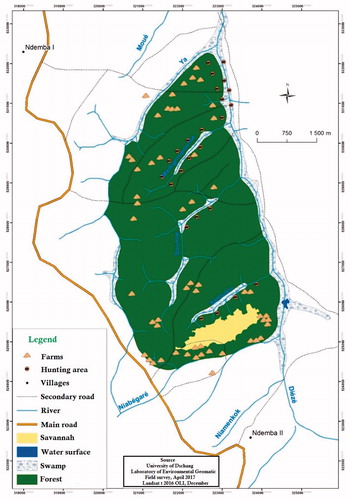
Table 3. Basal area and trees density in different land-uses types.
Dense vegetation is experiencing an essentially regressive evolution, while bare-soil and savannahs are increasing in size. This trend is similar to those observed in many other areas of Cameroon and in other African countries (Benoudjita and Djinet Citation2017; Momo Solefack et al. Citation2018; Toh et al. Citation2018; Zakari et al. Citation2018). Deforestation of FER-UDs is explained by many factors such as expansion of agriculture area and settlements due to a growing population, but also logging activities. Momo Solefack et al. (Citation2018) and Toh et al. (Citation2018) reported similar drivers of deforestation respectively around Koupa-Matapit gallery forest and in Mount Bambouto caldera of the western highland in Cameroun. In the tropics in general, the development of human activities such as agriculture has a direct impact on forest cover as reported by many authors (Lambin et al. Citation2003; Carpe Citation2005; Dibi N’Da et al. Citation2008; Jansen et al. Citation2008). Geist and Lambin (Citation2002) reported that the main drivers of tropical deforestation and degradation are the combination of several factors, including the expansion of peasant agriculture and timber extraction.
Types of land-use identified
Six main types of land-use have been identified within FER-UDs.
Swamps
Swamps represent 7.53% of the land-use types. These formations are located along rivers and are of two types: permanently swamps that are flooded over the year and temporal swamps. Permanent swamps are dominated by palms and in temporal swamps we have palms and other tree mainly Musanga cecropioides, Pycnanthus angolensis, Strombosiopsis tetrandra, Alstonia boonei, Desbordesia glaucescens and Sterculia tragacantha.
Adult secondary forest
The vegetation of FER-UDs is typically of secondary forests. The entire area has experienced logging by the Belabo forest and industrial company between the 1970s and the 1990s. Adult secondary forests were dominant and accounted for 64.10% of land-use types. They have high trees density and the dominant species is Pycnanthus angolensis with trees of large diameters, a characteristic of adult secondary forests. There are adult trees of Musanga cecropioides in the process of degeneration. Other abundant species are Petersianthus macrocarpus, Hylodendron gabunense and Coelocaryon preussii.
Young secondary forests
They accounted for 7.54% of land-use and are characterized generally by trees of small diameter, represented by Musanga cecropioides, Pycnanthus angolensis, Albizia glaberrima and Rapanea neurophylla.
Herbaceous savannah
It is mainly the large savannah found in the southern part of the FER-UDs. The soil is covered with elephant grass (Imperata cylindrica) and ferns with sparse presence of sub-shrubs of the genus Annona. This savannah represented 9.59% of land-use. Far from being the result of an anthropic disturbance, this savannah is a natural opening or forest clearing on dry soil. Natural forest clearings are considered open areas in the forest with, if at all, only a sparse presence of trees or shrubs that have not been (recently) opened by humans (Boupoya Citation2010).
Fallows
They represented 3.63% of land-uses in the FER-UDs. This category of land-uses type includes young and old fallows. They are characterized by the presence of banana (Musa sp.) and oil palm (Elaeis guineensis) within a vegetation dominated by Marantaceae. Most abundant tree species are Albizia glaberrima, Pycnanthus angolensis, Cordia platythyrsa, Musanga cecropioides.
Cocoa plantations and mixed crops farms
Agriculture is the main human activity in the area. Mixed crops farms made of banana, plantain, maize, cassava, cucumber, peanut, etc., most often requiring a high rate of lighting inducing an almost total clearance of the areas. Some tree species that are found in farms are Desbordesia glaucescens, Petersianthus macrocarpus, Alstonia boonei, Celtis zenkeri and Polyscias fulva. Cash crops consist mainly of cocoa. In these agroforestry systems, farmers conserve or introduce trees that are useful such as Pycnanthus angolensis; Petersianthus macrocarpus, Terminalia superba, Musanga cecropioides, Dacryodes edulis, Persea americana and Mangifera indica. Mixed crop farms and cocoa plantations represented respectively 3.09% and 4.28% of the land-use types ().
Figure 6. Proportions of the different types of land-use.
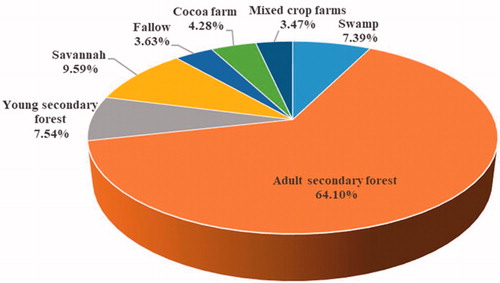
shows that more than 70% of the FER-UDs is occupied by secondary forests of which 64.10% are adult secondary forests and 7.54% young secondary forests. Agricultural activities (Fallows, mixed crop farm and cocoa plantation) represent more than 11%. In the surroundings of Lobéké National Park in Eastern Cameroon, Zapfack et al. (Citation2013) identified the types of land-use that we have identified in this study, but they also identified primary forest. Indeed, given the accessibility of our study zone, industrial logging activities between 1970 and 1990 and illegal artisanal logging transformed the primary forests into secondary forest and even into crop farms.
Basal area and tree density of different types of land-use
Basal area and trees’ density () are used to assess presence of trees in different land-uses. Since herbaceous savannahs are land-use types that are almost void of trees, they have not been considered here.
The highest basal area (42.54 m2 ha−1) was found in adult secondary forests. Mixed crop farms showed the lowest basal area (18.56 m2 ha−1), followed by fallows. One-way ANOVA test at the 5% probability showed significant differences between basal areas in different land-use (P = 0.00005 < P = 0.05). Trees’ density ranges from 76.40 stems ha−1 in fallows to stems ha−1 in adult secondary forests. There is a high linear correlation between basal area and tree density in different land-use (R2 = 0.90). Basal area depends not only on the trees’ density but also on the diameter of these trees. The basal areas in land-use types in our study area were relatively higher than those found by Kashung et al. (Citation2018) in land-use types in West Kameng district of Arunachal Pradesh in India.
Our study showed that basal area and trees’ density are affected by forest modification and land-use patterns. From adult secondary forest to mixed crop farms, more than 60% of trees are lost. These results corroborate those found by Zapfack (Citation2002) in the areas of Mbalmayo and Ebolowa and Bobo et al. (Citation2006) in the south-western forests of Cameroon, which showed that highly anthropogenic environments, namely plantations and fallows, have low basal area and low trees’ densities compared to primary and secondary forests.
Carbon stock dynamic
The results obtained from the estimation of average carbon stocks per unit area in the different land-use types are summarized in . Also, here are excluded savannahs because they are void of trees.
Table 4. Carbon stocks and amount of CO2 absorbed in different land-uses types.
reveals that the largest amount of carbon was found in adult secondary forests, followed by young secondary forests and swamps. Mixed crop farms appeared to have the lowest carbon stocks. In the latter type of land-use, carbon is essentially contained in trees with diameters greater than or equal to 20 cm. Those with diameters less than this value having been cut in the creation of farm. The difference of the carbon stocks and CO2 sequestration rate between land-uses are significant (P = 0.0003 < P = 0.05). In fact, when converting adult secondary forest into mixed crop farm, the amount of CO2 absorbed from the atmosphere decreased from 917.94 t CO2 ha−1 to 340.44 t CO2 ha−1.
These results corroborate those found by Silatsa et al. (Citation2016) in Ayos forest where for secondary forests the average carbon stocks were 211 t C ha−1. Carbon stocks found here are also within the ranges given by Kotto-Same et al. (Citation1997) for secondary forests, fallows, cocoa and mixed crop farms in the humid forest zone of Cameroon. These results are also close to those found by Zapfack et al. (Citation2013) in Lobéké National Park surroundings where carbon stored in swamps and plantations was estimated at 167 t C ha−1 and 94 t C ha−1, respectively. However, in this previous study, they considered biomass of litter and herbaceous. Carbon stocks found in swamps were close to those of 117.98 ± 29.54 found by Kamruzzaman et al. (Citation2018) in mangrove communities in Bangladesh and are higher than those of 53.45 ± 43.72 reported by Kumar and Sharma (Citation2015) in Balganga reserve forest in India.
Our results show that more than 60% of carbon is lost between adult secondary forest and mixed crop farms. The low amount of carbon found in mixed crop farms is justified by the practice of slash and burn agriculture, which is recognized by several authors as the agricultural practice causing more damage in terms of carbon stocks loss (Kotto-Same et al. Citation1997; Njomgang et al. Citation2011; Zapfack et al. Citation2013). Cocoa-based agroforestry systems showed carbon stocks relatively close to those of young secondary forests. Agroforestry practices that enable trees to be conserved or introduced into farm are seen by many authors as a sustainable land-use option that can help resolve certain threats to environment, including climate change and loss of biodiversity (Torquebiau et al. Citation2002; Saj et al. Citation2017). These practices are to be encouraged for a sustainable and integrated management of FER-UDs. Then, farmers should be assisted in the choice of species, production of good plant materials and tree management.
Conclusion
In the teaching and research forest of the University of Dschang, the dense forest is declining. The rate of deforestation is higher than that reported in the Congo Basin. The main activities responsible are agriculture and logging. Construction of new human habitats can also be taking into consideration as driver of this change. These activities affect the carbon sequestration potential of the forest. The conversion of a secondary forest into crop farms reduces carbon stocks by more than half. However, there is a keen interest of local population for cocoa plantation. These agroforestry systems that better preserve woody species, forest cover and carbon stocks than other cropping systems are the only ones that should be encouraged in the FER-UDs. For a sustainable management of the FER-UDs and considering the needs of local populations, the University of Dschang should accompany them in agroforestry practices and domestication of value trees. The results of this study will constitute a reference level for the medium and long term monitoring of the forest cover and carbon stocks evolution in the FER-UDs.
Acknowledgements
We wish to thank the Laboratory of Environmental Geomatic of the University of Dschang for funding our research and the populations of the Ndemba 1 and 2 villages for their collaboration.
Disclosure statement
No potential conflict of interest was reported by the authors.
References
- Barakat A, Khellouk R, El Jazouli A, Touhami F, Nadem S. 2018. Monitoring of forest cover dynamics in eastern area of Béni-Mellal Province using ASTER and Sentinel-2A multispectral data. Geo Ecol Landscapes. 2(3):203–215.
- Benoudjita N, Djinet IA. 2017. How protected areas structure the periphery ecosystems. Int J Bio Chem Sci. 11:2225–2242.
- Bobo KS, Waltert M, Sainge NM, Njokagbor J, Fermon H, Muehlenberg M. 2006. From forest to farmland: Species richness patterns of trees and understorey plants along a gradient of forest conversion in south-western Cameroon. Biodivers Conserv. 15:4097–4117.
- Boudigou R, Bley D, Pagezy H, Vernazza-Licht N. 1996. The return to the village of migrants as an example of the city/forest interactions in South Cameroon. In: Bley D, Champaud J, Baudot P, Brun B, Pagezy H, Vernazza-Licht, editors. Cities of south and environment. Châteauneuf de Grasse, France: Editions de Bergier; p. 225–241.
- Boupoya A. 2010. Flora and vegetation of intra-forest clearing on hydromorphic soil in Ivindo National Park (North-East Gabon) [PhD thesis]. Belgium: Free University of Brussels.
- CARPE. 2005. The forest of the Congo Basin: a preliminary assessment. Yaounde, Cameroon: Central African Regional Program for the Environment (CARPE).
- Chave J, Réjou-Méchain M, Búrquez A, Chidumayo E, Colgan MS, Delitti WBC, Duque A, Eid T, Fearnside PM, et al. 2014. Improved allometric models to estimate the aboveground biomass of tropical trees. Glob Chang Biol. 20:177–190.
- CTFT. 2013. Socio-economic study for the development of Belabo-Diang forest reserve. Technical centre of communal forest (CTFC). Belabo-Cameroun.
- Cuny P. 2011. State of the community and communal forestry in Cameroon. Tropenbos International Congo basin program, Netherlands.
- De Wasseige C, Flynn J, Louppe D, Hiol Hiol F, Mayaux P. 2014. Congo basin forest: state of the forests 2013. Belgium: Weyrich.
- De Wasseige C, Tadoum M, Eba’a Atyi R, Doumenge C. 2015. Congo basin forests: forest and climate changes. Weyrich, Belgium: COMIFAC/OFAC.
- Dibi N’Da H, N’Guessan KE, Wadja ME, Affian K. 2008. Contribution of remote sensing to the monitoring of deforestation in the Marahoué National Park (Ivory Coast). Revue Teledet. 8(1):17–34.
- Ernst C, Mayaux P, Verhegghen A, Bodart C, Musampa C, Defourny P. 2013. National forest cover change in Congo Basin: deforestation, reforestation, degradation and regeneration for the years 1990, 2000 and 2005. Glob Chang Biol. 19(4):1173–1189.
- FAO. 2008. Financial mechanisms for adaptation to and mitigation of climate change in the food and agriculture sectors, Paper presented at the high level conference on world food security: The challenges of climate change and bioenergy, Rome, 3-5 June 2008.
- Geist HJ, Lambin EF. 2002. Proximate causes and underlying driving forces of tropical deforestation. Bioscience. 52(2):143–150.
- Hansen MC, Potapov PV, Moore R, Hancher M, Turubanova SA, Tyukavina A, Townshend JRG. 2013. High-resolution global maps of 21st-century forest cover change. Science. 342:850–853.
- IPCC. 2006. 2006 IPCC guidelines for national greenhouse gas inventories. In: Eggleston HS, Buendia L, Miwa K, Ngara T, Tanabe K, editors. Guidelines for national greenhouse gas inventory: agriculture, forestry and other land-use. Japan: IGES.
- Jansen LJM, Carrai G, Morandini L, Cerutti PO, Spisni A. 2008. Analysis of the spatio-temporal and semantic aspects of land-cover/use change dynamics 1991-2001 in Albania at national and district levels. Environ Monit Assess. 119:107–136.
- Kamruzzaman MD, Shamim A, Sumonta P, Mizanur Rahman MD, Akira O. 2018. Stand structure and carbon storage in the oligohaline zone of the Sundarbans mangrove forest, Bangladesh. Forest Sci Technol. 14(1):23–28.
- Kashung Y, Das B, Deka S, Bordoloi R, Paul A, Tripathi OP. 2018. Geospatial technology based diversity and above ground biomass assessment of woody species of West Kameng district of Arunachal Pradesh. Forest Sci Technol. 14(2):84–90.
- Kent, M, Coker, P. 1992. Vegetation description and analysis: a practical approach. England: John Wiley and Sons Ltd.
- Kotto-Same J, Woomer PL, Moukam A, Zapfack L. 1997. Carbon dynamics in slash and burn agriculture and land-use alternatives in the humid forest zone of Cameroon. Agric Ecosyst Environ. 65(3):245–246.
- Kumar A, Sharma MP. 2015. Estimation of carbon stocks of Balganga Reserved Forest, Uttarakhand, India. Forest Sci Technol. 11(4):177–181.
- Kushwaha SPS, Nandy S, Ahmad M, Reshu A. 2010. Forest ecosystem dynamics assessment and predictive modelling in eastern Himalaya. Int Arch Photogramm Remote Sens Spatial Inf Sci. 38(8):155–161.
- Landis JR, Koch GG. 1977. The measurement of observer agreement for categorical data. Biometrics. 33:159–174.
- Langevin C. 2012. REDD + mechanism: synthesis for forest industries in Central Africa. Bogor, Indonesia: CIFOR/TEREA.
- Lambin EF, Geist HJ, Lepers E. 2003. Dynamics of land-use and land-cover change in tropical regions. Annu Rev Environ Resour. 28:205–241.
- Letouzey R. 1985. Explanatory note for phytogeography map of Cameroon at 1/500,000. Biological Encyclopaedia 69, Edition Paul Le Chevalier, Paris, 1985.
- Loveland TR, Dwyer JL. 2012. Landsat: Building a strong future. Remote Sens Environ. 122:22–29.
- Lucas R, Blonda P, Bunting P, Jones G, Inglada J, Arias M, Kosmidou V, Manakos I, Adamo M, Charnock R, et al. 2015. The earth observation data for habitat monitoring system. Int J Appl Earth Obs Geoinf. 37:17–28.
- Ndoh-Nyemble C. 2016. Characterization of the vegetation of the teaching and research forest of the “block FASA Ndemba” of Belabo-Diang (East-Cameroun): constraints and opportunities for its classification. University of Dschang.
- Njomgang R, Yemefack M, Nounamo L, Moukam A, Kotto-Same J. 2011. Dynamics of shifting agricultural systems and organic carbon sequestration in Southern Cameroon. Tropicultura. 29:76–182.
- Momo Solefack MC, Njouonkouo AL, Temgoua LF, Djouda Zangmene R, Wouokoue Taffo JB, Ntoukpa M. 2018. Land-use/Land-cover change and anthropogenic causes around Koupa-Matapit gallery forest, West-Cameroon. J Geo Geol. 10(2):56–65.
- Mukete B, Sun Y, Baninla Y, Achem Baye J, Bakia M, Sajjad S, Tamungang R, Jaba W, Chalwe P. 2017. Perspectives of Remote Sensing and GIS Applications in Tropical Forest Management. Am J Agric For. 5:33–39.
- ONADEF. 1991. Planning and pre investment inventory standards. MINFOF.
- Parker C, Mitchell A, Trivedi M, Mardas N. 2009. REDD+’s little red book. A guide to governmental and non-governmental proposals to reduce emissions related to deforestation and forest degradation. Second Edition, Global Canopy Program.
- Pial J, François D, Cordonnier T, Tran-Ha M. 2007. Basal area: methods of measurement and interest. ONF Rdv technique. 18:9–16.
- Romijn E, Lantica CB, Herold M, Lindquist E, Ochieng R, Wijaya A, Murdiyarso D. 2015. Assessing change in national forest monitoring capacities of tropical Countries. Forest Ecol Manag. 352:109–123.
- Saj S, Durot C, Mvondo-Sakouma K, Tayo Gamo K, Avana-Tientcheu ML. 2017. Contribution of companion trees to long-term tree conservation, carbon storage and agroforest sustainability: a functional analysis of the diversity in cacao plantations of Central Cameroon. Int J Agric Sustain. 15:282–302.
- Salimon CI, Putz FE, Menezes-Filho L, Anderson A, Silveira M, Brown IF. 2011. Estimating state-wide biomass carbon stocks for a REDD plan in Acre, Brazil. Forest Ecol Manag. 262(3):555–560.
- Silatsa TF, Yemefack M, Ewane-Nonga N, Kemga A, Hanna R. 2016. Modelling carbon stock dynamics under fallow and cocoa agroforestry systems in the shifting agricultural landscape of Central Cameroon. Agrofor Syst. 91:999–1006.
- Toh FA, Angwafo T, Ndam LM, Mvondo Ze A. 2018. The socio-economic impact of land use and land cover change on the inhabitants of Mount Bambouto Caldera of the Western Highlands of Cameroon. Adv Remote Sens. 7:25–45.
- Torquebiau E, Mary F, Sibelet N. 2002. Agroforestry associations and their multiple issues. Bois For Trop. 271:23–34.
- Vivien J, Faure JJ. 2012. Trees of the dense forests of Central Africa. France: Nguila Kerou.
- Wani AA, Joshi PK, Singh O, Shafi S. 2016. Multitemporal forest cover dynamics in Kashmir Himalayan region for assessing deforestation and forest degradation in the context of REDD + policy. J Mount Sci. 13:1431–1441.
- WWF. 2016. Living planet report 2016: risk and resilience in the Anthropocene. Switzerland: WWF Gland.
- Yeshaneh E, Wagner W, Exner-Kittridge M, Legesse D, Blöschl G. 2013. Identifying land use/cover dynamics in the Koga catchment, Ethiopia, from multi-scale data, and implications for environmental change. ISPRS Int J Geo-Inf. 2:302–323.
- Zakari S, Toko I, Thomas OAB, Djaouga M, Arouna O. 2018. Application of remote sensing and GIS to the monitoring of plant formations of the classified forest of the three rivers in north-eastern Benin. Eur Scient J. 14:450–469.
- Zapfack L. 2002. Impact of shifting cultivation on plant biodiversity and carbon sequestration [PhD thesis]. University of Yaoundé I.
- Zapfack L, Noiha Noumi V, Dziedjou Kwouossu PJ, Zemagho L, Fomete Nembot T. 2013. Deforestation and carbon stocks in the surroundings of Lobéké National Park (Cameroon) in the Congo Basin, Env Nat Resour Res. 3(2):78–86.