
Abstract
This study analyzed the distribution of forest income and other variable sources of rural household income and considered their importance for the reduction of income inequality and poverty. We employed Gini decomposition to measure the contribution of forest income and other sources of income to income equality and assess whether they were inequality-increasing or inequality-decreasing in the 14 villages. The forest income Gini correlation with total income was very high, Rk = 0.6960, and the forest income share of total rural household income was 35% (Sk = 0.3570). If the income earned from forest activities was removed, the Gini index would increase by 10.3%. Thus, if people could not access forest resources because of vast deforestation, perhaps from the limitations of government-managed forestry, unplanned clearing of forest land for agriculture or the granting of ELCs, there would be an increase in income inequality and poverty among rural households. The findings suggest that policy makers should look beyond agriculture for rural development, as forest resources provide meaningful subsistence income and perhaps contribute to both preventing and reducing poverty and inequality in rural communities. The study found that non-farm activities were inequality-increasing sources of income. The share of non-farm income to the total rural household income was Sk = 0.1290 and the Gini index of non-farm income was very high, Gk = 0.8780, compared with forest and farm income. This disagrees with other studies which have reported that non-farm income was inequality-decreasing for the rural poor.
Introduction
The economic value of forest resource extraction by rural households can be estimated. It has been suggested that forestry or environmental services’ income should be included in national socioeconomic surveys (Wunder et al. Citation2016; Nhem et al. Citation2018) as at least 20% of rural household income, in developing countries, is provided by forest and tree products (FAO Citation2018). Two years ago, the Food and Agriculture Organization of the United Nations (FAO) introduced important guidance, ‘National socioeconomic surveys in forestry: Guidance and survey modules for measuring the multiple roles of forests in household welfare and livelihoods’ (Wunder et al. Citation2016). This guidance aims to strengthen national-level data collection on forest and wild products (Wunder et al. Citation2016).
At least 1.6 billion poor people remain dependent on forests for their livelihoods (Nasar et al. Citation2016) and FAO (Citation2018) estimated that at least 40% of the extremely poor live in forest areas and use forest products and services. In Nepal, Rayamajhi et al. (Citation2012) indicated that income from forest resources extraction made up at least 22% of household income. Similarly, Babulo et al. (Citation2009) reported that environmental product income accounted for 35% of rural income in Zimbabwe. These authors added that income from forest activity contributed 30%, 39%, and 17–45% to rural household income in Malawi, Ethiopia and Bolivia, respectively.
However, empirical studies, such as Babulo et al. (Citation2009) and FAO (Citation2018), reported that the economic contribution of forest income has not been documented well enough in national socio-economic surveys. The reasons may include lack of accurate data related to forest services at community level and problems with measurement methods (Babulo et al. Citation2009). The studies claimed that the more accurately forest resources used by forest-dependent communities are valued, the better the understanding of dependence on forest products and the more realistic the measurement of rural poverty and income inequality (Babulo et al. Citation2009; Nhem et al. Citation2018).
Even though forest income may not provide the largest percentage of the total income of rural household, it is extremely important for households operating at subsistence level. It helps to fill gaps in short- or long- term income (Babulo et al. Citation2009; Nhem et al. Citation2018) and is a safety net for income crises (Babulo et al. Citation2009; Nasar et al. Citation2016). It has been recognized that income from forest resources also helps to reduce poverty and income inequalities (Fonta and Ayuk Citation2013; Worku et al. Citation2014; Jiao et al. Citation2015; Nhem et al. Citation2018; Nguyen and Tran Citation2018).
Recent literature indicates that inequality has declined over the last few decades but will rise again after 2027 because of increasing population growth, economic growth and the age of the labor force (Kakwani Citation1980; Adams Citation1994; Martins Citation2015; Rougoor and Marrewijk Citation2015; Nhem et al. Citation2018). However, the decline of forest resources, from which forest-dependent people extract daily for food and income generation, are sometimes overlooked in the assessment of future rural inequality and poverty. We observe that forest income remains important for poor rural households, so the continued deforestation and forest degradation could be an obstacle to the reduction of rural income inequality and poverty.
The Cambodian forest is an important carbon sink, containing 464 million metric tons of carbon, according to RGC (Citation2014, p.142). However, forest cover in Cambodia reduced from 58.60% in 1996 to 48.14% in 2016 (Ehara et al. Citation2016; MoE Citation2018; Nhem et al. Citation2018). The Royal Government of Cambodia (RGC) (RGC Citation2011, p.26) has asserted that an average of 1.1.% (142,500 ha) of forest cover was lost per year between 1990 and 2010. In 2014, RGC (Citation2014, p.142) reported that 75% of the population of Cambodia still live in rural areas and depend on forest resources (MAFF Citation2010, p.10), using forest services and products for cooking, food, income generation and the creation of employment for villagers from forest product-based enterprises. The RGC also recognized that some of the loss of forest coverage occurred in protected areas in Cambodia (RGC Citation2011).
The RGC is committed to sustainably protect forests through reforming the forest sector (RGC Citation2011; Nhem et al. Citation2018). Linked to this, Cambodia participates internationally in addressing the impact of climate change and works to fulfill its international obligations under UNFCCC and the 2030 Agenda for Sustainable Development (UN Citation2015c; Nhem et al. Citation2017). Cambodia has made good progress in reducing the poverty rate to 19.80% by 2011 (MoWA Citation2014, p.7) and inequality decreased from 39.6% to 35.6% between 2004 and 2009 (RGC Citation2011).
Researchers and policy makers have paid increased attention to the study of forest income as they see it as a key source of income for rural households, reducing rural poverty and inequality. For example, Khundi et al. (Citation2011); Rahut et al. (Citation2016); Makoudjou et al. (Citation2017) and Ali and Rahut (Citation2018) studied forest income and poverty in Uganda, Pakistan, Bhutan and Cameroon respectively. Jagger et al. (Citation2014) conducted a global study on forest income and poverty; Jiao et al. (Citation2015) examined rural household income in Cambodia; and Nguyen and Tran (Citation2018) researched forestland and rural livelihoods by analyzing forest income in Vietnam.
This study analyzed the distribution of forest income and its impact on income inequality and poverty reduction in Kampong Thom, a rural province in Cambodia. The study employed Gini decomposition to understand the contribution of a number of income sources. Secondly, the study considered income inequality within villages and measured to what extent forest resources supplement the income of rural households. This paper is in four sections. We first give an overview of the current forest loss. We consider the global and national contribution from forest resources to rural income, the international attention to rural peoples’ dependence on forest resources (Arnold Citation1991), and the relationship between forest resources and rural livelihoods, poverty and inequality. Secondly, we describe the process of study site selection, data collection and the statistical methods employed to analyze the data. The third section presents the findings and discusses them, with reference to other studies related to the socio-economics, forest income shares in the total household income and reduction of income inequality and poverty of forest-dependent peoples. The last section provides conclusions and recommendations of how to add value by improving forest products and services, and sustainable forestry in Cambodia.
The relationship between forest resources, rural livelihoods and income inequality
Since 1970s, governments and international dialogue and agreements have drawn attention to rural peoples’ dependence on forest services and the impact of climate change. Emphasis has been given to the impact of deforestation and ways to reduce rural income inequality and poverty (Kakwani Citation1980; UN Citation1987; Arnold Citation1991; Fonta and Ayuk Citation2013; MacDicken et al. Citation2015; FAO Citation2018). Yet these issues remain unresolved. For example, Schmitt et al. (Citation2009); Park et al. (Citation2013); Keenan et al. (Citation2015) and FAO (Citation2016) asserted that there was a 3% net decrease in global forest area between 1990 and 2015, from 4128 M ha to 3999 M ha. In addition, FAO (Citation2018, p.xi) reported that forest cover decreased from 31.6% to 30.6% of global land area between 1990 and 2015, while UN (2015) estimated that at least 5.1 million hectares of forest had been lost by 2010. Looking at some sub-regions, the decrease of forest areas in South-Southeast Asia was from 319,615 k ha (1990) to 292,804 k ha (2015), while in East Asia the decrease was from 209,198 k ha (1990) to 257,047 k ha (2015), according to Keenan et al. (Citation2015).
The UN (2015) claimed that ‘deforestation remains alarmingly high in many countries’, releasing carbon into the atmosphere and leading to climate change. One of the reasons is poor forest management (Miah et al. Citation2014; UN Citation2015a, Citation2015b, Citation2015c). Loss of forest resources for extraction also affects rural livelihoods (Arnold Citation1991; Camacho and Camacho Citation2006; Jagger Citation2012; Nasar et al. Citation2016; FAO Citation2018; Nhem et al. Citation2018) and threatens the survival of wildlife (RECOFTC Citation2013; Bredin et al. Citation2015; UN Citation2015a, Citation2015b; Wunder et al. Citation2016; FAO Citation2018).
Studies have described deforestation and the decline of forest resources as a ‘public bad’ – the opposite of a ‘public good’ (Krott Citation2005; Tacconi Citation2007; Sadath and Rahman Citation2014; Kim and Alounsavath Citation2015; Boyce et al. Citation2016; Ehara et al. Citation2016). Consequently, significant global resolutions have called for attention to climate change to reduce emissions from deforestation and forest degradation and manage forests sustainably. Examples include; 1) UNFCCC (UN Citation1992; Park et al. Citation2013); 2) the adoption of the Paris Agreement (UN Citation2015a; Bretschger et al. Citation2018; Nieto et al. Citation2018); and, most recently, 3) the 2030 Agenda for Sustainable Development, adopted by United Nations in 2015 (UN Citation2015c; Nilsson and Persson Citation2017; Bukoski et al. Citation2018). Bukoski et al. (Citation2018); FAO (Citation2018) and Swamy et al. (Citation2018) have pointed out that several indicators of Sustainable Development Goal (SDG) 15 focus on forests, monitoring forest land and the sustainable management of forests. This indicates a global wish to sustainably manage and restore forests around the world.
Under SDG15, the State Parties agreed to protect, restore and promote sustainable use of terrestrial ecosystems, sustainably manage forests, combat desertification, and halt and reverse land degradation and halt biodiversity loss (UN Citation2015c). This requires them to implement policies and national plans of action, build capacity and arrange their national institutions accordingly. Even if some of those governments seemed to have the capacity to manage their forests, empirical studies have documented that degradation continues in practice as many developing countries have weak control over forestry and poor rural livelihood strategies (Arnold Citation1991; Manandhar and Shin Citation2013; Tadesse et al. Citation2017; FAO Citation2018; Nhem et al. Citation2018). There is still extreme rural poverty: The World Bank (Citation2016, p.5) reported that 10.7% of the world’s population lived on less than 1.90$a day in 2013. Nepal, Vietnam and Cambodia all have high inequality of income distribution (Kakwani Citation1980; Devkota Citation2010; Gatiso and Wossen Citation2015; Nguyen and Tran Citation2018) and low rates of education among rural people (Wells Citation2006; Silveira Neto and Azzoni Citation2011; The World Bank Citation2016, p.2). All of these may lead the rural poor to clear more forest land for cash crops, smuggle wild animals, and illegally cut trees for their daily livelihoods (Babulo et al. Citation2009; Haughton and Khandker Citation2009; FAO Citation2018, p.xiv; Nhem et al. Citation2018).
Methods
Study sites
This research was conducted in 14 villages and 11 community forestry (CF) sites in Kampong Thom province, a rural province in Cambodia. These CF are: 1) Prey-chrang-krohorm; 2) Prey-ou-kom-bot; 3) Tropeng-rung; 4) Prey-kbal-o-thnung; 5) Prey-kbal-ta-kong; 6) Prey-cheuong-phum; 7) Prey-ta-yorng; 8) Prey-chorm-smach; 9) O-chrang-sor; 10) Prey-phum-chas; and 11) Prey-rung-khnong (). The names of the 14 villages are listed in : Decomposition of income inequality by village. Kampong Thom is located in the Tonle Sap Region, and has the 10th largest population of all provinces in Cambodia, 4.71% (MoP Citation2013, p.22), with 631,409 inhabitants (female = 65.1%) in 2008, and 620,476 hectares of forest land. It is the province with the largest number of CF sites (CF = 82) (FA Citation2015, p.11). It is also one of the 10 poorest provinces in Cambodia (poverty rate = 23.8%) (ADB Citation2015, p.34).
The population in this province rely heavily on forest resource products and agriculture (WSP-EAP et al. Citation2014; Ehara et al. Citation2016; Nhem et al. Citation2018). In addition, this province is home to the Kouy indigenous people, the largest ethnic minority group in Cambodia (Nhem et al. Citation2018). Their livelihood relies heavily on forest resource extraction. Kampong Thom is one of the seven provinces which have high Forest Reference (Emission) Levels (FREL/FRLs), 68.7% over a 30-year period, according to Sasaki et al. (Citation2016). These authors also added that the forest cover change in Kampong Thom province was - 0.4% between 2002 and 2006.
Data collection
The 14 villages were purposively selected. The CF Statistics 2015 mini book details all CF sites by year of creation, and lists CF belonging to specific villages, communes, districts, provinces and households (FA Citation2015; Nhem et al. Citation2018). A local, forestry-based non-governmental organization based in Kampong Thom advised us to conduct this study in these particular villages as their households accessed and used forest resources from the 11 community forestry sites. 321 households were selected but only 277 of them were used for Gini decomposition analysis because 44 respondents decided to leave the interview process and did not report their sources of income. These uncompleted questionnaires were removed. The final sample size consisted of 161 women and 116 men.
A structured questionnaire in the local language, Khmer, was designed to gather information about the source of household income. Respondents reported their income from 10 activities (variables): 1-rice farming, 2-livestock, 3-hunting wild animals, 4-collection of non-timber forest products, 5-selling low quality timber (small household scale), 6-fishing (capture of wild fish) (see: Wunder et al. Citation2016), 7-plantation (tree crop plantation) (see: Wunder et al. Citation2016), 8-self-employment, 9-employment, and 10-other sources. We consolidated these 10 variable sources into three groups: 1-farm income, 2-forest income, 3-non-farm income. The questionnaires were pre-tested with the interview respondents prior to conducting the field survey. Enumerators were recruited from the staff of Action for Development (AFD), a local non-governmental organization, which implements a number of projects on forestry, community forestry, agriculture and REDD + activities in Kampong Thom province. We approached the heads of villages, heads of CF, members of CF management, local teachers, youth, older people and women for the structured interviews.
Data analysis: Gini decomposition to measure income inequality
The prime purpose of this study was to understand the rural socio-economic situation, especially income from forest resource extraction. We employed Gini decomposition (Jagger Citation2012; Jiao et al. Citation2015; Liao Citation2016) to investigate the sources of households’ total annual income, The Gini measures the effect of forest income and other sources of income on income inequality in the 14 rural villages in the study. Corrado Gini invented the Gini index (Gini coefficient) in 1912, according to Lerman (Citation1985); Ceriani and Verme (Citation2012); Liao (Citation2016); Favero (Citation2017); Nhem et al. (Citation2018) and Pandit (Citation2018). In 1985, Lerman (Citation1985) introduced the decomposable Gini coefficient technique for analyzing the inequality of the topic of interest. In recent years, researchers have used Gini decomposition, run by Stata Software, to compute the inequality of: 1-forest income or other sources of income (Uberhuaga et al. Citation2012; Jiao et al. Citation2015; Nhem et al. Citation2018), 2-equality and benefits of water allocation/use in China, South Africa (Cullis and Koppen Citation2007; Wang et al. Citation2012; Dai et al. Citation2018), and 3-effect of education on income inequality (Wells Citation2006).
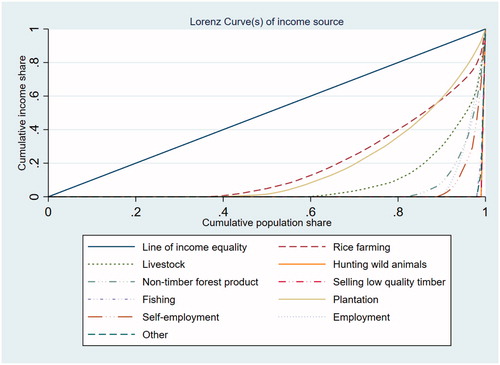
The so-called line of equality (or line 45 embedded in the Stata Software) is displayed as a diagonal straight line on a plot of the cumulative share of the number of people form poorest to richest (earning least to most) against the cumulative share of income earned. The ‘Lorenz Curve’ is the key observation to interpret the result of statistical analysis of Gini decomposition (Allison Citation1978; Lerman Citation1985; Nhem et al. Citation2018), see . The closer the Gini coefficient is to ‘0’, the greater the income equality (Cullis and Koppen Citation2007) while the closer Gini coefficient is to ‘1’, the more unequal the income distribution (or the higher the income inequality) (Liberati Citation2006; Ceriani and Verme Citation2012; Nhem et al. Citation2018). In this study, we used Stata 15 to compute the Gini decompositions of the income variables. For the formula of Gini decomposition, we followed Jagger (Citation2012); Fonta and Ayuk (Citation2013) and Jiao et al. (Citation2015):
(1)
where:
Figure 1. Map of Kampong Thom province in Cambodia highlighting the study site.
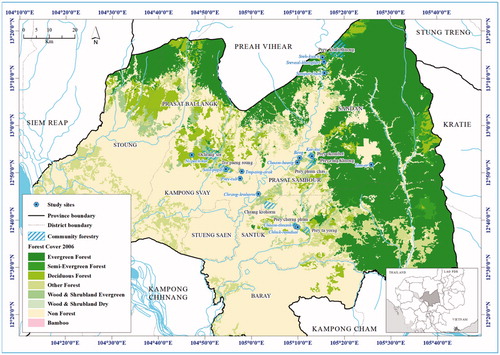
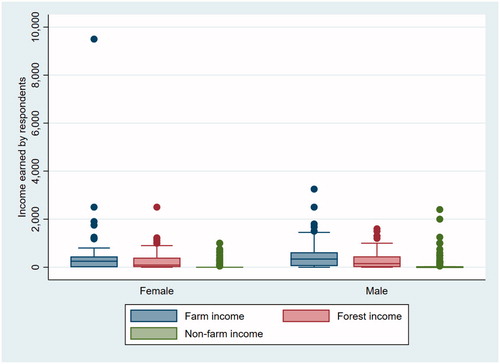
Figure 2. Comparative box/whisker plot indicating distribution of income variable by sex group.
Sk refers to the share of source of income ‘k’ in the household total income;
Gk refers to the disaggregated Gini coefficient for each income source ‘k’;
Rk is the Gini correlation between each income source ‘k’ and the cumulative distribution of total income.
Results and discussion
Socioeconomic and demographic characteristics
The 277 respondents who participated in this study live in 14 villages located in 9 communes and 6 districts in Kampong Thom province, Cambodia. Significantly more women participated in this study, 161 (58.12%) than men, 116 (41.88%). The respondents lived close to and extracted forest resources from the 11 community forestry sites (Ehara et al. Citation2016). shows the education level in the 14 villages. No-one had a post-graduate qualification and only one respondent, a man, had a Bachelor degree (Nhem et al. Citation2018). 99 women had received no formal education while 39 men were in the same situation. The same number of women and men, 40, had primary school as their highest formal education level. More men, 28, than women, 16, completed secondary school. 8 men and 6 women had completed high school. This reveals that educational attainment is very low in these villages, with a wide disparity between women and men (Nhem et al. Citation2018). The finding is in line with Nhem et al. (Citation2018) and RGC (Citation2011, p.18) who reported that the school dropout rates of girls remained high in Cambodia, even in higher education, and there was considerable education inequality between rural and urban areas. Recent literature reported that slightly more than 20% of women in Cambodia had never attended school, almost twice the percentage of men (MoLVT Citation2014, p.16). However, after years of effort, Cambodia has announced that ‘education for all’ has been achieved, for example, the primary education targets were most likely to be met in 2011 (RGC Citation2011, p.38).
Table 1. Socio-economic characteristics of respondents.
The majority of respondents gave ‘rice farmer’ as their occupation, 151 women and 92 men. There was no woman among the 8 Heads of Community Forestry in this study site. Only 2 women were village heads while 9 men held that role and 1 woman and 2 men were teachers. However a few more women were employed as workers, 5, than men, 2. Recently, MoWA (Citation2014) reported positive signs in women’s participation in decision making, such as the number of women offered Senate seats, 20.3% (2015) and women representatives at district and provincial level, 25% (2014). This study found there were only two women Head of villages out of the 14 villages. In the community, women often play important roles in community forestry management, forest patrolling and actively participate in combating illegal logging, but no woman was a Head of Community Forestry site in the study sites. More empirical studies, such as Agarwal (Citation2009) and Evans et al. (Citation2017), have reported that women face significant obstacles to effective participation in forest decision-making in the community.
In total, 114 household members of respondents had migrated for work: 63 women and 51 men migrated abroad or to Phnom Penh or provincial towns. More women had migrated to Thailand and South Korea, 18, more than men, 15. More women had had moved to Phnom Penh, 19, compared with 14 men and 26 women had gone to provincial towns, compared with only 22 men. The level of migration of household members in this study site raises concerns. Because of poverty, rural household members seek whatever jobs they can get with their low education and skills. This reduces the labor force for agriculture in rural communities. MoLVT (Citation2014) recently documented that Cambodian women who have low education migrated to work abroad while educated women migrated to Phnom Penh for employment. In the link to this, MoLVT (Citation2014) asserted that Cambodians migrated to work in Thailand (738,997 in 2014); Malaysia (16,394 in in 2014); and Korea (27, 384 in 2010). In general, Cambodian workers migrated abroad into low-skilled jobs in agriculture, construction, manufacturing, entertainment and hospitality (RGC Citation2011; MoLVT Citation2014).
Income diversity in rural households
Rural households have different livelihood strategies. indicates the annual income that respondents earned from 10 sources in 2015. This was then considered in 3 groups. The analysis demonstrates respondents earned least from ‘selling low quality timber’, 0.04$ (Std.Dev.0.60$), followed by income from ‘hunting wild animal’ activities, 0.18$ (Std.Dev.3.00$). Slightly more was earned from collection of ‘non-timber forest products’, 8.76$ (Std.Dev.31.77$) than from ‘fishing’, 1.05$ (Std.Dev.9.96$). These can all be considered as income from environmental services (Wunder et al. Citation2016, p.32). It is not surprising that these sources contributed very little to total household income, due to the continued forest land clearance in Cambodia. This finding is consistent with Jiao et al. (Citation2015), who reported that ELCs created negative impacts on the annual total income earned from forest resource extraction and, in addition, affected rural households’ cultivable land area. Flower (Citation2018) asserted that Cambodia had the highest land inequality among population in the region, indicated by a Gini coefficient of 0.69. A recent study on natural forest extraction, by Nguyen et al. (Citation2018), found that there was a decrease of natural forest extraction and farm production efficiency in Cambodia.
Table 2. Average annual income from different sources.
The highest proportion of income of respondents was from ‘rice farming’, at 310.88$ (Std.Dev. 560.99$), following by ‘plantation’ income of 261.37$ (Std.Dev. 357.52$) and ‘livestock’ income of 79.90$ (Std.Dev. 232.97$). Respondents received 45.18$ (Std.Dev. 200.24$) ‘self-employment’, more than from ‘employment’ accounted of 37.41$ (Std.Dev.126.99$) and income from ‘other sources’ of 15.77$ (Std.Dev. 158.72$). Considering the 3 types of income, ‘farm income’ 390.79$ (Std.Dev. 697.83$) contributed the most to annual household income, followed by ‘forest income’ 271.40$ (Std.Dev. 354.38$) (see ). Our findings supported Tadesse et al. (Citation2017), who emphasized that income from forest products and services was significant to rural households. These authors claimed that once rural people earned or benefitted more from forests, they might participate in sustainable forestry. The smallest income contribution in the study was from ‘non-farm’ activities, 98.37$ (Std.Dev.274.61$).
Table 3. Gini decomposition of income.
is a whisker plot showing the income differences between men and women in this study. On average, the men in the study earned 440.24$ from ‘farm income’, 24% more than women. Men also earned 295.82$ from forest income, 17% more than women. In addition, men earned 127.59$, 65% more than women, 77.32$, on average from ‘non-farm income’. Overall, men earned 863.65$ annually, 26% more than women.
Figure 3. Lorenz curves of distribution of all income sources.
Men earned between 30$ and 3250$ from ‘farm income’, 5$ to 1600$ from ‘forest income’ and 25$ to 2400$ from ‘non-farm income’. Women earned between 10$ and 9500$ from ‘farm income’, followed by 5$ to 2500$ from ‘forest income’, slightly more than men. However, women earned less from ‘non-farm income’, 1000$ compared with 2400$. The box plot shows the income is right-skewed for both women’s and men’s income earned from ‘farm income’ and ‘forest income’ with many outliers. The highest outlier of women’s income was higher than any income type for men (the highest income for a woman was 9500$ and for a man, only 3250$). This finding seems in line with the claim of Ireson (Citation1991) who author studied the forest work of rural women in Laos and asserted that ‘rural women are often subsistence foresters’, thus could earn more income from forest activities. Further evidence from the current studies on women in agriculture supports four gender ‘myths’ by indicating that: a-women are better stewards of the environment, b-women own 1% of the world’s land, c-women produce 60 to 80% of the world’s food, and d-70% of the world’s poor are women (Doss et al. Citation2018). Also our result is in line with Sunderland et al. (Citation2014) who reported, in ‘Latin America and Asia, women collect a larger share of forest products in the commons than men; about three times as much in the regions’. However, analysis shows that the median men’s ‘farm income’, indicated by the middle line in the box (Kohler and Kreuter Citation2012, p.15). Men’s ‘non-farm income’ shows many outliers and was overall higher than women (men earned 2400$, women earned 1000$).
Decomposition measures of income inequality
reports the Gini decomposition results, illustrating the inequality-increasing and inequality-decreasing nature of the difference income sources (Lerman Citation1985; Adams Citation1994). First, we begin with the income share (Sk). Two variable income sources, ‘hunting wild animals’ and ‘selling low quality timber’, contributed very little, Sk = 0, to total income and the income earned from ‘fishing’, Sk = 0.001, and ‘non-timber forest product’, Sk = 0.012 made only small contributions. ‘Other sources’ contributed slightly more, Sk = 0.021. ‘Employment’, with Sk = 0.049 provided a little less than ‘self-employment’, Sk = 0.059. ‘Rice farming’ contributed the largest share of rural household incomes in the study, This province is home to the Kouy indigenous people, known as the largest ethnic minority group in Cambodia (Nhem et al. Citation2018). Their livelihood relies heavily on forest resource extraction in Kampong Thom province, Sk = 0.409, followed by ‘plantation’, Sk = 0.344 and ‘livestock’, which accounted for Sk = 0.105.
The findings were that forest income inequality was very high, indicated by Gk = 0.6390. This is in line with the finding of Boyce et al. (Citation2016) whose measurement of environmental inequality gave a Gini index of 0.76. The study also found that the income earned from forest resources contributed a much larger share of total income, at 0.3500, than non-farm income in the 14 villages. Looking at each variable of income under the forest income, it can be see that rural households are relatively more dependent on 1-plantation (Gk = 0.6630) and 2-collection of non-timber forest products (Gk = 0.9220) than the other possible sources of forest-related income (fishing, hunting and selling low quality timber). This finding is in line with the results of a global comparative analysis of the environmental income in 24 developing countries by Angelsen et al. (Citation2014), who found that poor households in those 24 countries depend more heavily on the collection of non-timber forest production than other forest products and services.
Secondly, we find the income earned from ‘rice farming’ accounted for Gk = 0.637, the lowest value of Gini index in the study, showing it made the highest contribution to the equality of income of the rural households. Cullis and Koppen (Citation2007); Fonta and Ayuk (Citation2013); Angelsen et al. (Citation2014) and Nhem et al. (Citation2018) indicated that a Gini index value of “0” describes perfect income equality while “1” presents total inequality. It was followed by ‘plantation’ income, Gk = 0.663 and ‘livestock’ income of Gk = 0.843. Income from ‘non-timber forest product’, Gk = 0.922, and ‘employment’ income, Gk = 0.928, were less equal while ‘self-employment’ income, Gk = 0.949 was very unequal. The least contributions to income inequality reduction were the incomes earned from ‘selling low quality timber’, Gk = 0.996, ‘hunting wild animals’ income, Gk = 0.996 and from ‘other sources’, Gk = 0.990.
Thirdly, the study analyzed the Gini correlation with rank of total income (Rk) (Lerman Citation1985; Fonta and Ayuk Citation2013). The income earned from ‘rice farming’ had the highest Gini correlation with rank of the total income (Rk = 0.800) and this was very high compared with the other variable incomes, such as ‘other sources’, Rk = 0.764 and the income earned from ‘plantation’, Rk = 0.696.
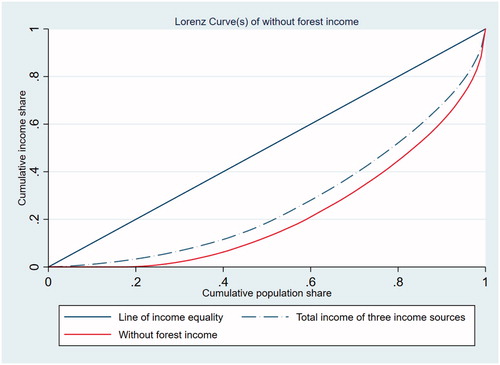
The Gini index would have increased by 10.3% without forest income, from Gk = 0.4540 to Gk = 0.5570, as shown in . This means that forest income was reducing income inequality in the rural households in the study. This contrasted with the findings of Rayamajhi et al. (Citation2012) who concluded that the income earned from forest resources did not seem to provide a pathway out of poverty. In addition, these author claimed that the income earned from non-farm activity could be the key for poverty reduction. In the households in our study, non-farm income was less than farm income or forest income. In a recent study on income earned from the extraction of forest products, Miah et al. (Citation2014) reported that forest income helped to reduce the poverty of around 20% of the population in Ethiopia, reducing income inequality by 15.5%.
Figure 4. Lorenz curves showing annual total income with and without forest income.
Distribution of source of income by category
The Lorenz curves of 3 categories of income source in the 14 villages as the study sites are shown in . The primary income category, ‘farm income’, had Gk = 0.600 and the largest of total income (Sk = 0.514), and, in addition, its Gini correlation with total income ranking was the highest (Rk = 0.795). Its share in total income inequality (0.540) was also higher than that of forest income and or non-farm income. The second-highest Gini value of income source was for ‘forest income’, Gk = 0.639 while the non-farm income gave Gk = 0.878. The share of total income inequality from forest income was 0.350, and from non-farm income was 0.110 as indicated in column 5 of .
Figure 5. Distribution of income source by group.
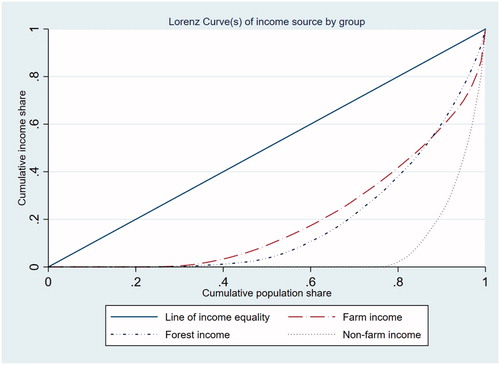
The Gini coefficient of the three categories of source of income was measured at Sk = 0.514; Sk = 0.3570 and Sk = 0.1290 indicated a very high of share in total income to the rural households in the study site. This study’s finding of Sk = 0.3570 (35%) for forest income was similar to the forest income share in different countries, for example, Rayamajhi et al. (Citation2012) reported 23–35% in Ethiopia, 40% in Zimbabwe, 41% in Malawi, and 45% in Bolivia. The findings indicate the high dependence of the rural households on forest resources. It does not mean that the local people are a key driver to deforestation. It can be helpful to focus at the same time on sustainable forest management and efforts to promote rural household livelihoods and poverty reduction, according to Nasar et al. (Citation2016), who suggested that ‘co-management program practice should be effectively carried out as strong pro-poor strategy if the livelihoods of the rural poor are not compromised’.
Forest income, income inequality and poverty by village
presents the Gini coefficient of income inequality in the 14 study villages. In Sala popel the villagers, extraordinarily, had perfect income equality from ‘farm income’ (Gini index = 0.000) and in Sreh ksach, there was still high equality of farm income, Gini index = 0.100. Four villages: Sompor thom (Gini index = 0.160), Sreveal Khangkert (Gini index = 0.160), Choam beong (Gini index = 0.170) and Kor Kul (Gini index = 0.180), had similar Gini values indicating the households have a similar income from farming. Households with the highest farm income inequality lived in Chrang krohorm (Gini index = 0.680), Ni pech kor (Gini index = 0.540), Preytub (Gini index = 0.530) and Choam thnanh (Gini index = 0.480).
Table 4. Decomposition of income inequality by village.
Analysis shows that the households of Sreh Ksach had the most forest income equality, with Gini index = 0.150 followed by Beng (Gini index = 0.200) and Tom or (Gini index = 0.210). The highest value of Gini index = 0.600 showing the most forest income inequality was for households in Tropaing arak, followed by Choam thnanh village, Gini index = 0.530, and Sompor thom village, Gini index = 0.510. This shows that a failure of account for both the level and distribution of income earned from forest activities will make it difficult for policy makers to assess the challenges faced by rural households when designing policy to sustainably protect forests and promote sustainable livelihood strategies (Angelsen et al. Citation2014).
Households in Sala popel reported no non-farm income, thus no Gini index was calculated. For three villages, Choam beong (Gini index = 0.000), Sreh ksach (Gini index = 0.000), Tom or (Gini index = 0.000), incomes from non-farm activities were perfectly equal. Four other villages had high income equality of non-farm income, namely Chhuk romduol (Gini index = 0.210), Chrang krohorn (Gini index = 0.250), Ni pech kor (Gini index = 0.250) and Kor kul (Gini index = 0.270). Two villages had the same, high value of Gini index = 0.580, Sala popel and Tropaing arak.
Sreh ksach had the highest total income equality, with Gini index = 0.090. Tom or (Gini index = 0.150) was the village with the second most equal total income per household. Households with the highest income inequality, compared with other villages in the study site, were in Chrang krohorm village (Gini index = 0.630), followed by Prey tub (Gini index = 0.510).
The findings revealed a significant forest income contribution to total household income (Sk) in the 14 villages. This supports Rayamajhi et al. (Citation2012) by indicating that policy makers should look beyond agriculture for rural development, as income from forest resources is meaningful at subsistence level and may contribute both to prevent and reduce poverty and inequality in rural communities. Similarly, Angelsen et al. (Citation2014) claimed that if policy makers failed to quantify forest or environmental income in the national socio-economic surveys, it would be equivalent to ignoring the fact that rural people grow crops.
Conclusion
This study analyzed the distribution of forest income and other sources of income and their contribution to the reduction of rural income inequality in 14 villages in Kampong Thom province, Cambodia. Firstly, the study found that there was a low educational attainment among the household members and significant migration. The respondents indicated that it was the young who are seeking job opportunities in the city or neighboring countries, perhaps leading to a lack of labor for agriculture. The study found a lack of gender equity in women’s participation in decision-making, such as taking positions as Head of Community Forestry sites. Perhaps, policy makers for rural participatory forestry management programs and practice should look beyond capacity and knowledge and consider quotas for men and women to be included in decision-making or given the head position for Community Forestry across Cambodia.
Second, the analysis revealed that farm income remained the major source of rural household livelihoods, indicated by its share of household income (Sk = 0.5140). It was the most equal source of income, even though not that equal at Gk = 0.6000. Third, forest income was found to be an important part of poor rural households’ livelihoods strategies and an important source for the reduction of income inequality and poverty, revealed by its Lorenz curve and Gini decomposition. Its Gini correlation with total income rankings was very high, Rk = 0. 6960 and its share of rural household total income was 35% (Sk = 0.3570). The analysis revealed that if the income earned from forest activities was removed, for instance if people could not access forest resources due to deforestation or clearing of forest lands for agriculture, rural income inequality would be increased. One possible solution could be to require this issue to be addressed in a separate section in policies. Policy makers should look beyond agriculture when considering rural development, as income earned from forest resources is significant and can contribute to both preventing and reducing poverty and inequality in rural communities.
Fourth, our finding was that non-farm activities are inequality-increasing sources of income. We disagree with Adams (Citation1994) who reported that non-farm income was an inequality-decreasing income source. Our result was indicated by the share of non-farm income in rural household total income, Sk = 0.1290 and its Gini was very high (Gk = 0.8780) compared with forest and farm income. Looking at one of the variables of non-farm activities, the study revealed that employment by external institutions was the most equal of these sources, indicated by the value of Gk = 0.9280, lower than income from self-employment Gk = 0.9490 and other sources of income Gk = 0.9900.
Acknowledgements
The authors would like to thank ASEAN – ROCK Forest Cooperation (AFoCo) for providing a full PhD scholarship to our first author.
Disclosure statement
The authors declare no potential conflicts of interest with respect to publication of this article.
Additional information
Funding
References
- Adams RH. 1994. Non-farm income and inequality in rural Pakistan: a decomposition analysis. J Dev Stud. 31(1):110–133.
- ADB. 2015. Promoting women’s economic empowerment in Cambodia. Manila, Philippines: Asian Development Bank (ADB).
- Agarwal, B. 2009. Rule making in community forestry institutions: the difference women make. Ecol Econ. 68(8–9):2296–2308.
- Ali A, Rahut DB. 2018. Forest-based livelihoods, income, and poverty: empirical evidence from the Himalayan region of rural Pakistan. J Rural Stud. 57:44–54.
- Allison PD. 1978. Measures of inequality. Am Sociol Rev. 43(6):865–880.
- Angelsen A, Jagger P, Babigumira R, Belcher B, Hogarth NJ, Bauch S, Börner J, Smith-Hall C, Wunder S. 2014. Environmental income and rural livelihoods: a global-comparative analysis. World Dev. 64(S1):S12–S28.
- Arnold JEM. 1991. Community forestry: ten years in review. Rome, Italy: Food and Agriculture Organization of the United Nations (FAO).
- Babulo B, Muys B, Nega F, Tollens E, Nyssen J, Deckers J, Mathijs E. 2009. The economic contribution of forest resource use to rural livelihoods in Tigray, Northern Ethiopia. Forest Policy Econ. 11(2):123–131.
- Bakkegaard RK, Agrawal A, Animon I, Hogarth N, Miller D, Persha L, Rametsteiner E, Wunder S and Zezza A. 2016. National socioeconomic surveys in forestry: Guidance and survey modules for measuring the multiple roles of forests in households welfare and livelihoods. Rome, Italy: Food and Agriculture Organization of the United Nations (FAO).
- Bellú LG, Liberati P. 2006. Theil index and entropy class indexes describing income inequality theil index and entropy class indexes. Food and Agriculture Organization of the United Nations (FAO): 20. Rome, Italy. Retrieved from http://www.fao.org/docs/up/easypol/445/theil_index_051en.pdf.
- Boyce JK, Zwickl K, Ash M. 2016. Measuring environmental inequality. Ecol Econ. 124:114–123.
- Bredin YK, Lindhjem H, van Dijk J, Linnell JDC. 2015. Mapping value plurality towards ecosystem services in the case of Norwegian wildlife management: a Q analysis. Ecol Econ. 118:198–206.
- Bretschger L, Meulemann M, Stünzi A. 2018. Climate Policy Based on the Paris Agreement. Reference Module in Earth Systems and Environmental Sciences. Elsevier Inc.
- Bukoski JJ, Drazen E, Johnson WR, Swamy L. 2018. Tropical forests for sustainable development: shaping the 2030 agenda for sustainable development with knowledge from the field. J Sustainable Forestry. 37(2):77–81.
- Camacho LD, Camacho SC. 2006. Economic implications of reforestation as a forest restoration strategy under the community-based forest management program in Quirino province, Philippines. Forest Sci Technol. 2(1):27–35.
- Ceriani L, Verme P. 2012. The origins of the Gini index: extracts from Variabilità e Mutabilità (1912) by Corrado Gini. J Econ Inequality. 10(3):421–443.
- Cullis J, Koppen Bv. 2007. Applying the Gini coefficient to measure inequality of water use in the Olifants river water management area, South Africa. Colombo, Sri Lanka: International Water Management Institute.
- Dai C, Qin XS, Chen Y, Guo HC. 2018. Dealing with equality and benefit for water allocation in a lake watershed: a Gini-coefficient based stochastic optimization approach. J Hydrol. 561(September 2017):322–334.
- Devkota RR. 2010. Interests and power as drivers of community forestry: a case study of Nepal. Göttingen, Germany: Universitätsverlag Göttingen.
- Doss C, Meinzen-Dick R, Quisumbing A, Theis S. 2018. Women in agriculture: four myths. Global Food Security. 16:69–74.
- Ehara M, Hyakumura K, Nomura H, Matsuura T, Sokh H, Leng C. 2016. Identifying characteristics of households affected by deforestation in their fuelwood and non-timber forest product collections: Case study in Kampong Thom Province, Cambodia. Land Use Policy. 52:92–102.
- Evans K, Flores S, Larson AM, Marchena R, Müller P, Pikitle A. 2017. Challenges for women’s participation in communal forests: experience from Nicaragua’s in digenous territories. Women’s Stud Int Forum. 65:37–46.
- FA. 2015. Community forestry statistics in Cambodia 2015. Phnom Penh, Cambodia: Forestry Administration (FA).
- FAO. 2016. State of the World's forests in brief: forests and agriculture: land-use challenges and opportunities. Rome, Italy: Food and Agriculture Organization of the United Nations (FAO).
- FAO. 2018. The state of the World´s forests - forest pathways to sustainable development. Rome, Italy: Food and Agriculture Organization of the United Nations (FAO).
- Favero G. 2017. A reciprocal legitimation: Corrado Gini and statistics in fascist Italy A reciprocal legitimation: Corrado Gini and statistics in fascist Italy. Manage Organizational History. 9359:1–24.
- Flower BCR. 2018. Does informal tenure result in land inequality? A critique of tenure formalisation reforms in Cambodia. Land Use Policy. 77(April):240–248.
- Fonta WM, Ayuk ET. 2013. Measuring the role of forest income in mitigating poverty and inequality: Evidence from South-Eastern Nigeria. Forests Trees and Livelihoods. 22(2):86–105.
- Gatiso TT, Wossen T. 2015. Forest dependence and income inequality in rural Ethiopia: evidence from Chilimo-Gaji community forest users. Int J Sustainable Dev World Ecol. 22(1):14–24.
- Haughton J, Khandker SR. 2009. Handbook on poverty + inequality. Washington, D.C.: United States: The World Bank.
- Ireson C. 1991. Women’s forest work in Laos. Soc Nat Res. 4(1):23–36.
- Jagger P. 2012. Environmental income, rural livelihoods, and income inequality in Western Uganda. Forests Trees and Livelihoods. 21(2):70–84.
- Jagger P, Luckert MMK, Duchelle AE, Lund JF, Sunderlin WD. 2014. Tenure and forest income: observations from a global study on forests and poverty. World Dev. 64(S1):S43–S55.
- Jiao X, Smith-Hall C, Theilade I. 2015. Rural household incomes and land grabbing in Cambodia. Land Use Policy. 48:317–328.
- Kakwani NC. 1980. Income inequality and poverty. Washington, DC: Oxford University Press.
- Keenan RJ, Reams GA, Achard F, de Freitas JV, Grainger A, Lindquist E. 2015. Dynamics of global forest area: results from the FAO Global Forest Resources Assessment 2015. Forest Ecol Manage. 352(2015):9–20.
- Khundi F, Jagger P, Shively G, Sserunkuuma D. 2011. Income, poverty and charcoal production in Uganda. Forest Pol Econ. 13(3):199–205.
- Kim SB, Alounsavath O. 2015. Forest policy measures influence on the increase of forest cover in northern Laos. Forest Sci Technol. 11(3):166–171.
- Kohler U, Kreuter F. 2012. Data analysis using Stata. 3rd ed. Texas, United States of America: StataCorp LP.
- Krott M. 2005. Forest policy analysis. Göttingen, Germany: Springer Netherlands.
- Lerman R. 1985. Income inequality effects by income source: a new approach and applications to the United States. Rev Econ Stat. 67(1):151–156.
- Liao TF. 2016. Evaluating distributional differences in income inequality. Socius: Sociological Res Dynamic World. 2(2):1–14.
- MacDicken KG, Sola P, Hall JE, Sabogal C, Tadoum M, de Wasseige C. 2015. Global progress toward sustainable forest management. Forest Ecol Manage. 352:47–56.
- MAFF. 2010. National Forest Programme 2010-2029. Phnom Penh, Cambodia: Ministry of Agriculture, Forestry and Fisheries (MAFF).
- Makoudjou A, Levang P, Chupezi Tieguhong J. 2017. The role of forest resources in income inequality in Cameroon. Forests Trees and Livelihoods. 8028(March):1–15.
- Manandhar TD, Shin MY. 2013. How community-based forest management can improve rural livelihoods: a case of Kabhre district, Nepal. Forest Sci Technol. 9(3):131–136.
- Martins NO. 2015. Inequality, sustainability and Piketty ’ s capital. Ecol Econ. 118:287–291.
- Miah MD, Akther S, Shin MY, Koike M. 2014. Scaling up REDD + strategies in Bangladesh: a forest dependence study in the Chittagong Hill Tracts. Forest Sci Technol. 10(3):148–156.
- MoE. 2018. Cambodia forest cover 2016. Phnom Penh, Cambodia: The Ministry of Environment (MoE).
- MoLVT. 2014. Policy on labour migration for Cambodia. Phnom Penh, Cambodia: Ministry of Labour and Vocational Training (MoLVT).
- MoP. 2013. Cambodia Inter-Censal Population Survey 2013: Final Report. Phnom Penh, Cambodia: Ministry of Planning (MoP).
- MoWA. 2014. Neary rattanak IV: five year strategic plan for gender equality and women’s employment. Phnom Penh, Cambodia: Ministry of Women’s Affairs (MoWA).
- Nasar A, Abdullah M, Stacey N, Garnett ST, Myers B. 2016. Forest Policy and Economics Economic dependence on mangrove forest resources for livelihoods in the Sundarbans, Bangladesh. Forest Pol Econ. 64:15–24.
- Nguyen TT, Do TL, Parvathi P, Wossink A, Grote U. 2018. Farm production efficiency and natural forest extraction: evidence from Cambodia. Land Use Policy. 71(November):480–493.
- Nguyen TV, Tran TQ. 2018. Forestland and rural household livelihoods in the North Central Provinces, Vietnam. Land Use Policy. 79(March):10–19.
- Nhem S, Lee YJ, Phin S. 2017. Sustainable management of forest in view of media attention to REDD + policy, opportunity and impact in Cambodia. Forest Pol Econ. 85(August):10–21.
- Nhem S, Lee YJ, Phin S. 2018. The impact of forest resource decline: analyzing forest-related income supplements to reduce income inequality and poverty of the Kouy indigenous people living in Kampong Thom province, Cambodia. J Sustainable Forestry. 37(2):97–119.
- Nieto J, Carpintero Ó, Miguel LJ. 2018. Less than 2 °C? An economic-environmental evaluation of the Paris agreement. Ecol Econ. 146(July 2017):69–84.
- Nilsson M, Persson Å. 2017. Policy note: lessons from environmental policy integration for the implementation of the 2030 Agenda. Environ Sci Pol. 78(July):36–39.
- Pandit R. 2018. Forest Policy and Economics REDD + adoption and factors affecting respondents’ knowledge of REDD + goal: evidence from household survey of forest users from REDD + piloting sites in Nepal. Forest Pol Econ. (February 2017):1–9. https://doi.org/10.1016/j.forpol.2018.02.002.
- Park MS, Choi ES, Youn Y-C. 2013. REDD + as an international cooperation strategy under the global climate change regime. Forest Sci Technol. 9(4):213–224.
- Rahut DB, Behera B, Ali A. 2016. Do forest resources help increase rural household income and alleviate rural poverty? Empirical evidence from Bhutan. Forests Trees and Livelihoods. 25(3):187–198.
- Rayamajhi S, Smith-hall C, Helles F. 2012. Forest policy and economics empirical evidence of the economic importance of Central Himalayan forests to rural households. Forest Pol Econ. 20:25–35.
- RECOFTC. 2013. Community forestry in Asia and the Pacific: pathway to inclusive development. Bangkok, Thailand: The Center for People and Forests (RECOFTC).
- RGC. 2011. Achieving Cambodia’s Millenium Development Goals: Update 2011. Phnom Penh, Cambodia: Royal Government of Cambodia (RGC).
- RGC. 2014. National Strategic Development Plan 2014-2018. Phnom Penh, Cambodia: Royal Government of Cambodia (RGC).
- Rougoor W, Marrewijk C. 2015. Demography, growth, and global income inequality. World Dev. 74:220–222.
- Sadath MN, Rahman S. 2014. Forest in crisis: 2 decades of media discourse analysis of Bangladesh print media. Forest Pol Econ. 68:16–21.
- Sasaki N, Chheng K, Mizoue N, Abe I, Lowe AJ. 2016. Forest reference emission level and carbon sequestration in Cambodia. Global Ecol Conserv. 7:82–96.
- Schmitt CB, Burgess ND, Coad L, Belokurov A, Besançon C, Boisrobert L, Campbell A, Fish L, Gliddon D, Humphries K, et al. 2009. Global analysis of the protection status of the world's forests. Biol Conserv. 142(10):2122–2130.
- Silveira Neto RDM, Azzoni CR. 2011. Non-spatial government policies and regional income inequality in Brazil. Reg Stud. 45(4):453–461.
- Sunderland T, Achdiawan R, Angelsen A, Babigumira R, Ickowitz A, Paumgarten F, … Shively G. 2014. Challenging perceptions about men, women, and forest product use: a global comparative study. World Dev. 64(S1):S56–S66.
- Swamy L, Drazen E, Johnson WR, Bukoski JJ. 2018. The future of tropical forests under the United Nations Sustainable Development Goals. J Sustainable Forestry. 37(2):221–256.
- Tacconi L. 2007. Decentralization, forests and livelihoods: theory and narrative. Global Environ Change. 17(3–4):338–348.
- Tadesse S, Woldetsadik M, Senbeta F. 2017. Forest users’ level of participation in a participatory forest management program in southwestern Ethiopia. Forest Sci Technol. 13(4):164–173.
- The World Bank. 2016. Poverty and shared prosperity 2016: taking on inequality. Washington, D.C., United States: The World Bank. Retrieved from http://elibrary.worldbank.org/doi/book/10.1596/978-1-4648-0958-3.
- Uberhuaga P, Smith-Hall C, Helles F. 2012. Forest income and dependency in lowland Bolivia. Environ Dev Sustainability. 14(1):3–23.
- UN. 1987. Report of the World Commission on Environment and Development: Our Common. New York, United States: United Nations (UN). Retrieved from http://www.un-documents.net/our-common-future.pdf.
- UN. 1992. United Nations Framework Convention on Climate Change. New York, United States: United Nations (UN). Retrieved from https://unfccc.int/resource/docs/convkp/conveng.pdf.
- UN. 2015a. Adoption of the Paris Agreement. Paris, France: United Nations (UN). Retrieved from http://unfccc.int/resource/docs/2015/cop21/eng/l09r01.pdf.
- UN. 2015b. The Millennium Development Goals Report 2015. New York, United States: United Nations (UN). https://doi.org/978-92-1-101320-7.
- UN. 2015c. Transforming our world: the 2030 agenda for sustainable development. New York, United States: United Nations (UN). Retrieved from https://sustainabledevelopment.un.org/post2015/transformingourworld/publication.
- Wang XJ, Zhang JY, Shahid S, ElMahdi A, He RM, Wang XG, Ali M. 2012. Gini coefficient to assess equity in domestic water supply in the Yellow River. Mitigation and Adaptation Strategies for Global Change. 17(1):65–75.
- Wells R. 2006. Education’s effect on income inequality: an economic globalisation perspective. Globalisation, Soc Edu. 4(3):371–391.
- Worku A, Pretzsch J, Kassa H, Auch E. 2014. Forest Policy and Economics The signi fi cance of dry forest income for livelihood resilience: The case of the pastoralists and agro-pastoralists in the drylands of southeastern Ethiopia, 41, 51–59.
- WSP-EAP, WSP, ADB, AusAid, UKAid, World Commission on Environment and Development, … ADB. 2014. Country poverty analysis 2014: Cambodia. Asian Development Bank. Mandaluyong: Asian Development Bank. Retrieved from https://www.adb.org/documents/cambodia-country-poverty-analysis-2014.