
 ?Mathematical formulae have been encoded as MathML and are displayed in this HTML version using MathJax in order to improve their display. Uncheck the box to turn MathJax off. This feature requires Javascript. Click on a formula to zoom.
Abstract
The improvement in forest productivity by considering the balance of nutrient input-output is the proper choice. This research aimed at investigating the macro nutrient status of a teak plantation in Indonesia. The quantitative measurement of the nutritional status of a plantation was done by picking sample plantations and doing laboratory analysis. The determination of macronutrition status was conducted by means of Diagnosis and Recommendation Integrated System (DRIS), that is a diagnostic method to measure the balance of nutrients before designing silvicultural treatments. Index analysis on teak has resulted in a macronutrient index (N, P, K, Ca, and Mg); respectively –8.40, –1.70, –4.17, 4.98 and 9.28. The availability levels of nutrients from the highest to the lowest were Mg > Ca > P > K > N. Mg and Ca have shown positive index values; this implies that the nutrients are sufficient. N, K, and P have shown negative index values; this implies that the nutrients are less available, and thus growth-limiting nutrients for teak. It is recommended that silvicultural treatments be conducted on teak by means of balanced nutrient inputs, to be specific N, P, and K to achieve maximum growth of teak.
Introduction
Teak forest management is influenced by several factors including growth and productivity of stands. Teak growth and productivity are the results of physiological processes, which involve the interaction of genetic factors with environmental factors (Gardner et al. 1991). In order to achieve the productivity of teak stands, efforts are made to genetic and environmental improvement in a growth area that is as optimal as possible through intensive silviculture activities. The growth characteristic apparent as the main phenotypic is influenced by genotype factor; while other characteristics are determined by environmental influences. Hence, growth is the function of genotype and environment. The effort to maximize the growth and productivity can be pursued by genetic modification and environment manipulation.
Superior teak cultivation has been conducted through genetic improvement in order to produce a premium clone of teak in Indonesia, called Jati Plus Perhutani (JPP). The superiority of JPP is characterized by the level of productivity which is better compared to that of conventional teak. Based on the test on teak aged 5 years treated with intensive silviculture in KPH Pemalang Indonesia, the result has shown that increase diameter growth is 4 cm yr−1, height growth of 4 m yr−1, and volume growth of 14 m3 ha−1 yr−1 (Anonymous Citation2009). The application of manure fertilization with the dosage of 5 kg/plant results in height growth of ±1.56 m and stem’s growth diameter of 5.44 cm in a teak tree aged 1 year in a Wanagama Teaching Forest (Hardiwinoto et al. Citation2013). The genetic characteristics of a premium teak clone without a conducive environment will not appear well in the field. Naturally, the decrease of productivity of forest can be seen from the decrease of nutrients in the forest soil. This is caused by the nutrients being saved by biomass (vegetation) above the soil as a result of nutrient’s closed cycle system. When biomass is taken by means of harvesting, the majority of nutrients are also taken out. The cultivation of teak forest so far is done through silviculture’s clear cutting with low nutrient inputs. In the long term, the productivity of the land will continuously decrease as the soil is getting barren. This happens because nutrients are continuously taken out from the land in big mass through harvesting, cleaning, and erosion. Meanwhile, the amount of nutrient inputs back to the soil only come from litterfall and input after harvesting is low compared to the output. This causes a nutrient deficit. Until now there has been no information on the results of research at the trial site about the content of macronutrients (N, P, K, Ca and Mg). The growth of teak relies on the habitat condition and is related to the varieties of mineral nutrients as the parameter of fertility and humidity of the soil. Location factor, such as parent ingredients, tilt angle, gradient, slope aspect, drainage, soil water, and erosion as well as the physiochemical characteristics of the soil bring significant effect to teak growth. The research result of Watanabe et al. (Citation2010) shows that the location and soil pH factors are not related to the location index. The volumetric level of water and the capacity in holding maximum water, carbon, nitrogen, Ca, and Mg level shows significantly positive correlation to the location index. The humidity of soil is an important factor for the growth of teak; while the organic elements of soil contribute in elevating water retaining capacity and water volume in the soil. Nitrogen and Ca are exchanged and Mg is a pivotal factor in the growth of teak (Watanabe et al. Citation2010). The research result of Abod and Siddiqui (Citation1995) shows that the height and diameter growth of teak seeds which are newly planted are significantly affected by the N and P. Fertilization shows significantly positive response against the weight of leaf, root, and the amount of dry products’ production during harvest in one year after planting. This research also concludes that the application of 300 kg/hectare of triple superphosphate and 200 kg/hectare of ammonium sulfate is necessary in order to increase the height, diameter, and total weight growth of newly planted teaks.
Siddiqui et al. (Citation2009) suggest that the concentration of N, P, and K in teak leaf decreased as the age of the tree rose; while the concentration of Ca increased. In teak tree aged 1 and 2 years, the concentration of Nitrogen in the leaf was at 1.9% and decreased to 1.6% at the age of 10 years and 1.4% for older trees at the age of 18 years. Phosphor and K followed the similar trend as that of N. Meanwhile, Ca and Mg increased as the age of the tree increased. The importance of nutrient balance in determining the result and the quality of teak stands has been advocated but there is currently no method to quantify it until Diagnosis and Recommendation Integrated System (DRIS) is introduced. DRIS identifies simultaneous imbalance, deficiency, and excess of nutrients and ranks them based on the level of urgency (Bangroo et al. Citation2010). Analysis of soil testing is a common measure in determining the level of nutrients in the field (Mirasol Citation2016). Planning of teak forest for the long run requires a mathematical model and theoretical principles of dynamic system which gives a firm foundation in evaluating the growth of teak (Tewari et al. Citation2014).
So far, the application of analysis method of nutrient balance using DRIS has been developed in several cultivation centers; however, in the field of forestry, especially teak forest, this method is still on the limited application. Considering the proofs of increasing advantages in using DRIS in various types of plants, there is a need to apply this method in the teak stand in order to diagnose the balance of nutrients in the field. It is necessary to do so due to the needs of complete testing of nutrient balance in the field of forestry on a big scale (Schutz and Villiers Citation1987). The growth of superior teak is strongly supported by the nutritional intake provided on the forest floor of the N, P, K, Ca and Mg nutrients (Siddiqui et al. Citation2009). in order to find out the availability of nutrients in teak stands, analysis of nutrient balance is needed. This current research aimed at investigating macronutrients on premium genetic quality teak stands aged 17 years. It is necessary to conduct a research on silviculture application of premium clone teak stands by diagnosing the balance of nutrients status in the field for achieving proper growth of teak and productivity of the field.
Materials and method
Sampling for nutrient analysis of teak
This experiment was conducted on teak plantation aged 17 years in the block 64f BKPH Kedunggalar, KPH Ngawi East Java Indonesia (7°23′ S, 111°18′ E). The methods recommended for foliage analysis outlined in detail in Morrison (Citation1974), Ballard (Citation1985), and Ballard and Carter (Citation1986). Samples of the foliage collected from open-grown foliage located in the upper half or third of the live crown (Ballard and Carter Citation1986).
The determination of plant sampling unit was conducted by collecting a specimen of the plant by using Stratified Random Sampling method and continued with a analysis in the laboratory. There were two sampling units, namely the individual teaks representing each population of good growth and poor growth from the experiment plot. The population of trees with good and poor growth is determined based on the criteria for height and diameter of the tree. Good tree growth has a tree height range of 15–17 m and a tree diameter of 16–18 cm. Poor growth has a tree height range of 12–14 m and a tree diameter of 12–14 m. Each growth block was made into 5 plots and from each plot a specimen of leaf was taken randomly from three trees representing good and poor growth, resulting in 15 samples from each group. The sampling of specimens from the field was in the form of mature teak’s leaves which open perfectly in the morning, which they were placed in a cool box to maintain the freshness of the samples. The samples were then taken to the laboratory for further analysis. The analysis of plant tissues was conducted in the laboratory of Soil Research Center in Bogor. The macronutrients analyzed were Nitrogen (N) using a Kjeldahl method. For the total Phosphor (P), Kalium (K), Calcium (Ca), and Magnesium (Mg), the analysis was using Spectrophotometer.
Data analysis
In order to find out the nutrient level in the plot of premium genetic teak stands, an analysis using Diagnosis and Recommendation Integrated System (DRIS) method was applied in accordance with the instruction from Walworth and Sumner (Citation1987) about the norms of DRIS development and suitable nutrient index equivalence. Nutrient concentration is expressed against a certain dry ingredient.
The selection of DRIS norm was initiated with classifying nutrient concentration into several ratios (N/P, P/N, N/Ca and so on). Each pairing of nutrients must consider N/P or P/N in order to acquire DRIS value derivation and rely on whichever ratio presenting the highest ratio variants of both good and poor populations. The nutrient ratio chosen was then used to calculate the DRIS index. The mean, angle, variants, and ratio coefficient of nutrient variations in both populations were then calculated. The nutrient ratio which was considered as the DRIS norm is that one with angle value less than 1 in the good population and variant ratio of ≥1. DRIS was calculated for each nutrient by using the formula (Walworth and Sumner Citation1987) for A to N nutrient as follows:
(1)
(1)
(2)
(2)
(3)
(3)
(4)
(4)
(5)
(5)
Where:
is the ratio of nutrient from plant’s tissue to be analyzed
is the ratio of nutrient reference (DRIS norm) of two nutrients from the population
CV is the coefficient of variant in the population.
Z is functions in each nutrient index composition.
Other function values such as f (A/C) and f (A/D) were calculated by using the same norms and related CV. The index value for each nutrient was the integrated availability measurement compared to the other nutrients. The more negative the index value of a nutrient, the more limiting that particular nutrient. Data analyses in the forms of minimum value, mean, maximum value, skewness, standard deviation, and variant coefficient were all done by Minitab version 17 software.
Result and discussion
Diagnosis and Recommendation Integrated System (DRIS norms)
Macronutrient analysis (N, P, K, Ca, Mg) in teak leaves good and bad growth categories are presented in . The descriptive statistics of macronutrients and nutrient concentration of teak’s leaf tissues are presented in . The data for the subpopulation of good growth was relatively less skewed with most nutrients having skewness value of less than 1. This is an indication that most of the data are normally distributed and thus it is suitable for the derivation of DRIS norm. This is because the symmetrical data have given a realistic approximation of the possibility of interactive effect variations of different nutrients in the productivity of teak stands.
Table 1. Analysis of macronutrients (N, P, K, Ca, Mg) on teak leaves of good and poor growth categories.
Table 2. Descriptive statistics of macronutrients in the growth of teak stands from good and poor categories.
The selected nutrient ratios are presented in alongside with their variants. Twenty nutrient ratios were selected by considering pairings which possess the highest ratio variants from poor growth subpopulation. Ten nutrient ratios were further selected as those presenting the highest ratio variants amongst poor and good growth populations (S1/Sh) and became the norms of DRIS. Nutrient ratios which were selected were then used to calculate the DRIS index. The choice of nutrient ratio which presents maximum ratio variants amongst good and poor growth populations was for maximizing the potential in differentiating teak stands with good growth from those with inadequate growth. The variant of ratio has indicated the importance of certain level of nutrient ratio against the parameter of results with a very high ratio, showing that the nutrient is very important for the stands.
Table 3. Mean, coefficient of variation (CV), variance (S) of nutrients, variance ratio and selected ratio of DRIS norms of teak.
The diagnosis of macro nutrient status
In order to calculate the nutrient index of teak, the ratio value of nutrients in each selected ratio must first be calculated (). Subsequently, the selected value of nutrient ratio function is calculated in accordance with the DRIS norm shown in . The macronutrient index is calculated by using a suitable function equation () and the nutrient index values of N, P, K, Ca, and Mg are presented in .
Figure 1. Index value of macro nutrients in teak.
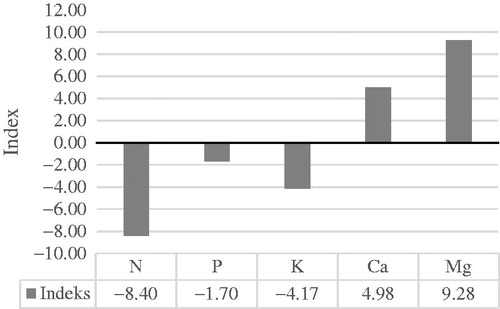
Table 4. Nutrient ratio value based on DRIS norm.
Table 5. Selected nutrient ratio function based on DRIS norm.
Table 6. Function equation of macronutrient index.
The research findings have shown that the index value of macronutrient contains positive and negative indexes and is found in all dataset. The total value of the nutrient index is zero (0). This shows that the implementation of DRIS method in this research is proper and suitable. The research result of Bailey et al. (Citation1997) explains that DRIS is proven to be reliable in diagnosing deficiency of N, P, K, and S, which possesses reliability level of 90–100%. Some other researches have postulated that DRIS norm based on the composition of leaf has been developed for certain types of plants; therefore, generally it can be applied to different plants in different locations and in different growth stages (Bangroo et al. Citation2010; Stevenson and Kimberley Citation1988).
The mean index value for this subpopulation is presented in Picture 1, which shows that index values for nutrient N, P, and K are all negative. The most limiting macronutrients are N (index value of –8.4), followed by K (index value of –4.17), and P (index value of –1.7). For Ca and Mg nutrients, the availability of these nutrients is abundant, with Mg as the most abundant nutrient (index value of 9.28), followed by Ca (index value of 4.98). This implies that a low level of nutrients is caused by the lacking of macronutrients. This is in line with the result of research by Siddiqui et al. (Citation2009), which mentions that the concentration of N, P, and K is decreasing as the trees grow older, while the concentration of Ca increases as the age of the tree counts. The concentration of nutrients declines as the age and the size of the teak tree increase (Tahir et al. Citation2007). The concentration of K, Mg, and N can be related to the decrease of teak productivity because the tree gets older (Fernandez-Moya et al. Citation2013). The need of nutrients for teak stand’s productivity is fulfilled by the organic elements decomposing functioning as nutrients for teak stands. The growth of teak is influenced by the main nutrients, such as N, P, and K. N and K give significant effect to the tree’s height, leaf weight, bud weight, and root length. N nutrient most importantly gives a significant effect to the growth of stem diameter (Abod and Siddiqui Citation1998). The ability of teak in repairing the ecosystem is closely related to the amount of organic elements, rooting system, as well as the soil closing level (Schroth and Sinclair Citation2003).
The low level of macronutrients especially N, P, and K shows that the supply of organic elements through natural littering does not suffice to meet the nutrient needs of the teak stands in the location. N and P are the delimiters of the important process in an ecosystem (Lawrence and Foster Citation2002; Oldroyd and Dixon Citation2014). Generally, a nutrient which is lacking in teak stands other than N is P (Drechsel and Zech Citation1994). A proper amount of N nutrient is lost from the system as wood and firewood (Gama-Rodrigues Citation2011). Organic input causes different problems for the cultivation of nutrients compared to synthetic fertilizer because most of the nutrients have to experience mineralization before they are available for the plants (Hendrix et al. Citation1992; Chen et al. Citation2014). The use of Nitrogen with a mass balance approach is needed as an option for improving the nitrogen regulation in the ecosystem (Follett Citation2008). The optimum condition of the soil in teak growth involves proper drainage, inner layer of soil, lower level of acid to bases pH and bases abundance, especially Ca (Tanaka et al. Citation1998).
Forest productivity is limited by the deficiency of Nitrogen, even though the fact is that soil might contain a higher level of Nitrogen. Nitrogen deficiency is claimed as the lack of the main nutrient which curbs the growth of plants, and it can also regulate the succession pattern of forest ecosystem (Harrison and Xu Citation1986; Kirchmann et al. Citation2007). Conversely, nutrient input needs to be performed in the amount and ways which minimize environmental burdens for each unit produced (Nemecek et al. Citation2011). In order to minimize the input on the system, compost or manure is commonly used as the source of Nitrogen for the stands. The addition of these nutrients can also give a positive effect to the availability of Phosphor (P) in the soil (Ohno et al. Citation2005). Teak productivity and growing age can improve the chemical characteristics of soil under the teak stands (Millkuri and Rajendra Citation2016). All of the growth characteristics are influenced significantly by Calcium, Nitrogen, and their interactions (Zhou et al. Citation2011; Raviv et al. Citation2004). There is a significant increase in the growth of teak and visual signs when the nutrients in deficiency are added back into the teak (Gopikumar and Varghese Citation2004).
Conclusion
According to the DRIS norm in the premium clone teak stands aged 17 years in plot 64f RPH Sidowayah BKPH Kedunggalar KPH Ngawi East Java Indonesia, the macronutrient indexes are shown to be N: –8.40, P: –1.70, K: –4.17; Ca: 4.98 and Mg: 9.28. The level of nutrient availability from the lowest to the highest respectively are Mg > Ca > P > K > N. Nutrient Mg and Ca possess positive index values which reflect sufficient level of availability. However, nutrient N, K, and P possess negative indexes, reflecting deficiency and therefore, they become the limiting nutrients in the experiment location. N is the highest limiting nutrient, followed consecutively by K and P. The current research recommends silviculture treatment to superior teak stands by means of balanced nutrient inputs, especially N, P, and K, to increase growth and productivity.
Acknowledgements
Gratitude is also presented to the Research Center for Soil for conducting the chemical analysis. A long list of gratitude expressions is directed to all personnel contributing to this research completion and reporting.
Disclosure statement
No potential conflict of interest was reported by the authors.
Additional information
Funding
References
- Abod SALI, Siddiqui MT. 1995. Fertilizer requirements of newly planted teak (Tectona grandis L.f.) seedlings. Pertanika J Trop Agric Sci. 25(2):121–129.
- Abod SALI, Siddiqui MT. 1998. Growth response of teak (Tectona Grandis L. F.) seedlings to nitrogen, phosphorus and potassium fertilizers. Pertanika J Trop Agric Sci. 25(2):107–113. doi:10.1016/S1872-2032(08)60078-5.
- Anonymous. 2009. Bibit unggul dan upaya silvikultur intensif (online), http://www.jatiteak.wordpress.com/2009/06/23/bibit-unggul-dan-upaya-silvikultur-intensif-silin/. Retrieved on June 20, 2017.
- Bailey JS, Cushnahan A, Beattie JAM. 1997. The Diagnosis and Recommendation Integrated System (DRIS) for diagnosing the nutrient status of grassland swards: II. Model calibration and validation. Plant Soil. 197(1):137–147.
- Ballard TM. 1985. Foliar analysis for deficiency diagnosis and fertilizer prescription in forestry: variability considerations. In: Luttmerding HA, Lowe LE, Ballard TM, editors. The role of soil analysis in resource management. B.C. Ministry of Environment Tech. Rep. p. 143–153.
- Ballard TM, Carter RE. 1986. Evaluating forest stand nutrient status. B.C. Min. For., Victoria, Land Manage. Rep. 20. p. 60.
- Bangroo S, Bhat MI, Ali T, Aziz M, Bhat MA, Wani MA. 2010. Diagnosis and Recommendation Integrated System (DRIS) – a review. Int J Curr Res. 10:84–97.
- Chen B, Liu E, Tian Q, Yan C, Zhang Y. 2014. Soil nitrogen dynamics and crop residues. A review. Agron Sustainable Dev. 34(2):429–442. https://doi.org/10.1007/s13593-014-0207-8.
- Drechsel P, Zech W. 1994. DRIS evaluation of teak (Tectona grandis L. f.) mineral nutrition and effects of nutrition and site quality on teak growth in West Africa. Forest Ecol Manage. 70(1–3):121–133.
- Fernandez-Moya J, Murillo R, Portuguez E, Fallas JL, Rios V, Kottman F, Verjansl JM. 2013. Nutrient concentration age dynamics of teak (Tectona grandis L.f.). For Syst. 22(1):123–33.
- Follett RF. 2008. Transformation and transport processes of nitrogen in agricultural systems. In: Hatfield JL, Follett RF, editors. Nitrogen in the environment. Amsterdam: Academic Press/Elsevier. https://doi.org/10.1016/B978-0-12-374347-3.00002-0.
- Gama-Rodrigues AC. 2011. Soil organic matter, nutrient cycling and biological dinitrogen-fixation in agroforestry systems. Agrofor Syst. 81(3):191–193.
- Gopikumar K, Varghese V. 2004. Sand culture studies of teak (Tectona grandis) in relation to nutritional deficiency symptoms, growth and vigour. J Trop For Sci. 16:46–61.
- Hardiwinoto S, Sukirno DP, Widiyatno, Chanan M. 2013. Identifikasi Faktor Pembatas Pertumbuhan Jati Ungggul. Laporan Akhir Penelitian DPP. Fakultas Kehutanan UGM. Yogyakarta.
- Harrison AF, Xu G. 1986. Review of nitrogen distribution and cycling in forest ecosystems. In: Haynes RJ, editor. Mineral Nitrogen in the Plant-Soil System. Orlando (FL): Academic Press; p. 1–51.
- Hendrix PF, Coleman DC, Crossley DA. 1992. Using knowledge of soil nutrient cycling processes to design sustainable agriculture. J Sustainable Agric. 2(3):63–82.
- Kiser LC, Fox TR, Carlson CA. 2013. Foliage and litter chemistry, decomposition, and nutrient release in Pinus taeda. Forests. 4(3):595–612. https://doi.org/10.3390/f4030595.
- Kirchmann H, Bergström L, Kätterer T, Mattsson L, Gesslein S. 2007. Comparison of long-term organic and conventional crop–livestock systems on a previously nutrient-depleted soil in Sweden. Agron J. 99(4):960–972. https://doi.org/10.2134/agronj2006.0061.
- Lawrence D, Foster D. 2002. Changes in forest biomass, litter dynamics and soils following shifting cultivation in Southern Mexico: an overview. Interciencia. 27(8):400–408.
- Morrison IK. 1974. Mineral nutrition of conifers with special reference to nutrient status interpretation: a review of literature. Can For Serv Publ. 1343:74.
- Millkuri CR, Rajendra MP. 2016. Influence of teak plantations on different soil chemical properties in Southern India. Int J Agric Sci Res. 6(6):203–208.
- Mirasol P. 2016. Optimising fertilizer formulations for smallholders in Asia and Africa. Fertilizer Focus. July/August 2016.
- Nemecek T, Dubois D, Huguenin-Elie O, Gaillard G. 2011. Life cycle assessment of Swiss farming systems: I. Integrated and organic farming. Agric Syst. 104(3):217–232.
- Ohno T, Griffin T, Liebman M, Porter G. 2005. Chemical characterization of soil phosphorus and organic matter in different cropping systems in Maine, U.S.A. Agric Ecosyst Environ. 105(4):625–634.
- Oldroyd GED, Dixon R. 2014. Biotechnological solutions to the nitrogen problem. Curr Opin Biotechnol. 26:19–24. https://doi.org/10.1016/j.copbio.2013.08.006.
- Raviv M, Medina S, Krasnovsky A, Ziadna H. 2004. Organic matter and nitrogen conservation in manure compost for organic agriculture. Compost Sci Utilizat. 12(1):6–10.
- Schroth G, Sinclair FL, editors. 2003. Trees, crops and soil fertility concepts and research methods. Wallingford Oxon (UK): CABI Publishing.
- Schutz CJ, de Villiers JM. 1987. 6. Foliar diagnosis and fertiliser prescription in forestry—The DRIS system and its potential. South Afr For J. 141(1):6–12.
- Siddiqui MT, Shah AH, Yaqoob S. 2009. Chronosequence and crown strata effects on foliar nutrient concentrations in teak (Tectona grandis L.f) plantations. Pak J Bot. 41(6):3023–3034.
- Stevenson GA, Kimberley MO. 1988. Can DRIS improve diagnosis of nutrient deficiency in Pinus radiata? New Zealand J For Sci. 18(1):33–42.
- Tahir S, Muhammad, Abod SA, Tariq MA. 2007. Root nutrient concentrations in teak (Tectona grandis L.f.) plantations as influenced by fertilization and age. Can J Pure Appl Sci. 1(1):45–52.
- Tanaka N, Hamazaki T, Vacharangkura T. 1998. Distribution, growth and site requirements of teak. Jpn Agric Res Q. 32(1):65–77.
- Tewari VP, Gabriel Álvarez-González J, García O. 2014. Developing a dynamic growth model for teak plantations in India. For Ecosyst. 1(1):9.
- Walworth JL, Sumner ME. 1987. The diagnosis and recommendation integrated system (DRIS). Soil Sci. 6:149–188.
- Watanabe Y, Owusu-sekyere E, Masunaga T, Buri MM, Oladele OI, Wakatsuki T. 2010. Teak (Tectona grandis) growth as influenced by soil physicochemical properties and other site conditions in Ashanti region, Ghana. J Food Agric Environ. 8:1040–1045.
- Zhou Z, Liang K, Xu D, Zhang Y, Huang G, Ma H. 2011. Effects of calcium, boron and nitrogen fertilization on the growth of teak (Tectona grandis) seedlings and chemical property of acidic soil substrate. New For. 43(2):231–243. https://doi.org/10.1007/s11056-011-9276-6.