
Abstract
Litterfall production and litter decomposition are the principal factors for controlling the functions of mangroves to store and cycle carbon and nutrients within the ecosystem. We analyzed the litterfall production, its seasonality, patterns and changes of mass loss, carbon, and nitrogen content of litterfall decomposition in different locations as well as different position of decomposition bags in Sundarbans Reserve Forest (SRF). Total annual litterfall production was 1005.9 ± 7.0 g m−2 yr−1 and leaves being the principal contributor of all the studied location throughout the study period. During the decomposition experiment, the litterfall lost 20% of its original mass in the first 60 days, and this loss continued to 50% of its original weight by the end of the experiment (196 days). There was not significant difference in the mass loss at different positions or sites during the experiment period. Monthly mean total carbon and nitrogen mass in litterfall accounted for 344.6 ± 28.7 kg ha−1 and 8.7 ± 0.7 kg ha−1, respectively. The pattern for nitrogen content showed increasing trend throughout the experiment period. Mangrove communities growing along the oligohaline zone showed higher nutrient concentration than other mangrove areas indicating their ecological significance and also efficiently retain C and N.
1. Introduction
Mangrove forests are among the world’s most productive ecosystems, as well as unique wetland ecosystems in intertidal coastal regions of the tropics and subtropics (Lugo and Snedaker Citation1975; Nagarajan et al. Citation2008). Litterfall is one of the important components to be taken into account in estimating primary productivity, especially in view of its contribution to estuarine ecosystems (Bunt Citation1995; Woodroffe et al. Citation1988; Tam et al. Citation1998; Metcalfe et al. Citation2011). Mangrove litterfall consists primarily of leaves, which become available to consumers and decomposers. Mangrove plants uptake all of their essential nutrients from sediment. Carbon, nitrogen and phosphorous are the essential nutrients for mangroves and these nutrients are brought back through the litterfall and deposited on to the sediment (Alongi et al. Citation2003; Reef et al. Citation2010; Srisunont et al. Citation2017). Nutrients are released through decomposition of litterfall, and these nutrients are also absorbed by the trees for growth. Therefore, nutrient enrichment by litterfall does not only promote nutrient recycling in mangroves but also provides complex marine food web and house for an aquatic nursery (Srisunont et al. Citation2017). In tropical and subtropical coastal regions throughout the world, mangroves contribute considerable quantities of organic matter and also as sources of nutrients through leaching to adjacent water systems (Rao et al. Citation1994).
Quantification of litterfall and decomposition is important for assessing the productivity of a mangrove ecosystem (Lee Citation1999; Imgraben and Dittmann Citation2008). Decomposition rates of litterfall will be varied with the function of analytical methods, tidal inundation, because submergence is known to accelerate decay process (Wider and Lang Citation1982z; Robertson Citation1988; Gladstone-Gallagher et al. Citation2014). Whereas litterfall in buried condition (which occurs when litterfall is retained within the forest) and this creates anoxic conditions which slowed the decomposition process and that has been demonstrated in different ecosystems (Fourqurean and Schrlau Citation2003). To understand the differences between forest floor and burial conditions, litterfall decomposition experiment should be investigated in these two conditions.
In this respect, litter production, as well as litter decomposition study, is important for assessing productivity and function of the mangrove ecosystems. There are several kinds of research on mangrove litterfall production, decomposition, and nutrient analysis of tropical and subtropical mangrove ecosystems (e.g. Subtropical: Twilley et al. Citation1986; Mackey and Smail Citation1996; Tam et al. Citation1998; Mfilinge et al. Citation2002; Khan et al. Citation2007; Imgraben and Dittmann Citation2008; Sánchez-Andrés et al. Citation2010; Kamruzzaman et al. Citation2012, Gladstone-Gallagher et al. Citation2014, Tropical: Flores-Verdugo et al. Citation1987; Robertson Citation1988; Rao et al. Citation1994; Wafar et al. Citation1997; Ochieng and Erftemeijer Citation2002; Davis et al. Citation2003; Bosire et al. Citation2005; Silva et al. Citation2007; Srisunont et al. Citation2017). However, there have been no previous studies which examined litterfall production and nutrient analysis of the Sundarbans mangrove forests in Bangladesh.
Thus, the objectives of this study were to quantify the litterfall production, investigate litterfall decomposition rates and nutrient accumulation as an important indicator for Sundarbans mangrove forest ecosystems. Initial observations of different locations of the Sundarbans mangrove forests suggested that stand structure and species composition of the mangrove communities are different. Therefore, we hypothesized that, based on stand structure and litterfall production, litterfall decomposition would be different in different locations of the Sundarbans Reserve Forest (SRF). Overall, the present study provides information regarding litterfall production and decomposition rate of litterfall for nutrient recycling in the Sundarbans Reserve Forest (SRF).
2. Methods
2.1. Study area
The Sundarbans, the world’s largest continuous patch of mangrove forest, is located in the estuary of the river Ganges–Brahmaputra. The forest is distributed over two neighboring countries, Bangladesh and India. In Bangladesh, the forest covers 6017 km2 (21°30′–22°30′ N, 89.00°–89°55′ E). Sundarbans mangrove forest is divided into three ecological zones viz. fresh water (oligohaline, salinity <2 dsm−1), moderately saline water (mesohaline, salinity 2–4 dsm−1), and salt water (polyhaline, salinity >4 dsm−1) zones (Chaffey et al. Citation1985; Siddiqi Citation2001). Changes in salinity might be responsible for the spatial distribution of plant communities (Ahmed et al. Citation2011).
Our study was conducted in a mangrove community within the oligohaline zone of the Sundarbans, Bangladesh. This area receives regular tidal inundation through the River Passur. The study revealed that all locations had similar vegetation cover and inundated regularly. Six mangrove species grow at the study site: Heritiera fomes Buch-Ham. in the family Malvaceae, Excoecaria agallocha L. in Euphorbiaceae, Bruguiera sexangula (Lour.) Poir. in Rhizophoraceae, Aglaia cucullata (Roxb.) Pellegr. and Xylocarpus mekongensis J. Koenig are in Meliaceae, and Avicennia officinalis L. in Avicenniaceae. The mean densities of H. fomes, E. agallocha, X. mekongensis, B. sexangula, A. officinalis, and A. cucullata were 1248, 533, 229, 176, 110, and 24 ha−1, respectively.
The mean annual rainfall in the region varies from about 2000 mm in the east to 1600 mm in the west (Rahman and Asaduzzaman Citation2010). The rainy season is from June to September. The period between October and February is considered winter. Higher temperature (26–34 °C) occurs between March and June, and lower temperature (12–25 °C) between December and February. The annual relative humidity varies from 70 to 80% (Rahman and Asaduzzaman Citation2010).
We established 21 plots (10 m × 10 m) in SRF, which are contiguously arranged at three separate locations in our study area. Therefore, the total area of the study plots was 2100 m2. All the trees in the study plots larger than 1.8 cm in diameter at breast height (DBH) were numbered and height (H) and DBH were measured at March 2016 and 2017, respectively. There is no distinct species zonation within the mangrove community of the study area and apparently there is no difference in habitat condition within the three locations of the study area.
2.2. Litterfall collection
Litterfall was collected using litter traps made of 1-mm mesh cloth and having a reverse case shape, 70 cm × 70 cm × 70 cm, with the collection area of 0.42 m2. They were suspended below the canopy from stems of mangroves at a height above the level of the highest tide to prevent inundation. Two litter traps were placed in each plot, i.e. a total of 42 litter traps were placed within the 21 plots. Litterfall was collected monthly from May 2016 and continued up to April 2017. The litter traps were emptied monthly; the collected litterfall was kept in a cotton bag and carried to the laboratory where it was separated into leaves, stipules, branches, flower buds, flowers, fruits, and propagules for each species. Individual litterfall components were dried at 80 °C for 48 h, desiccated at room temperature, and then weighed using a digital balance (EK-600H, A & D Co., Ltd., Tokyo, Japan).
2.3. Litterfall decomposition
Freshly fallen litter was collected from litter traps, as mangroves have nutrient resorption during senescence (Twilley et al. Citation1986). Once collected, litterfall components were air-dried for 48 h. The dried litterfall were thoroughly mixed so that each components had equal chance to become samples, and then 10 g dry litterfall mass was picked up randomly and placed in nylon bags (20 cm × 16 cm) made of 0.5 mm mesh. In addition, the air-dried weight of the initial 10 g sample converted to an oven dry weight (at 65 °C) in order to calculate the % mass loss through time. In order to estimate decomposition rates of the aboveground litter at different sites within the oligohaline zones of Sundarbans mangrove forests, the litterbags were placed at three different locations, such as Dhangmari, Ghagramari and Karamjol areas. These three sites were randomly selected to represent the mangrove communities within the oligohaline zones of Sundabans mangrove forests. We had the opportunity to compare three locations simultaneously, which allowed systematic randomized sites to represent the ideal characteristics of the oligohaline zone of the Sundrabans mangrove forests. Decomposition experiment was started in November 2016 and continued up to May 2017. To investigate variation in litterfall decomposition rates with the duration of submergence, two positions were differentiated at each site: forest floor and burial conditions. At each location we placed the litterbags at two different positions, namely, forest floor and 10 cm depth in soil. Bags were placed buried condition to test the effect of burial condition on decomposition rates. To compare decomposition over different exposure time intervals and position of litter bags, each experimental location received 30 bags (2 positions × 5 time intervals × 3 replication). Three bags were collected randomly from each experimental site at 60, 106, 117,163, and 196 days after the beginning of the experiment. At each time, three (3) bags were collected from forest floor as well as burial condition and also at each sampling date, 18 bags (2 positions × 3 sites × 3 replication) were collected for the experiment. After the bags were rinsed in water to remove most of the soil, they were opened and the collected samples were rinsed gently with tap water to remove any extra soil particles and placed in paper bags. Samples were dried to constant weight for 48 hours at 65 °C, weighed and then samples were prepared for nutrient analysis. All the litterfall components from each bag was ground to a fine powder and used around 30 mg of it as sample for analyzed C and N. So each component of litterfall had equal chance to become a homogeneous sample for analysis, because the C and N content will be different for different litterfall components (Enriquez et al. Citation1993). Total carbon and total nitrogen were measured with a CN analyzer model JM 1000 Macro Corder, J-Science Lab. Co. Ltd., Japan.
Mass loss of the litter during decomposition was compared to its initial dry weight at the various experimental sites and for different intervals.
2.4. Data analysis
Annual mass of each litterfall component was calculated by summing the monthly data of each plot. The number of replicates for litterfall was 42 (2 traps × 21 plots). Monthly litterfall data was obtained from average value of the two-litterfall traps in each plot and then also the average value of 21 plots. A two-way ANOVA was run to test significant differences among the locations and litter bag positions for mass loss, C%, N%, and C:N ratio, where response variables were mass loss, C%, N%, and C:N ratio and independent variables were locations and litter bag position. Bonferroni’s multiple comparisons were used for post hoc tests using SPSS software (v.11.5; SPSS, New York, USA).
3. Results
3.1. Litterfall production
Mean total litterfall (±SE) was 1005.9 ± 7.0 g m−2 yr−1. Young, tender, green and yellow leaves contributed the most of total litterfall. Mean leaf litterfall was 587.5 ± 4.9 g m−2 yr−1, which represents 58.4% of the total litterfall (). Mean value of the vegetative organs litterfall was 836.1 ± 6.4 g m−2 yr−1, which represents 83.1% of the total litterfall. Similarly, mean of the sum of the litterfall for reproductive organs was 169.9 ± 2.4 g m−2 yr−1, representing 16.9% of the total litterfall. Leaf litterfall was the greatest in December and May, i.e. it showed a bimodal pattern (). Branch litterfall was always small but during a rainy season the branch litterfall constituted a large portion of monthly total litterfall. Branch litterfall was highest in June and July, i.e. during the rainy season. Reproductive organs also exhibited a multimodal pattern. The highest litterfall of the reproductive organs were observed in March, August, and November. Litterfall of mostly flowers and flower buds of H. fomes and X. mekongensis was observed in March. Mature propagules of the major species of the studied mangrove communities was included in August, while immature propagules and fruits were observed in the November (i.e. beginning of winter season).
Figure 1. Changes in the contribution of various litterfall components to total litterfall production during the study period. (●: Reproductive organs; ^: Leaf; □: Branches).
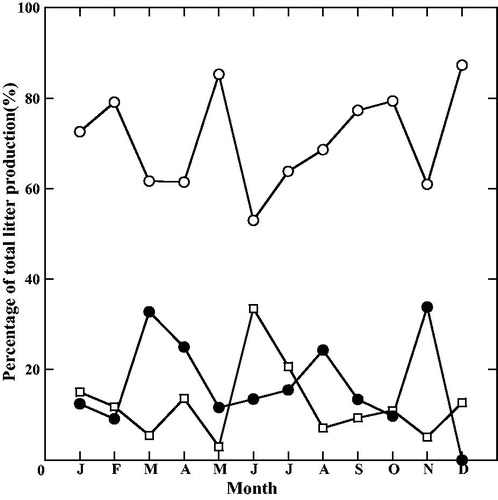
Table 1. Annual amount of vegetative and reproductive litterfall of Sundarbans mangrove forests.
3.2. Litterfall decomposition
The dry mass remaining in the litterfall after 196 d of decomposition was 40.1% for the forest floor condition at Dhangmari area, compared to 51.7% and 53.4% at Karamjol and Ghagramari areas, respectively (). Whereas, the dry mass remaining in the litterfall after 196 d of decomposition was 49.6% for the burial conditions at Dhangmari area, compared to 52.5% and 40.4% at Karamjol and Ghagramari areas, respectively (). During the early phase of the litterfall decomposition experiment (60 d), the rates of mass loss were much higher than that during the following phases for every location and for both litterbag conditions. There were differences in the initial rates of mass loss in the litterfall decomposition experiment between the forest floor and burial conditions. However, the mean rates of mass loss in three different locations and two different burial conditions were similar for the last phases of decomposition (). At the end of the decomposition experiment, forest floor and burial conditions showed mass loss rates of 51.6 ± 4.2 and 52.5 ± 3.6% of their initial dry mass, respectively. Mean rate of mass loss in dry weight over time was greater in the forest floor condition than the burial condition but these did not differ significantly ().
Figure 2. Mangrove litterfall decomposition (expressed as the percentage of original weight remaining through time) at forest floor and burial conditions. (a) Forest floor and (b) under burial in the study area. (●: Dhangmari; ^: Ghagramari; □: Karamjol).
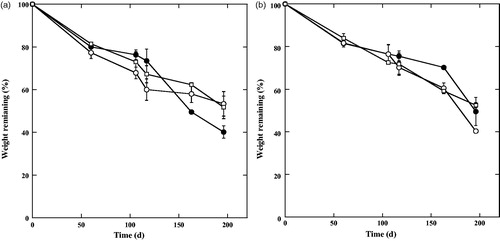
Table 2. Summary of ANOVA for weight remaining, C%, N%, and C:N ratio in litterfall after 196 d of decomposition, comparing differences between location (Dhangmari, Ghagramari, and Karamjol) and litter bag positions (forest floor and burial condition).
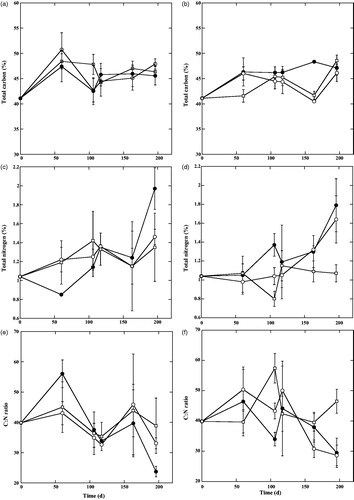
The time courses of carbon %, nitrogen %, and C: N ratio from litterfall decomposition showed variations both in the forest floor and buried conditions (). During the course of decomposition, the concentrations of C and N in the litterfall (mg g−1 dry) were increased compared to the beginning of the experiment. At the initial phase of the decomposition experiment, total C remaining (%) at forest floor conditions increased rapidly in the Ghagramari area than in the other areas, then decreased at the middle of the experimental phases. However, at the end of the decomposition experiment, it again increased than other areas (). Similarly, the pattern of total C remaining (%) at buried conditions followed a pattern similar to the forest floor conditions (). However, there were no significant differences in total C remaining % (). Initially, total N remaining (%) at forest floor conditions decreased more rapidly in the Dhangmari area than in other areas but at the end of the decomposition experiment, it increased at the highest level than the other areas (). Similarly, the pattern of total N remaining (%) at burial conditions followed a pattern similar to the forest floor conditions (). However, there were no significant differences in total N loss. The C: N ratio of the litterfall decomposition experiment at forest floor showed an overall increase over the first 60 days, declined at all three locations on 106–117 days, increased again at day 163, and then finally declined on day 196. Carbon and nitrogen content in the decomposition experiment varied through time, but generally C and N increased in litter after 196 days. We are unable to detect any statistically significant differences in C:N ratios of the litterfall decomposition between forest floor and burial conditions (Two-way ANOVA p > 0.05; ). Whereas, changes in the C: N ratios at burial conditions did not follow the same pattern to that at the forest floor. There were no significant differences in the mean weight loss, carbon %, nitrogen % and C:N ratio among the locations and litterbag conditions, and there were also no significant main effects nor interaction involving locations and litter bag conditions ().
Figure 3. Carbon and nitrogen content, and C:N ratio of litterfall during 196 days of decomposition. (a) Carbon content at forest floor. (b) Carbon content under burial. (c) Nitrogen content at forest floor. (d) Nitrogen content under burial. (e) C:N ratio at forest floor. f) C:N ratio under burial. (Symbol same as Figure 2).
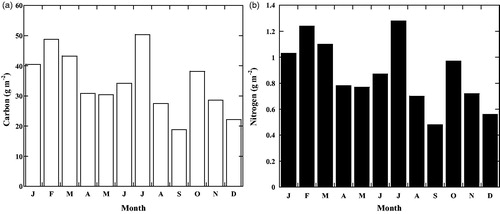
Results from a nutrient analysis in litterfall reveal that carbon and nitrogen contents in the litterfall were 411.1 ± 6.6 mg C g−1 and 10.4 ± 0.6 mg N g−1, respectively. The monthly litterfall mass of each litter component was multiplied by the C and N content to obtain a total C and N accumulation in the forest. However, the C and N contents vary for different litter components (leaf, wood etc.; Enriquez et al. Citation1993). The monthly pattern of nutrient accumulation varied with the monthly pattern of litterfall. Nutrient accumulation on the forest floor was observed throughout the year. shows seasonality of the carbon and nitrogen accumulation in the Sundarbans mangrove forests.
Figure 4. Accumulation of carbon and nitrogen in the Sundarbans mangrove forests during the study period.
4. Discussion
4.1. Litterfall production
The mean total litterfall production (10.1 Mg ha−1 yr−1) of the present mangrove forests was in the upper range of those reported for mangrove forests at Laguna de Términos, Mexico (Day et al. Citation1987), on Unguja Island, Zanzibar, Tanzania (Shunula and Whittick Citation1999), and at Central Java, Indonesia (Sukardjo Citation1996). This study showed that maximum leaf litterfall of the mangroves was observed in summer (May) and winter (December). During the winter season (December) most of the deciduous plants withdrew their leaves so the total leaf fall in December was higher than that in other months and during the summer season (May) when almost all plants shed their older leaves and recruited new leaves due to favorable temperature and moisture for their vegetative growth. Maximum production of leaves, reproductive organs and leaf fall were in summer. This is a common characteristic for almost all mangrove species around the world because this pattern is influenced by the air temperature, sunlight, and rainfall. A bimodal pattern of leaf fall was also observed by Lee (Citation1989), who reported that mangroves in Hong Kong had a bimodal pattern with peaks in spring and late summer. In contrast to the present study, Flores-Cárdenas et al. (Citation2016) reported that leaf litterfall of mangroves in Huizache-Caimanero Lagoon System, Mexico, showed a uni-modal pattern. The tropical climate could cause multimodal peaks of leaf litterfall in the mangroves in tropical areas. In case of branch litterfall, it was normally low but was high in the rainy season (June to September) when strong winds and storms occurred. Similar findings were observed at Manko Wetland, Okinawa Island, Japan (Sharma et al. Citation2012), at Ohura Bay, Okinawa Island (Hardiwinoto et al. Citation1989), and mangroves along the Brisbane River, Queensland, Australia (Mackey and Smail Citation1995), who reported that branch litterfall was higher during typhoon months and correlated with storms. While there were no clear seasonal patterns in the litterfall of reproductive organs, it was high in some months, i.e. in March, August, and November. The studied mangrove areas are characterized by mixture of different mangrove species belonging to different families. Flowering, fruiting, and propagule dropping time may be species specific. Due to the difference in production of reproductive organs, seasonality in the litterfall of reproductive organs also varied. As a result, the study showed multiple peaks in the litterfall of reproductive organs. In contrast to the present study, May (Citation1999) and Ochieng and Erftemeijer (Citation2002), who reported that mangrove species have only one peak of the reproductive litterfall in a year. In the present study, each species followed a single annual peak of the production of its reproductive organs, but in case of litterfall, it was not possible to separate the reproductive organs at the species level. Reproductive organs litterfall was observed to have some peaks due to individual tree’s reproductive phenophase and difference in the maturation period of reproductive organs. Our observation at the Sundarbans was similar to the findings of Coupland et al. (Citation2005), who reported that production of reproductive organs of four mangrove species at northern Australia did not show any single peak for all the studied species. Our study was consistent with the finding of Kamruzzaman et al. (Citation2012), who reported that none of the species showed single peak in the production of the reproductive organs. It may be concluded that the seasonality of the vegetative and reproductive organs production is controlled by the species phenology.
Leaves constituted 58.4% of the total litterfall production, which was similar to the 61.2% and 61.0% reported for Rhizophora apiculata and R. mucronata Lamk, respectively (Wafar et al. Citation1997). The present value was higher than those recorded in a subtropical mangrove at Okinawa Island, Japan (mean value 54.3%; Kamruzzaman et al. Citation2012). The contributions of branches to total litterfall observed in the present study (13%) was lower than those recorded for other subtropical mangrove areas (less than 30% at Futian mangrove swamp, China; Tam et al. Citation1998). The present value was higher than the average value reported for the subtropical mangroves (4.0–15.8%) at Okinawa Island, Japan (Kamruzzaman et al. Citation2012). The contributions of reproductive organs to total litterfall observed in the present study (16.9%) was lower than those observed for other tropical and subtropical mangroves such as mangroves at south-west coast of India (21.8–23.2%; Wafar et al. Citation1997) and mangroves at Okinawa Island, Japan (23.0–40.0%; Kamruzzaman et al. Citation2012). Our results showed that the contribution of reproductive components of Sundarbans mangrove forests to the total litterfall was lower than mangroves growing in other tropical and subtropical areas. Coupland et al. (Citation2006) reported that lower rate of fertilization might be due to limiting maternal resources and the lack of flower adaptation to either animal or wind pollination. The studied mangrove species are insect pollinated and depend mainly on Apis spp. Due to the proximity of human settlements in the study area, people have easy access to this area and they collect honey from Sundarbans by the use of smoking the honey bee, larva, and juvenile. As a result, population density of Apis spp. is reduced drastically. The unavailability of effective pollinators in the study area is a possibility for lower fertilization rate of flowers in the study area.
4.2. Litterfall decomposition
To our knowledge, this is the first study investigating litterfall decomposition and nutrient accumulation in Sundarbans mangrove forests. Decomposition experiment was carried out at three different locations within the oligohaline zone of the Sundarbans mangrove forest. Though there was a variation in the litter decomposition process at the forest floor and under the burial conditions, it is likely a common phenomenon found in other mangrove environments (Steinke and Ward Citation1988; Mall et al. Citation1991; Tam et al. Citation1998). However, the trend of the overall pattern of decomposition observed at different locations and conditions of the current study suggested that litter decomposition at different locations did not show any significant differences and had no significant interactions between locations and conditions. The litter samples in the decomposition experiment lost around 50% of its original dry weight after 196 days. This rate of original mass loss was low compared to the results of the mass loss of leaves of Rhizophora mangle leaves in other experiments (Silva et al. Citation2007), who reported that the leaves in the litter bags lost 50% of their original dry weight in 32 days. Silva et al. (Citation2007) used only leaves, but the present litter used for the experiment contained dead leaves, twigs/branches, and reproductive organs. Wang et al. (Citation2016) also reported that green litter decomposed faster than mixed litter. Due to the variation of structural tissues of different components used for the present decomposition experiment, the rate of mass loss was lower than the previous study. The low decomposition rates in the present study may have been due to the progressive accumulation of more recalcitrant compounds in the litter samples, such as lignin and cellulose, as decomposition progresses (Osono and Takeda Citation2004; Talbot and Treseder Citation2012; Wang et al. Citation2016). Our results also agree with the summarization by Gladstone-Gallagher et al. (Citation2014), who reported that decomposition rates depended on litter type, with leaves decomposing faster (63 d to decay by 50%) than pneumatophore and wood material (316 and 460 d, respectively). It is concluded that the lower decay rates measured in this study compared to other tropical studies are likely because this study used mixed litter rather than just leaf material.
The C and N contents of the litter under decomposition increased depending on location of sample placement as well as geographical location. The carbon percentage of the litterfall increased highly in the initial phase and reached up to 46% to 49% relative to the initial C content over the 196 d period. This pattern was consistent with the findings of Davis et al. (Citation2003), who reported that C-content of litterfall increased over the first three months of the study, but then declined, and approaching initial levels by the end of the experiment. The pattern for nitrogen percentage showed increasing trend throughout the experiment period. Total remaining nitrogen percentage increased up to 1.97% and initially, it was 1.04% of the dry weight of litterfall. This result was also consistent with the findings of Davis et al. (Citation2003), who recorded that pattern for nitrogen % in leaves increased throughout the experiment period. Some previous studies indicated that increases in decomposition rates are also related to an enrichment of the decomposing litter by nitrogen during the decomposition process (Twilley et al. Citation1986; Wafar et al. Citation1997; Sánchez-Andrés et al. Citation2010). We also observed the increasing trend of nitrogen % throughout the decomposition experiment, but the rate of increase was not statistically significant. Increases or decreases in nitrogen concentrations of litterfall during decomposition are part of the nitrogen recycling capacity of the mangrove ecosystems, being considered as a within-system nutrient conservation mechanism (Vitousek Citation1984). The C:N ratio of litterfall was decreased due to the fact that nitrogen loss was higher than the carbon loss during the decomposition process. In Sundarbans mangrove forests, decomposition is continued throughout the year due to higher temperature, so nutrient accumulation will be sustained though the rate was slow in this region. Similar decreasing trend of C:N ratio had been observed in subtropical and tropical mangroves (Rich and Tenore Citation1981; Dick and Osunkoya Citation2000).
There were definite peaks in carbon and nitrogen accumulation in litterfall. The highest peak of carbon and nitrogen were in July, i.e. at the peak-growing season. The second highest peak was observed in February, because E. agallocha (second dominant species) started leaf shedding from February and X. mekongensis also shedded their leaves from December and continuing until March. Carbon concentrations for the studied mangrove forests was 411.1 ± 6.6 mg g−1, which is almost identical to the values for Rhizophora apiculata leaves at tropical mangrove areas (412 mg g−1; Duarte et al. Citation1998). The present value was lower than those recorded on carbon concentrations of leaves of other mangrove species at tropical areas (e.g. 419–486 mg g−1; Alongi et al. Citation2002, 419–443 mg g−1; Alongi et al. Citation2003) and subtropical areas (419–472 mg g−1; Khan et al. Citation2007). The present study showed that the mean value of carbon % in litterfall decomposition experiment (41%) was lower than those reported for leaves in Rhizophora mangle L. in oligotrophic mangrove wetlands (48%). Whereas the present mean value of nitrogen % (1.04%) was higher than that of the same species (0.6%; Davis et al. Citation2003). The monthly mean total nitrogen content in litterfall accounted for 8.7 ± 0.7 kg ha−1, which may be the main source of the nutrient reservoir in the studied mangrove forests. The present nitrogen content in litterfall was closest to the higher range of 1.6–9.9 kg ha−1 for the different litterfall components of Rhizophora stylosa stands along the northern coast of western Australia (Alongi et al. Citation2003). Due to the greater contribution of nitrogen in litterfall components, nutrient concentration on the studied mangroves was generally higher than other mangrove areas. It is known that a major portion of the litterfall of the mangroves is flushed by the tidal water and is transported by the water system of the mangrove ecosystem, then is consumed by the aquatic fishes and animals (Heald and Odum Citation1970; Ewink Citation1974).
Acknowledgements
The authors are grateful to the Forest Department, Govt. of the People’s Republic of Bangladesh for establishing the research plots in the SRF and for assisting the research team in collecting data. The authors are grateful to Mr. Minhaj-Uj Siraj for his invaluable assistance during field data collection.
Disclosure statement
No potential conflict of interest was reported by the authors.
References
- Alongi DM, Clough BF, Dixon P, Tirendi F. 2003. Nutrient partitioning and storage in arid-zone forests of the mangroves Rhizophora stylosa and Avicennia marina. Trees. 17(1):51–60.
- Alongi DM, Trott LA, Wattayakorn G, Clough BF. 2002. Below-ground nitrogen cycling in relation to net canopy production in mangrove forests of southern Thailand. Mar Biol. 140:855–864.
- Ahmed A, Aziz A, Khan AZMNA, Islam MN, Iqbal KF, Nazma M, Islam MS. 2011. Tree diversity as affected by salinity in the Sundarban mangrove forests, Bangladesh. Bangladesh J Bot. 40:197–202.
- Bosire JO, Dahdouh-Guebas F, Kairo JG, Kazungu J, Dehairs F, Koedam N. 2005. Litter degradation and CN dynmaics in reforested mangrove plantations at Gazi Bay, Kenya. Biol Cons. 126(2):287–295.
- Bunt JS. 1995. Continental scale patterns in mangrove litterfall. Hydrobiologia. 295(1–3):135–140.
- Chaffey DR, Miller FR, Sandom JH. 1985. A forest inventory of the Sundarban, Bangladesh. Project Report 140. Surrey, England: Land Resources Development Centre,196p.
- Coupland GT, Paling EI, McGuinness KA. 2005. Vegetative and reproductive phenologies of four mangrove species from northern Australia. Aust J Bot. 53(2):109–117.
- Coupland GT, Paling EI, McGuinness KA. 2006. Floral abortion and pollination in four species of tropical mangroves from northern Australia. Aquat Bot. 84(2):151–157.
- Davis SE, Corronado-Molina C, Childers DL, Day JW. Jr. 2003. Temporally dependent C, N, and P dynamics associated with the decay of Rhizophora mangle L. leaf litter in oligotrophic mangrove wetlands of the Southern Everglades. Aquat Bot. 75(3):199–215.
- Day JW, Conner WH, Ley-Lou F, Day RH, Navarro AM. 1987. The productivity and composition of mangrove forests, Laguna De Términos, Mexico. Aquat Bot. 27(3):267–284.
- Dick TM, Osunkoya OO. 2000. Influence of tidal restriction floodgates on decomposition of mangrove litter. Aquat Bot. 68(3):273–280.
- Duarte CM, Geertz-Hansen O, Thampanya U, Terrados J, Fortes MD, Kamp-Nielsen NL, Borum J, Boromthanarath S. 1998. Relationship between sediment conditions and mangrove Rhizophora apiculata seedling growth and nutrient status. Mar Ecol Prog Ser. 175:277–283.
- Enriquez S, Duarte CM, Sandjensen K. 1993. Patterns in decomposition rates among photosynthetic organisms: the importance of detritus C:N:P content. Oecologia. 94:457–471.
- Ewink GL. 1974. Macrobenthos comparisons in mangrove estuaries. In: Walsh G, Snedaker S, Teas H, editors. Proceedings of international symposium on the biology and management of mangroves, Honolulu. Gainesville: University of Florida; p.256–285.
- Flores-Cárdenas F, Hurtado-Oliva MA, Doyle TW, Nieves-Soto M, Díaz-Castro S, Manzano-Sarabia M. 2016. Litterfall production of mangroves in Huizache-Caimanro Lagoon system, Mexico. J Coast Res. 33:118–124. doi:10.2112/JCOASTRES-D-15-00242.1.
- Flores-Verdugo FJ, Day JW, Briseno-Duenas R. 1987. Structure, litterfall, decomposition, and detritus dynamics of mangroves in a Mexican coastal lagoon with an ephemeral inlet. Mar Ecol Prog Ser. 35:83–90.
- Fourqurean JW, Schrlau JE. 2003. Changes in nutrient content and stable isotope ratios of C and N during decomposition of sea grasses and mangrove leaves along a nutrient availability gradient in Florida Bay, USA. Chem Ecol. 19(5):373–390.
- Gladstone-Gallagher RV, Lundquist CJ, Pilditch CA. 2014. Mangrove (Avicennia marina Subsp. australasica) litter production and decomposition in a temperate estuary. NZ J Mar Freshwater Res. 48(1):24–37.
- Hardiwinoto S, Nakasuga T, Igarashi T. 1989. Litter production and decomposition of a mangrove forest at Ohura Bay, Okinawa. Res Bull Coll Exp for Hokkaido Univ. 46:577–594.
- Heald EJ, Odum WE. 1970. The contribution of mangrove swamps to Florida fisheries. Proc. Gulf Caribb. Fish Inst. 22:130–135.
- Imgraben S, Dittmann S. 2008. Leaf litter dynamics and litter consumption in two temperate South Australian mangrove forests. J Sea Res. 59(1–2):83–93.
- Kamruzzaman M, Sharma S, Hoque ATMR, Hagihara A. 2012. Litterfall of three subtropical mangrove species in the family Rhizophoraceae. J Oceanogr. 68(6):841–850.
- Khan MNI, Suwa R, Hagihara A. 2007. Carbon and nitrogen pools in a mangrove stand of Kandelia obovata (S., L.) Yong: vertical distribution in the soil-vegetation system. Wetlands Ecol Manage. 15(2):141–153.
- Lee SY. 1999. Tropical mangrove ecology: physical and biotic factors influencing ecosystem structure and function. Aust J Ecol. 24(4):355–366.
- Lee SY. 1989. Litter production and turnover of the Mangrove Kandelia obovata (L.) Druce in a Hong Kong tidal shrimp pond. Estuar Coast Shelf Sci. 29(1):75–87.
- Lugo AE, Snedaker SC. 1975. Properties of a mangrove forest in southern Florida. In: Walsh G, Snedaker S, Teas H, editors. Proceedings of the international symposium on biology and management of mangroves. Gainesville: University of Florida; p.170–212.
- Mackey AP, Smail G. 1995. Spatial and temporal variation in litterfall of Avicennia marina (Forssk.) Vierh. In the Brisbane River, Queensland, Australia. Aquat Bot. 52(1-2):133–142.
- Mackey AP, Smail G. 1996. The decomposition of mangrove litter in a subtropical mangrove forest. Hydrobiologia. 332(2):93–98.
- Mall LP, Singh VP, Garge A. 1991. Study of biomass, litterfall, litter decomposition and soil respiration in monogeneric mangrove and mixed mangrove forests of Andaman Islands. Trop Ecol. 32:144–152.
- May JD. 1999. Spatial variation in litter production by the mangrove Avicennia marina var. australsica in Rangaunu Harbour, North land, New Zealand. J Mar Freshw Res. 33(2):163–172.
- Metcalfe KN, Franklin DC, McGuinness KA. 2011. Mangrove litterfall: extrapolation from traps to a large tropical macrotidal harbour. Estuar Coast Shelf Sci. 95(1):245–252.
- Mfilinge PL, Atta N, Tsuchiya M. 2002. Nutrient dynamics and leaf litter decomposition in a subtropical mangrove forest at Oura Bay, Okinawa, Japan. Trees. 16(2–3):172–180.
- Nagarajan B, Pandiarajan C, Krishnamoorthy M, Sophia P. 2008. Reproductive fitness and success in mangroves: implication on conservation. In: Sengupta M, Dalwani R, editors. Proceedings of Taal 2007: the 12th World Lake Conference; p.29–33.International Lake Environmnet Committee Foundation, held in Jaipur(India).
- Ochieng CA, Erftemeijer PLA. 2002. Phenology, litterfall and nutrient resorption in Avicennia marina (Forssk.) Vierh in Gazi bay, Kenya. Trees. 16(2–3):167–171.
- Osono T, Takeda H. 2004. Accumulation and release of nitrogen and phosphorous in relation to lignin decomposition in leaf litter of 14 tree species. Ecol Res. 19(6):593–602.
- Rahman MR, Asaduzzaman M. 2010. Ecology of Sundarban, Bangladesh. J Sci Foundation. 8:35–47.
- Rao RG, Woitchik AF, Goeyens L, Riet AV, Kazungu J, Dehairs F. 1994. Carbon, nitrogen contents and stable carbon isotope abundance in mangrove leaves from an east African coastal lagoon (Kenya). Aquat Bot. 47(2):175–183.
- Reef R, Feller IC, Lovelock CE. 2010. Nutrition of mangroves. Tree Physiol. 30(9):1148–1160.
- Rich DL, Tenore KR. 1981. Dynamics of carbon and nitrogen during the decomposition of detritus derived from estuarine macrophytes. Estuar Coast Shelf Sci. 13:681–690.
- Robertson AI. 1988. Decomposition of mangrove leaf litter in tropical Australia. J Exp Mar Biol Ecol. 116(3):235–247.
- Sánchez-Andrés R, Sánchez-Carrillo S, Alatorre LC, Cirujano S, Álvarez-Cobelas M. 2010. Litterfall dynamics and nutrient decomposition of arid mangroves in the Gulf of California: their role sustaining ecosystem heterotrophy. Estuar Coast Shelf Sci. 89(3):191–199.
- Sharma S, Hoque ATMR, Analuddin K, Hagihara A. 2012. Litterfall dynamics in an overcrowded mangrove Kandelia obovata (S., L.) Yong stand over five years. Estuar Coast Shelf Sci. 98:31–41.
- Shunula JP, Whittick A. 1999. Aspects of litter production in mangroves from Unguja Island, Zanzibar, Tanzania. Estuar Coast Shelf Sci. 49:51–54.
- Siddiqi NA. 2001. Mangrove forestry in Bangladesh. Chittagong (Bangladesh): Institute of Forestry and Environmental Sciences, University of Chittagong.
- Silva CAR, Oliveira SR, Rêgo RDP, Mozeto AA. 2007. Dynamics of phosphorus and nitrogen through litter fall and decomposition in a tropical mangrove forest. Mar Environ Res. 64(4):524–534.
- Srisunont T, Srisunont C, Jaiyen T, Tenrung M, Likitchaikul M. 2017. Nutrient accumulation by litterfall in mangrove forest at Klong Khone, Thailand. Thammasat Int J Sci Tech. 22:9–18.
- Steinke TD, Ward CJ. 1988. Degradation of mangrove leaf litter in the St. Lucia Estuary as influenced by season and exposure. S Afr J Bot. 54(5):445–454.
- Sukardjo S. 1996. The relationship of litterfall to basal area and climatic variables in the Rhizophora mucronata Lamarck plantation at Tritih, Central Java, Indonesia. J Southeast Asian Stud. 34:424–432.
- Talbot JM, Treseder KK. 2012. Interactions among lignin, cellulose, and nitrogen drive litter chemistry–decay relationships. Ecology. 93(2):345–354.
- Tam NFY, Won YS, Lan CY, Wang LN. 1998. Litter production and decomposition in a subtropical mangrove swamp receiving wastewater. J Exp Mar Biol Ecol. 226(1):1–18.
- Twilley RR, Lugo AE, Patterson-Zucca C. 1986. Litter production and turnover in basin mangrove forests in Southwest Florida. Ecology. 67(3):670–683. −
- Vitousek PM. 1984. Litterfall, nutrient cycling, and nutrient limitation in tropical forests. Ecology. 65(1):285–298.
- Wafar S, Untawale AG, Wafar M. 1997. Litter fall and energy flux in a mangrove ecosystem. Estuar Coast Shelf Sci. 44(1):111–124.
- Wang W, Sardans J, Tong C, Wang C, Ouyang L, Bartrons M, Peñuelas J. 2016. Typhoon enhancement of N and P release from litter and changes in the litter N:P ratio in a subtropical tidal wetland. Environ Res Lett. 11:1–16.
- Wider R. Kelman,Lang G.E. 1982. A critique of the analytical methods used in examining decomposition data obtained from litter bags. Ecology. 63(6):1636-1642
- Woodroffe CD, Bardsley KN, Ward PJ, Hanley JR. 1988. Production of mangrove litter in a macrotidal embayment, Darwin Harbour, NT, Australia. Estuar Coast Shelf Sci. 26(6):581–598.