
 ?Mathematical formulae have been encoded as MathML and are displayed in this HTML version using MathJax in order to improve their display. Uncheck the box to turn MathJax off. This feature requires Javascript. Click on a formula to zoom.
Abstract
This study was conducted to develop a stem volume table for Quercus mongolica in Korea by using Kozak’s stem taper equation. A total of 958 Quercus mongolica sample trees were collected around the country and a growth performance was investigated through compiling data of diameters by stem height and stem analysis. Fitness Index (FI), Bias, and Mean Absolute Deviation (MAD) were used to test the stem taper equation’s fitness. The fitness of the equation was estimated at 98%, bias as −0.0024, and MAD turned out as 0.6814. Furthermore, there was a statistically significant volume difference between the current volume table and the new volume table (p < .005). The result indicates that using the new volume table which reflects the actual forest will reduce a loss when assessing wood resources and also improve the accuracy of forest statistics at national and local governments. A stem volume table, the main result of this research which is utilized by estimated stem taper equation, will provide growth information of Quercus mongolica, one of the main broadleaf species in Korea and furthermore, work as a management indicator for rational forest management.
Introduction
Climate change, caused by an increase in greenhouse gas emission is turning the forest structure and tree species into Quercus (Park and Moon Citation1999; Kang et al. Citation2015b). Quercus, the main species in a broadleaf forest, can be found all around the country since Korea phytogeographically belongs to Quercus region. As of the end of 2015, Quercus is the most distributed broadleaf species, covering 975,171 hectares out of 2,028,855 hectares which is the total forest area of broadleaf species in Korea. It also has a high stocking, occupying 263,738,277 m³ out of 133,606,365 m³ which takes about 50% of all the stock for broadleaf species (Korea Forest Service Citation2017). Most of the Quercus in Korea, except Quercus mongolica, form a mixed forest with needleleaf trees, other broadleaf trees or few different types of Quercus. Otherwise, it is represented as a dispersed, small-sized pure forest, but whereas Quercus monglolica, itself forms a stand that is nearly a large-sized pure forest, mostly appearing in an alpine zone (Korea Forest Research Institute Citation2012a).
While the stock of Age Class II ∼ III that belong to a juvenile stage is reduced drastically from 69.4% in 1960 to 23% in 2010, the stock of Age Class IV∼V that belong to adolescent and mature stage increased significantly from 22.7% to 65.6% (Korea Forestry Service Citation2013). This implies that the current stem volume table does not necessarily reflect the current forest stand characteristics since when calculating the volume of the stand, it was estimated by using the average of national data while Korean forests were still in the juvenile stage. Statistically, this can lead to underestimated or overestimated results.
Forests can function in various ways with the optimal forest management. An accurate tree volume estimation forms the basis for the optimal forest management and the estimation is a critical data for afforestation form and intensity, and thus, eventually dedicate to a rational stand management (Kang et al. Citation2014a). It is necessary to aim for high accuracy with the tree volume estimation because a stand unit volume for a national forest management is decided by each tree unit (Kang et al. Citation2014a).
Determining a stem volume by using the optimal stem taper equation sets a stem height as an independent variable and indicates a stem form, applying a curve formula that estimates the diameter of the corresponding height. This enables finding a diameter at the particular height, or stem height by using the diameter, which also allows estimating the whole stem volume and merchantable volume (Ayer Sachet et al. Citation1989).
In conclusion, the purpose of this study is to identify that the current volume table has a limitation of not precisely reflecting the real stand as the age and diameter class in Korean forests have ascended and therefore, develop a stem taper equation that is applicable to the whole diameter class for Korean Quercus Monglica and a stem volume table that includes a bark.
Materials and methods
Testing materials
This study was conducted to develop a stem volume table for Quercus mongolica, a main species of Quercus. Quercus mongolica, spread all around the country was analyzed, assorted by the distribution area on 1/5000 scale forest type map by geographic regions, and investigated according to a ratio of distribution area. A total of 958 sample trees were collected evenly by diameter class (small, medium, large) for 5 months from June 2017 to October 2017 and the growth performance was analyzed by collecting stem analysis samples at an equal rate. The average stand age of the sample trees was 35-years-old, followed with an average diameter at breast height (DBH) and an average height which were 16.6 cm and 12.4 m respectively ().
Table 1. Characteristics of surveyed sample trees.
Analysis method
A Kozak model (Kozak Citation1988), known as the best variable-exponent model for stem taper estimation, was used to obtain a stem taper curve of Quercus mongolica and compute the optimal stem taper equation in order to compile a stem volume table (). The model is often used in developed countries, including the US, Canada and was also used when developing stem volume tables for 11 major tree species domestically (Korea Forest Research Institute Citation2012b).
Table 2. Applied stem taper equation for fitting of Quercus mongolica in this study.
A strength of Kozak model, a variable-exponent model which uses an integral method and a stem taper, is that it is more clear and precise compare to segmented polynomial model (Max and Burkhart Citation1976) which was mostly used from the 70s to the 80s. Additionally, the model also has advantages of using fewer inflection points and calculating the actual merchantable tree volume, since an adjustment between the diameters of the upper end and the large end is flexible.
Statistic test
The test statistic to evaluate the fitness of Quercus mongolica’s stem taper equation by using Kozak model is as follows (). Fit index (FI) on test statistic shows a relation between nonlinear formula and variable and has the same features as a linear formula’s coefficient of determination, R2. Non-linear regression analysis, the coefficient of determination of which is meaningless, is represented to study a relevance between the actual value and the estimate. Mean Absolute Deviation (MAD) is the average of the estimated residual’s absolute value and it expresses the average amount of each estimates’ deviation. It compares between Bias, which shows whether estimation gives under or excess value on average to the true value of the parameter, and percentage (SEE%) of the residual’s standard error and then evaluates a relative accuracy of the model. These statistics show differences between the observed value and the estimated value, signifying higher accuracy as the value is closer to 0. Meanwhile, as test statistic can only verify a capacity estimation of stem taper equation and does not imply estimation bias of excess or under value on volume and diameter, it is necessary to check distribution map of the residuals on estimated values (Lee et al. Citation1999; Son et al. Citation2012; Kang et al. Citation2014b; Son et al. Citation2017).
Table 3. Accuracy assessment for estimation of Kozak’s stem taper equation.
Results and discussion
Results of stem taper equation parameter
A parameter of Quercus mongolica’s Stem taper, using Kozak model and test statistic is as follows ().
Table 4. Parameters and statistics of Kozak’s stem profile model for Quercus mongolica.
The fitness of stem taper equation was estimated as highly as 98%, SEE was shown as 0.9160 and Bias as −0.0024 which is close to zero and shows not much difference with the average. It has a similar error range with an earlier study on broadleaf species using Kozak model. The precedent study resulted in Bias as −0.0042, SEE as 0.8656 on Robinia pseudoacacia and Bias as −0.0042, SEE as 0.8915 on Eucalyptus. Moreover, the study appeared to have more clear and precise results than an earlier study (Kang et al. Citation2015b) on developing stem taper equation of Quercus serrata, which also belongs to Quercus. The precedent study resulted in FI as 0.9, Bias as 0.115, and SEE as 1.1998.
Applied by Kozak’s theory (1988), the p-value in is an inflection point of stem taper curve and it’s placed at 0.2 which is 20% of the relative stem height. The inflection point was randomly selected among the points where a curve changes on the distribution map of diameters by stem height. There are studies about an inflection point domestically, using Kozak’s model (1988) and some examples of the estimated points are as follows: Quercus acuta Thunb in Wando, Jeollanam-do as 0.25, Quercus acuta Thunb in Jeju-do as 0.22, Japanese cedar in Jeju-do as 0.20 (Kang et al. Citation2015a), Cryptomeria japonica in experimental forest at National Institute of Forest Science, Seogwipo-si, Jeju-do as 0.22 (Seo et al. Citation2014). This indicates that even if it’s the same species, an inflection point may vary depending on the region (Son et al. Citation2012). The Inflection point is related to the growth environment of the tree. The inflection point of Pinus thunbergii, which is mostly located on the coast without any slopes, is shown at 0.15, whereas most of the other species have at over 0.2 (Son et al. Citation2017). Additionally, some other reported results on inflection points of the stems are as follows: Pinus as 0.25, Picea jezoensisas 0.3, and Populus davidiana Dode as 0.2 (Son et al. Citation2009).
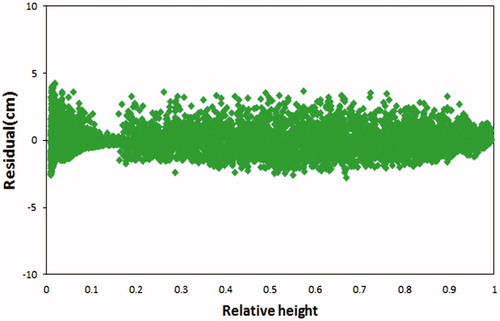
Residual analysis of stem taper equation
The fitness of stem taper model was tested and verified based on FI, Bias, SEE, MAD and etc. in . Besides the test statistic, residual distribution(y relative height and an average range of observed and estimated value were identified in order to verify whether the result is off from the average range ().
Figure 1. Resdual distribution of estimated diameter based on relative height.
Comparison of stem taper curve
A schematized stem curve of Quercus mongolica, using a diameter, a relative height (RH) and a calculated parameter from Kozak model, is as follows ().
Figure 2. Stem taper curve patten of Quercus mongolica.
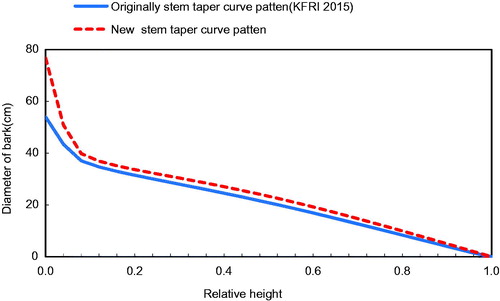
is a comparison of stem taper patterns between the current volume table of Quercus mongolica and the newly developed table. Although it is hard to distinguish a schematized stem taper curve in detail on the image, it’s identifiable that the values from the newly developed stem volume table were slightly higher than the current one.
Developing stem volume table
The new stem volume table of Quercus mongolica, as the current volume table (Korea Forest Research Institute Citation2015), was calculated based on 5 m if the height was over DBH 6 cm (). The stem volume table includes bark of each sample trees and the actual measurement value of the stem volume is calculated by Segmented polynomial equation and Smalian’s formula based on measured diameters by stem height. In order to calculate an estimated measurement value of the stem volume, first of all, derive a stem taper equation on each model, using measured stem heights and diameters and then with this data, estimate a diameter at every 10 cm stem heights. Lastly, calculate the values with Segmented Polynomial equation and Smalian’s formula (Son et al. Citation2012; Kang et al. Citation2014b). A T-test was conducted in order to observe a statistical difference between the stem volume table of Quercus mongolica that used Kozak model and the stem volume table that is currently used. The result is as follows (). As seen in , through the statistical test, an average volume of the new volume table turned out to be higher than the current volume table and it implies a significant difference in volume, statistically (p < .005). This indicates that the current stem volume table, because it uses old data, does not reflect the present stands properly. Therefore, it is considered that applying the new stem volume table of Quercus Monglolica provided in this study is necessary.
Table 5. Stem volume table for Quercus mongolica.
Table 6. Analysis of T-test between Oridinally stem volume table and New stem volume table.
Conclusion
This study was conducted to develop a stem volume table of Quercus mongolica, which belongs to Quercus that is spread all around the country, by using Kozak’s model which is known as a formula with high fitness for estimating stem taper of forest trees. FI, Bias, MAD, etc. were used as a statistic test in order to verify a fitness of Kozak’s model on estimating a stem taper of Quercus mongolica. As a result, the analysis shows that the model is suitable for estimating the stem taper of Quercus mongolica. There was statistically a significant difference in volume between the current volume table and the new volume table (p < .005). According to the study, because the current volume table has a great difference with the newly developed volume table which is based on the present forest condition, there will be considerable differences when estimating volumes by hectare. This indicates that the current volume table is inappropriate as a preliminary data for forest management since it doesn’t fully reflect the current forests and also will lead to a loss when assessing wood resources. Therefore, using the new volume table is desirable in terms of usability and accuracy. The new volume table of Quercus mongolica will trades, sales, etc. in forest management and will work as a management indicator when creating forest statistics for national and local governments. Also, it is expected to be used in various forest business for calculating environmental factors such as carbon stock and forestry greenhouse gas inventory.
References
- Ayer Sachet JK, Briggs DG, Fight RD. 1989. Tree value system: users guide. DA. General Technical Report PNW-GTR-234. p. 45.
- Kozak A. 1988. A variable-exponent taper equation. Can J for Res. 18(11):1363–1368.
- Kang JT, Son YM, Kim SW, Lee SJ, Park H. 2014a. Development of local stem volume table for Pinus densiflora S. et Z. using tree stem taper model. Korean J Agric Forest Meteorol. 16(4):327–335.
- Kang JT, Son YM, Kim SW, Park H, Hwang JS. 2014b. Development of local stem volume table for larix kaempferi using Kozak’s Stem Taper Model. J Agric Life Sci. 48(6):119–131.
- Kang JT, Moon HS, Son YM, Ahn KW. 2015a. An estimation on the stem volume of Cryptomeria Japonica in Jeju using Kozak’s Stem Taper Model. J Korean Island. 27(3):145–160.
- Kang JT, Son YM, Jeon JH, Yoo BO. 2015b. Estimation of carbon stock by development of stem taper equation and carbon emission factors for Quercus serrata. J Climate Change Res. 6(4):357–366.
- Korea Forest Research Institute. 2012a. Economic tree species 2. Research Report on Korea Forest Research Institute. Seoul, Korea. p. 16.
- Korea Forest Research Institute. 2012b. Stumpage volume biomass and stand yield table. Seoul: Korea Forest Research Institute (in Korean). p. 212.
- Korea Forestry Service. 2013. Assessment of the Korea forest resources. DaeJeon: Korea Forestry Service (in Korea). p. 59.
- Korea Forest Research Institute. 2015. Stumpage volume Biomass and Stand yield table. Seoul: Korea Forest Research Institute. (in Korea). p. 212.
- Korea Forest Service 2017. Statistical yearbook of forest. Daejeon: Korea Forest Service (in Korean). p. 441.
- Lee KH, Son YM, Chung YG, Lee WK. 1999. A taper and volume prediction system for Pinus densiflora in Kangwon province, Korea. Korea Forest Inst J Forest Sci. 62:155–166.
- Max TA, Burkhart HE. 1976. Segmented polynomial regression applied taper equations. Forest Sci. 22(3):283–289.
- Park IH, Moon GS. 1999. Species competition and productivity in a natural mixed forest Pinus densiflora and Quercus variabilis at a Mt. Mohu Area. J Korean Soc 88:462–468.
- Seo YO, Jung SC, Won HK, Lee YJ. 2014. Taper equation and stem volume table of Cryptomeria japonica in Jeju experimental forests. J Agirc Life Sci. 49(1):71–77.
- Son YM, Kim H, Lee HW, Kim CM, Kim CS, Kim JW, Joo RW, Lee KH. 2009. Taper equations and stem volume table of Eucalyptus pellita and Acacia mangium plantations in Indonesia. J Korean Forest Soc. 98(6):633–638.
- Son YM, Jeon JH, Pyo JK, Kim KN, Kim SW, Lee KH. 2012. Development of stem volume table for Robinia pseudoacacia using Kozak’s stem profile model. J Agric Life Sci. 46(6):43–49.
- Son YM, Kang JT, Jeon JH, Ko CU. 2017. The estimation of stem volume for Pinus thunbergii by coast using Kozak’s Stem Taper Model in Korea. JKI. 29(4):225–244.