
 ?Mathematical formulae have been encoded as MathML and are displayed in this HTML version using MathJax in order to improve their display. Uncheck the box to turn MathJax off. This feature requires Javascript. Click on a formula to zoom.
Abstract
Magnolia kobus is a deciduous, broadleaved tree native to Jeju Island of Korea and Japan. The species has been introduced in mainland Korea as a landscape plant, and some individual plants have been found in forests of the mainland. The objective of the present study was to examine whether M. kobus individuals have spontaneously formed communities as part of a natural settlement process. Diameter at breast height (DBH), flower, fruit, and GPS coordinates were recorded for all M. kobus individuals in the study sites. Age of the trees was determined using an increment borer. A total of 158 M. kobus individuals were identified. The reverse J-shaped Diameter at breast height distribution trend was confirmed. DBH and age of M. kobus samples were positively correlated, confirming that the distribution of individuals with varying DBH classes suggested an uneven-aged forest with the coexistence of trees from different generations. In all the survey sites, individuals of M. kobus with small DBH that did not reach inflorescence formation and fructification stages coexisted with individuals that flowered and produced fruits, which suggested the presence of overlapping generations of trees. Therefore, we concluded that M. kobus individuals were forming populations in the forests of mainland Korea.
Introduction
Magnolia is a genus that has been successfully introduced for use in landscaping. Currently, there are about 220 native species of Magnolia throughout the world and over 1000 varieties have been registered worldwide (Nelson Citation2008; Magnolia Society International Citation2017).
Magnolia kobus DC. is a deciduous, broadleaved tree native to Jeju Island of Korea and Japan (Sargent Citation1894; Gardiner Citation1989; Callaway Citation1994; Lee Citation2003; KNA 2010; Kim and Kim Citation2011; NIBR 2012; Lee and Chang Citation2015). Tree height generally reaches 10–15 m, but some trees may grow taller (approximately 24 m). They typically grow in shrublands or secondary deciduous broadleaved forests, and they may appear up to an elevation of 1700 m. Because they tend to show strong resistance to cold weather and are capable of adapting to various climate conditions, they can be cultivated in mainland Korea and survive winter conditions. Moreover, although they prefer humus-rich soil with good drainage and high moisture content, they can adapt to a variety of soil types, which makes them relatively easy to grow. Consequently, they are being used as landscaping plants throughout Korea (Gardiner Citation1989; Callaway Citation1994; KNA 2010; Kim and Kim Citation2011; Lohr and Hummel Citation2014; Lee and Chang Citation2015; Royal Horticultural Society Citation2018).
Jeju Island of Korea, a natural habitat of M. kobus, has a slightly different ecological environment from the mainland owing to its geographical isolation. Consequently, anthropogenic migration of species between the two regions may cause ecological problems (Park et al. Citation1997). This is because ecosystems unique to specific regions exist within the same country, and any species that is introduced in a region can act as a non-native species (Dogra et al. Citation2010; Lockwood et al. Citation2013; Jung et al. Citation2016). Individual plants of M. kobus, which has been introduced in mainland Korea as a landscape plant, have been found in forests outside Jeju Island (Byun et al. Citation2013; Kang et al. Citation2015). Because they were widely used for landscaping, such appearances were often believed to be a result of anthropogenic planting or accidental growth of individual plants. However, if the appearance of M. kobus individuals in forests represents a natural establishment process, it would be necessary to monitor the ecological effect of such settlements. Accordingly, the objective of the present study was to examine whether M. kobus individuals that were introduced as landscape plants have spontaneously formed communities as part of a natural settlement process to determine whether follow-up monitoring on M. kobus is needed.
Materials and methods
Study area and data collection
On-site survey was conducted in April 2017, during M. kobus blooming season at three sites located in Seoul, where M. kobus was planted for landscaping purposes (Bukhansan: 37°38′N, 127°00′E, Bongjesan: 37°32′N, 126°51′E, and Yongwangsan: 37°32′N, 126°52′E). A total area of 300,000 m2 (100,000 m2 per site) was surveyed. Diameter at breast height (DBH) and GPS coordinates were recorded for all M. kobus individuals in the study sites. Age of the trees was determined using an increment borer (Haglöf Sweden, Långsele, Sweden). All statistical analyses were performed using SPSS version 17 for Windows (IBM Corp., Armonk, NY, USA).
Population analysis
To be considered established, M. kobus plants must be able to form and maintain a population and grow on their own without any human involvement (Williams Citation1997, Citation2003; Richardson et al. Citation2000; Heger Citation2001; Radosevich et al. Citation2003; Colautti and MacIsaac Citation2004; Theoharides and Dukes Citation2007). In the present study, reproductive capability of M. kobus was determined by observing inflorescence formation and fructification, whereas the number of individuals according to DBH classes was used to infer seedling emergence and generational composition. Generally, if the distribution of individuals by DBH classes shows a reverse J-shaped curve, it can be inferred that generations are constituted by the sustained emergence of individuals, which would indicate a stable population (Khamyong et al. Citation2003; Rasingam and Parathasarathy Citation2009; Clatterbuck et al. Citation2010). However, even if the distribution of individuals according to DBH classes shows a reverse J-shaped curve, such a result may be indicative of an even-aged forest, which may be seen among shade-tolerant plants found below the canopy that can withstand closed-canopy environment for a long time (Clatterbuck et al. Citation2010). Plants with long life or slow growth may show different types of distribution curves (Cousins et al. Citation2014). Accordingly, correlation analysis was performed to establish the assumption that differences in DBH classes are related to plant age, whereas regression analysis was performed to estimate plant age. Lastly, the changes in the percentages of individuals that showed inflorescence formation and fructification according to DBH classes were analyzed to estimate the production of the next generation of plants and their development into mature trees.
Species identification
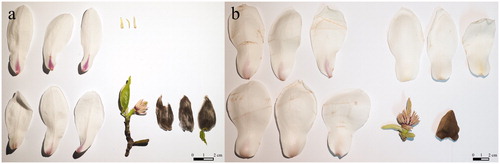
Along with M. kobus, M. denudata from China was one of the plants that was often used in landscaping. Because many M. denudata were planted for landscaping purposes, this species was found near the survey sites. Therefore, it was necessary to unambiguously confirm the identity of M. kobus plants. M. kobus has 9–12 tepals, comprising three small, broad, and straight outer sepaloid tepals, approximately 1.5 cm in length, and 6–9 elongated, oval-shaped non-overlapping petaloid tepals. There are 1–2 small leaves below each flower. M. denudata can be distinguished from M. kobus by the presence of 9 tepals, which are similar in size and shape, with no leaves below the flower (Gardiner Citation1989; Callaway Citation1994; Lee Citation2003; KNA 2010; Kim and Kim Citation2011).
Morphology-based identification was additionally confirmed by DNA barcoding. Chloroplast matK gene was amplified by PCR using the primers matK-3f (5′-CGTACAGTACTTTTGTGTTTACGA-3′) and matK-1r (5′-ACCCAGTCCATCTGGAAATCTTGGTTC-3′) (Lee et al. Citation2007). The samples collected for sequencing were ground in liquid nitrogen, and DNA was extracted using an IncloneTM Genomic DNA Plus prep kit (Inclone Biotech Co., Yongin, South Korea) according to the manufacturer’s protocol. The reaction solution used for the PCR analysis (50 μL) comprised 20 ng DNA template, 10 pmol of each primer, 20 mM Tris-HCl (pH 8.0), 100 mM KCl, 2.5 mM MgCl2, 0.2 mM dNTP mix, and 1.25 U Taq DNA polymerase (Inclone Biotech Co., South Korea). PCR amplification was performed by initial denaturation for 5 min at 94 °C; followed by 35 cycles of denaturation for 30 s at 94 °C, annealing for 20 s at 52 °C, and extension for 50 s at 72 °C; and final extension for 5 min at 72 °C. Sequencing of the PCR product was conducted by Bioneer Co. (Daejeon, South Korea) on an ABI Prism 3730xl DNA sequencer (Applied Biosystems, Foster City, CA, USA). The obtained sequence data were analyzed for single-nucleotide polymorphisms (SNPs) after being aligned by ClustalW using multiple alignment software BioEdit v7.2.5 (http://www.mbio.ncsu.edu/BioEdit). The result was displayed as a neighbor-joining phylogenetic tree prepared using the Kimura 2-parameter model in MEGA6 software (Kimura Citation1980; Saitou and Nei Citation1987; Tamura et al. Citation2013). Statistical support for each node of the phylogenetic tree was inferred by bootstrapping with 1,000 replicates (Felsenstein Citation1985). To compare the genetic distance between M. kobus and M. denudata, sequences of other Magnolia species (M. sieboldii, M. liliiflora, M. obovata, and M. grandiflora) were retrieved from GenBank.
Results and discussion
A total of 158 M. kobus individuals were identified (118 from Bukhansan, 25 from Bongjesan, and 15 from Yongwangsan). Samples for DNA analysis were collected from 19 individuals. Sixteen individuals (six from Bukhansan, seven from Bongjesan, and three from Yongwangsan) were sampled from the forest within the survey sites (). Additionally, three individuals (one M. kobus and two M. denudata) used for landscaping were sampled as controls. Consequently, DNA barcoding was performed on 17 M. kobus and two M. denudata individuals ( and ).
Figure 1. Spatial distribution of Magnolia kobus individuals by diameter at breast height (DBH) classes in the study sites.
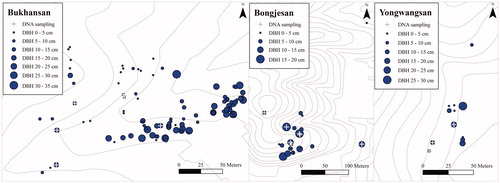
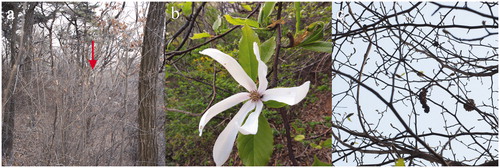
Figure 2. Inflorescence formation and fructification of M. kobus were confirmed in all the survey sites. A M. kobus individual in Bukhansan (a), a flower in Bonjesan (b), and a follicle in Yongwangsan (c).
Species identification
Individuals found in the survey sites with morphologically different sepaloid tepals, small leaves present under the flowers, and flowers that exhibited a degree of petaloid tepals unfolding or development were identified as M. kobus and not M. denudata ( and ).
Figure 3. Outer three sepaloid tepals and small leaves under the flower were confirmed in the case of M. kobus flower (a). M. denudata flower was composed of nine tepals with similar size but there was no leaf (b).
The aligned matrix of the matK sequences, composed of 29 samples from six species, including 10 samples from NCBI GenBank data, was 710 bp long. The mean interspecific genetic distance was 0.004 ± 0.001 (0.003–0.014). There were 15 SNPs identified among the six species of M. kobus (). In the phylogenetic tree, the 17 samples of M. kobus clustered together with the two accessions obtained from the NCBI GenBank database in a clade that received a bootstrap support of 76% (). Two SNPs (C↔T and G↔A) were identified between M. kobus and M. denudata, which allowed distinction of the two species. The genetic distance between the two species was 0.003 ± 0.002, confirming that the two species were genetically closer to each other than to other species ( and ). The species with relatively long genetic distance were M. grandiflora and M. liliiflora (0.014 ± 0.004), which showed a genetic distance of 0.011 ± 0.004 and 0.006 ± 0.003 with M. kobus, respectively. In addition, M. denudata showed a genetic distance of 0.003 ± 0.002 with M. liliiflora and the two formed a monophyletic sister group in the matK-based tree topology ( and ). Consequently, morphology-based identification of all the 17 M. kobus samples was confirmed with molecular data ().
Figure 4. A phylogenetic tree was prepared using the neighbor-joining method. The genetic distances were computed using the Kimura 2-parameter model and bootstrapped with 1000 replicates.
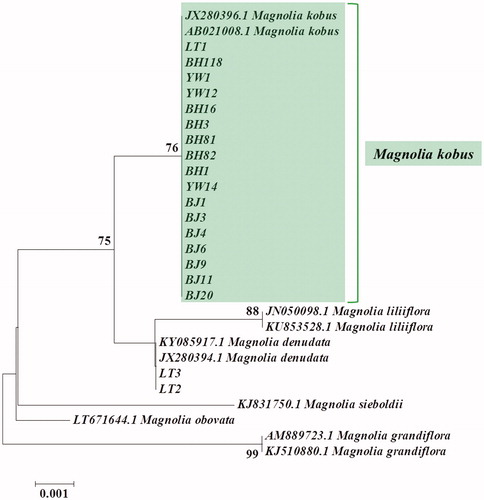
Table 1. Single-nucleotide polymorphisms in the matK region of chloroplast DNA of six Magnolia species.
Table 2. Estimates of genetic divergence between Magnolia species.
Variation in DBH and age
The maximum DBH of M. kobus samples from Bukhansan, Bongjesan, and Yongwangsan was 30.5, 17.6, and 26.0 cm, respectively. The number of individuals in each DBH class decreased with increasing DBH, indicating a negative correlation (r = −0.851, p < .01), which corresponded to an exponential model. Bongjesan and Yongwangsan had small sample sizes, which made it difficult to determine the statistical trend in DBH distribution. However, because the coefficient of determination was higher in the analysis that included all survey sites than in the analysis of individual survey sites, the reverse J-shaped DBH distribution trend was confirmed ( and ). A high seedling rate compared with that of mature trees was detected, suggesting that the next generation continuously emerged as an uneven-aged forest (Khamyong et al. Citation2003; Rasingam and Parathasarathy Citation2009; Clatterbuck et al. Citation2010).
Figure 5. Diameter distribution of M. kobus individuals at the study sites.
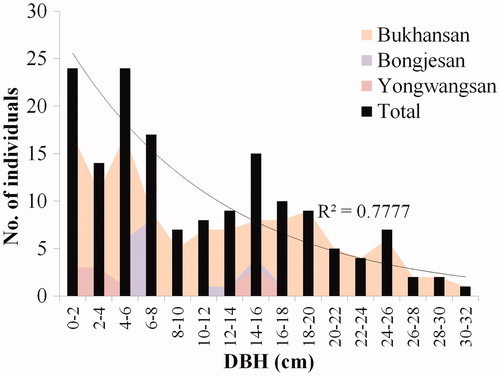
Table 3. Regression analysis of the number of individuals of Magnolia kobus by DBH.
Core extraction was performed on 22 M. kobus trees for age estimation. The samples showed a DBH range of 5.3–30.5 cm and age range of 11–17 years, with both parameters showing normal distribution. DBH and age of M. kobus samples showed a positive correlation (r = 0.790, p < .01), which provides evidence that the distribution of individuals with varying DBH classes was indicative of an uneven-aged forest with the coexistence of trees from different generations. Because the exponential model was the most suitable for the regression between DBH and age and for calculating the age using the appropriate equation, it could be inferred that different generations were present ( and ). Moreover, because young flowering plants or seedlings often occurred singly deep within forests with no human disturbance, it can be inferred that natural breeding and establishment of M. kobus is taking place.
Figure 6. Relationship between DBH and age of M. kobus individuals. Power regression model is the most appropriate.
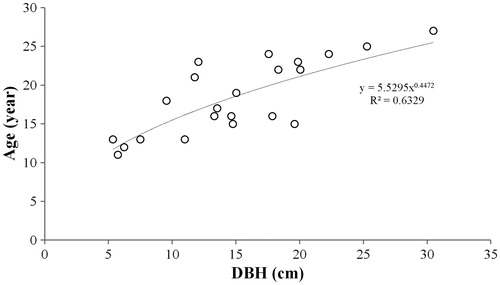
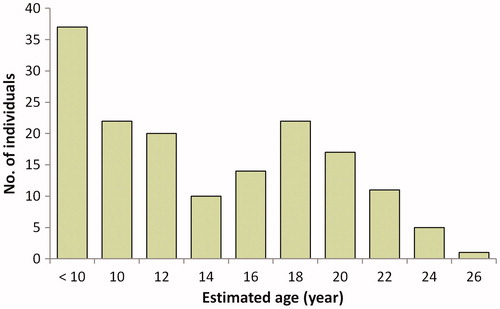
Figure 7. Estimation of age distribution of the individuals using the regression equation. The saplings shorter breast height were included in the class “less than 10 cm”.
Although it is confirmed that M. kobus individuals are forming populations, the development of populations was not characterized by a high number of seedlings. Therefore, it would be difficult to claim that the M. kobus populations within the survey sites had a rapid developmental rate. These findings were slightly different from those of other studies on magnolia species such as M. obovata (Kwon and Oh Citation2015), in which it is suspected that the appearance of M. kobus was less frequent than that of M. obovata in natural forests, and that the relatively slower growth rate of the former may be a contributing factor (Gardiner Citation1989; Shin and Shibuya Citation2007; Khela Citation2014; Lohr and Hummel Citation2014). In addition, seedling emergences were not limited to forest edges, and long-distance migration owing to dispersal by animals was assumed. In the Bongjesan survey site (), an individual was found approximately 260 m northeast of the population center. Therefore, M. kobus might have infiltrated different forests, starting from the planting sites, and is spreading over a wide area at a relatively slow rate.
Inflorescence formation and fructification
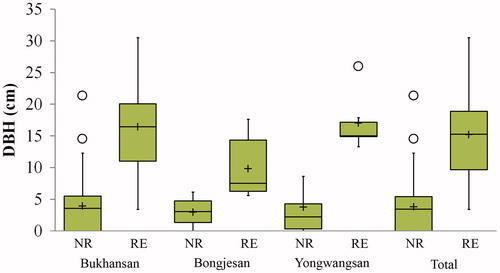
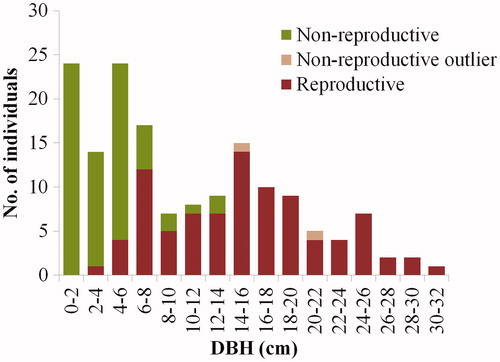
Flowers and fruits of M. kobus were found in all the survey sites, and individuals with small DBH that did not reach inflorescence formation and fructification stages coexisted, which suggested the presence of overlapping generations of trees. Among the samples surveyed, 68 individuals (43.0%) did not reach the flowering or fructification stages, and they had a mean DBH of 3.8 cm (standard deviation [SD] = 3.98). Flowering or fructification was confirmed in 90 individuals (57.0%), which had a mean DBH of 15.2 cm (SD = 6.61). Among these individuals, the individual with the lowest DBH showed a value of 3.4 cm. The age of this individual was difficult to determine by core extraction. Consequently, the regression equation was used to estimate its age, which was approximately 10 years. Such finding was consistent with the minimum flowering age of M. kobus (Gardiner Citation1989; Callaway Citation1994). Two individuals from Bukhansan that had no flowers and fruits had DBH values of 14.5 and 21.3 cm, which represented extreme values on the box-plot graph (). Therefore, these two individuals may have been unable to flower and produce fruits owing to the effects of alternate year or lighting conditions, rather than due to immaturity or infertility. Among the individuals from Yongwangsan with confirmed flowering and fructification, one individual with a DBH of 26 cm represented an extreme value, although it was within the extreme values in the analysis of all the survey sites combined ().
Figure 8. Box-plot with a maximum of 1.5 times of the interquartile range (IQR), representing DBH distribution of plants in which inflorescence formation or fructification was confirmed, or was not confirmed. Solid line and cross sign within the box indicate the median and the mean value, respectively. Open circle represents outliers. NR: non-reproductive; RE: reproductive.
Small DBH was correlated with a low percentage of M. kobus individuals with confirmed flowering and fructification. Starting from a DBH of 3.1 cm, the percentage of individuals with confirmed flowering and fructification increased and showed a positive correlation with DBH size-class (r = 0.906, p < .01). If individuals that achieved flowering and fructification are considered adult trees, it can be inferred that the current M. kobus population is expanding to allow young individuals to grow and develop into adult individuals capable of producing the next generation of individuals ().
Figure 9. Proportion of reproductive individuals in each DBH class.
Difference in population size
The population size at site Bukhansan was particularly large compared with those at the other sites and there are three possible causes for this based on propagule pressure (Simberloff Citation2009; Lockwood et al. Citation2013). First, the populations differ in age. The maximum age of M. kobus individuals from Bukhansan, Bongjesan, and Yongwangsan was 27, 20, and 21 years, respectively. It is possible that the individuals at Bukhansan had a relatively long reproduction period, although the ability to judge reproduction period from tree age is limited because generally mature trees, and not seeds, are used for landscaping. Establishment time for the M. kobus individuals at Bukhansan may have been 6–7 years longer than for those at other sites. Second, although M. kobus individuals can adapt to a variety of soil types, they prefer moist, well-drained soil and do not thrive in dry soil. The physical environment of the study sites differs, as Bukhansan is in a valley, Bongjesan is on a ridge, and Yongwangsan is on a slope. Although the trees have survived at each site for more than a decade, it appears that the moisture-retentive and humus-rich conditions at Bukhansan were more beneficial for population formation. Third, the number of M. kobus individuals artificially planted at each study site seems to be different, although it is difficult to confirm the accurate numbers as no planting plans are available. It is however, possible to estimate the numbers from the uniform planting patterns such as row-planting. It was assumed that the individuals that were planted at regular intervals along the banks or the forest trails had been introduced; this accounts for more than 20 individuals at Bukhansan, 7 individuals at Bongjesan, and 6 individuals at Yongwangsan.
Conclusions
While there were differences in the number of individuals and distribution area between the survey sites, the findings in the study confirmed that M. kobus individuals are establishing naturally and forming populations in the forests of mainland Korea. Although M. kobus individuals have a slow population development rate, they are capable of gradually settling into urban forests near the sites where this species was planted. Therefore, M. kobus individuals should be subjected to follow-up monitoring after their initial introduction.
Disclosure statement
No potential conflict of interest was reported by the authors.
References
- Byun JG, Jang JW, Yang JC, Lee YM, Jung SY, Ji SJ, Jang J, Lee HJ, Hwang HS, Oh SH. 2013. The flora of vascular plants in Mt. Gariwang Protected Area for forest genetic resource conservation, South Korea. Kor J Plant Resources. 26(5):566–588.
- Callaway DJ. 1994. The world of magnolias. Portland (OR): Timber Press.
- Clatterbuck WK, Stringer JW, Tankersley L. 2010. PB1798 Uneven-age management in mixed species, southern hardwoods: is it feasible and sustainable? Knoxville (TN): University of Tennessee Extension, Institute of Agriculture. p. 16.
- Colautti RI, MacIsaac HJ. 2004. A neutral terminology to define ‘invasive’ species. Divers Distrib. 10(2):135–141.
- Cousins SR, Witkowski ETF, Pfab MF. 2014. Elucidating patterns in the population size structure and density of Aloe plicatilis, a tree aloe endemic to the Cape fynbos, South Africa. S Afr J Bot. 90:20–36.
- Dogra KS, Sood SK, Dobhal PK, Sharma S. 2010. Alien plant invasion and their impact on indigenous species diversity at global scale: a review. J Ecol Natural Env. 2:175–186.
- Felsenstein J. 1985. Confidence limits on phylogenies: an approach using the bootstrap. Evolution. 39(4):783–791.
- Gardiner JM. 1989. Magnolias. Chester (CT): The Globe Pequot Press.
- Heger T, et al. 2001. A model for interpreting the process of invasion: crucial situations favouring special characteristics of invasive species. In: Brundu G, editor. Plant invasions: species ecology and ecosystem management. Leiden (The Netherlands): Backhuys Publishers. p. 3–10.
- Jung SY, Lee JW, Kwon YH, Shin HT, Kim SJ, An JB, Heo TI. 2016. Invasion alien plants in South Korea. Seoul: Sumengil Press.
- Kang JS, Han JS, Cheon KS, Kim KA, Park YH, Yoo KO. 2015. Floristic study of Mt. Hanseok (Inje-gun, Gangwon-do). Korean J Pl Taxon. 45(1):45–71.
- Khamyong S, Lykke AM, Seramethakun D, Barfod AS. 2003. Species composition and vegetation structure of an upper montane forest at the summit of Mt. Doi Inthanon, Thailand. Nordic J Bot. 23(1):83–97.
- Khela S. 2014. Magnolia kobus. The IUCN red list of threatened species 2014:e.T193954A2292097. http://dx.doi.org/10.2305/IUCN.UK.2014-1.RLTS.T193954A2292097.en
- Kim JS, Kim TY. 2011. Woody plants of Korean Peninsula. Gyeonggi-do: Dolbegae.
- Kimura M. 1980. A simple method for estimating evolutionary rates of base substitutions through comparative studies of nucleotide sequences. J Mol Evol. 16(2):111–120.
- Korea National Arboretum (KNA). 2010. A field guide to trees & shrubs. Seoul: Geobook.
- Kwon OJ, Oh CH. 2015. Naturalization of landscaping woody plant, Magnolia obovata potentially invasive species. J Mt Sci. 12(1):30–38.
- Lee CB. 2003. Coloured flora of Korea. Seoul: Hyangmunsa.
- Lee HI, Yi DK, Kim JS, Kim KJ. 2007. Development of plant DNA barcoding markers from the variable noncoding regions of chloroplast genome. Abstract presented at: the Second International Barcode of Life Conference; Sept 18–20; Taipei, Taiwan.
- Lee ST, Chang KS. 2015. English names for Korean native plants. Gyeonggi-do: Korea National Arboretum.
- Lockwood JL, Hoopes MF, Marchetti MP. 2013. Invasion ecology. 2nd ed. West Sussex: Wiley Blackwell.
- Lohr VI, Hummel RL. 2014. Trees and shrubs for streambank landscapes in western Washington. Washington: Washington State Univ. Available from: https://public.wsu.edu/∼lohr/StreamsideLandscapes/
- Magnolia Society International. 2017. Magnolia cultivars checklist. New York (NY): Magnolia Society International. Available from: http://www.magnoliasociety.org/
- National Institute of Biological Resources (NIBR). 2012. Red data book of endangered vascular plants in Korea. Seoul: Econature.
- Nelson G. 2008. America’s magnolias. Am Gardener. 87:38–43.
- Park HS, Kim WB, Oh HS. 1997. A study on the environmental adaptation of immigrated the magpie Pica pica sericea, on Cheju Island. Kor J Ornithol. 4:17–25.
- Radosevich SR, Stubbs MM, Ghersa CM. 2003. Plant invasions processes and patterns. Weed Sci. 51(2):254–259.
- Rasingam L, Parathasarathy N. 2009. Tree species diversity and population structure across major forest formations and disturbance categories in Little Andaman Island, India. Trop Ecol. 50:89–102.
- Richardson DM, Pysek P, Rejmanek M, Barbour MG, Panetta FD, West CJ. 2000. Naturalization and invasion of alien plants: concepts and definitions. Divers Distrib. 6:93–107.
- Royal Horticultural Society. 2018. Magnolia kobus. Royal Horticultural Society. [accessed 11 May 2018]. https://www.rhs.org.uk/Plants/10702/i-Magnolia-kobus-i/Details.
- Saitou N, Nei M. 1987. The neighbor-joining method: a new method for reconstructing phylogenetic trees. Mol Biol Evol. 4(4):406–425.
- Sargent CS. 1894. Forest flora of Japan. Cambridge (MA): Riverside Press.
- Shin CS, Shibuya M. 2007. Spatial variation in tree seedling density after the site preparation for planting in a cleared coniferous plantation in Hokkaido, northern Japan. J for Res. 12(1):57–62.
- Simberloff D. 2009. The role of propagule pressure in biological invasions. Annu Rev Ecol Evol Syst. 40(1):81–102.
- Tamura K, Stecher G, Peterson D, Filipski A, Kumar S. 2013. MEGA6: molecular evolutionary genetics analysis version 6.0. Mol Biol Evol. 30(12):2725–2729.
- Theoharides KA, Dukes JS. 2007. Plant invasion across space and time: factors affecting nonindigenous species success during four stages of invasion. New Phytol. 176(2):256–273.
- Williams PA. 1997. Ecology and management of invasive weeds. Conservation Sciences Publication No. 7. Wellington: Department of Conservation. p. 67.
- Williams PA. 2003. Guidelines for weed-risk assessment in developing countries. Food and Agriculture Organization of the United Nations. Available from: http://www.fao.org/docrep/006/y5031e/y5031e05.htm/