
 ?Mathematical formulae have been encoded as MathML and are displayed in this HTML version using MathJax in order to improve their display. Uncheck the box to turn MathJax off. This feature requires Javascript. Click on a formula to zoom.
Abstract
Climate change influences spreading and occurrence of forest fire. Forest fire modeling is one of the most important tasks to fight forest fires. Climate data of current (1980–2010) was projected to near (2010–2039), mid (2040–2069) and end-term (2070–2099) using Representative Concentration Pathway (RCP4.5 and 8.5) of an ensemble of twenty General Circulation Models using R-software. Current and projected climate data were used to determine the impact of climate change on current and future forest fire using Keetch-Byram Drought Index. Current and future forest fire-vulnerable areas were mapped and weighed using Inverse Distance Weighting. The result indicates that, while no forest fire occurrence in the current, there might be a high forest fire risk in near-term. It might be become very high in mid and end-term. The size of forest fire-vulnerable areas might be increased to 12.85, 18.8, 17.1 and 46.26% in Mid-RCP4.5, Mid-RCP8.5, End-RCP4.5 and End-term-RCP8.5 respectively. Fire may occurred in winter and spring seasons. The risk might be move to higher elevation of the forest. This directs increase of forest fire occurrence and spread due to climate change. The study recommends that forest fire management should be applied before fire happened to sustain the forest and its products.
1. Introduction
Forest fire is a disaster that destroys forest and wildlife (Jaiswal et al. Citation2002; Böhm et al. Citation2011). Climate, weather conditions and topography influence the fire regime by determining the fuel distribution and the occurrence of fire (Rollins et al. Citation2002; Liu et al. Citation2012). Climatic factors such as wind, temperature and drought influences incidence and spread of forest fires (Kutiel et al. Citation2001; Türkeş Citation2003) and there is strong linkage between drought and forest fire (Camia and Amatulli Citation2009). Reduced crop and forest productivity, increased fire hazard, reduced water levels, and damage to wildlife are a few examples of drought’s direct impacts (Wilhite et al. Citation2007). Drought increases the probability of forest fire occurrence through drying of the plants and decreasing of soil moisture (Beverly and Martell Citation2005; Duffy et al. Citation2005). Prolonged drought and strong wind speed (Ganteaume et al. Citation2013) with high temperature and low rainfall (Petritsch and Hasenauer, Citation2014) creates natural forest fire. It is commonly occurred due to prolonged drought occurrence (Ganteaume et al. Citation2013; San-Miguel-Ayanz et al. Citation2013).
Forest fires are happening by weather conditions (Liu et al. Citation2010). Meteorological conditions and fire occurrence have strong relationship (Piñol et al. Citation1998). It has largest contribution and effect on fire ignition and spread when compared with factors like elevation. As a result, a variety of meteorological forest fire risk indices and, more specifically, drought indices have been developed to monitor forest fire (San-Miguel-Ayanz et al. Citation2013). Forest fire modeling is one of the most important tasks to fight forest fire destruction. Accurate forest fire modeling to expect fire spreading is one of the most important tasks to fight forest fires.
Direct measurements of forest biomass moisture and fuel are slow and time consuming. To reduce those problems forest fire modeling is better to simulate with fuel and soil moisture content in relation to meteorological factors (Keetch and Byram Citation1968; Gillett et al. Citation2004). With the aim of determining the risk areas of natural forest fires, remote sensing and Geographic Information Systems (Pradhan et al. Citation2007; Pourghasemi et al. Citation2016; Pourtaghi et al. Citation2015) and meteorological data can be used simply (Gillett et al. Citation2004). Modeling forest fire vulnerability based on meteorological data is more significant (Pyne et al. Citation1996; Gillett et al. Citation2004). During the last decades, various techniques have been employed to assess the forest fire risk. The Keetch-Byram Drought Index (KBDI) (Keetch and Byram Citation1968) is fire potential index which is widely used in the United States where it is a part of the National Fire Danger Rating System (Liu et al., Citation2013). Keetch-Byram Drought Index (Keetch and Byram Citation1968) is a software used to estimate forest fire based on meteorological data and is one of the most commonly used method for this purpose (Janis et al. Citation2002; Pötzelsberger and Hasenauer Citation2015).
Keetch-Byram Drought Index (KBDI) is a widely used drought index intended for wildfire monitoring (Heim Jr Citation2002; Ganatsas et al. Citation2011). It has become the most worldwide used index in wildfire monitoring and prediction, mainly due to its easy implementation compared to other indices which normally need more meteorological data and complicated calculations (Heim Jr Citation2002; Ganatsas et al. Citation2011). KBDI is still considered a robust indicator of wildfire risk (Arpaci et al. Citation2013). KBDI is designed for wildfire monitoring and prediction (Janis et al. Citation2002). KBDI estimates forest fire risk through estimating the dryness of soil and duff layers (Keetch and Byram Citation1968). KBDI has primarily been used for forest fire management and planning operations (Dolling et al. Citation2005). KBDI is also used to monitor agricultural drought (Salehnia et al. Citation2018). The main purpose of this paper is to investigate the impact of climate change on the forest fire occurrence using Keetch-Byram Drought Index (KBDI) and Arc GIS in Desa’a forest in order to recommend different forest management practices to sustain the forest.
2. Methodology
2.1. Study area
Desa’a protected forest lies between 13°20′ and 14°10′ North and 39°32′ and 39°55′ East. It incorporates lowland, midland and highland altitudes (). It is part of the northeastern highlands of Ethiopia, positioned at a strategic site in northeastern Tigray and northwestern Afar, well placed for joint regional planning and its tributaries flow towards the Afar plains (). According to Gebreegziabher (Citation1999) considerable part of the forest area falls within Tigray Region.
Figure 1. Study area (A-specific location of Desa’a forest in Ethiopia, B-Desa’a forest in relation with Berahle and Astbi district, C- elevation classes of Desa’a forest).
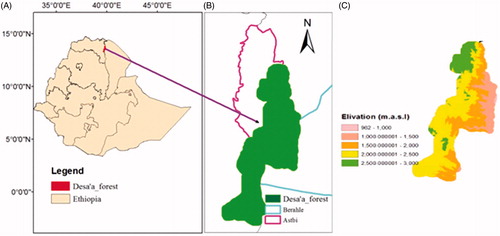
Friis (Citation1992) and AYnekulu et al (Citation2011) broadly classified the natural vegetation of Desa’a as “dry evergreen Afromontane forest” with Juniperus procera and Olea europaea subsp. cuspidata as the dominant species (Friis Citation1992; Aynekulu et al. Citation2011). The area is characterized by minimum and maximum mean temperatures that vary in the range of 9.3 to 14 °C and 22.4 to 27.6 °C, respectively. modestly explains that the forest area possess the characteristic of different elevations.
2.2. Methods
2.2.1. Climate input datasets
Two daily climatic variables namely; maximum temperature and rainfall were used for this study. Maximum temperature was obtained from ENACTS (Enhancing climate information services TAMSAT) satellite while gauge blended data and rainfall were obtained from CHRIPS daily rainfall data. CHIRPS data are with spatial resolution of 0.05 degree (5 Km) and temporal resolution of 5 days accumulation. Enhancing National Climate Services (ENACTS), aims to support decision makers in climate-sensitive sectors by filling spatial and temporal gaps in existing climate observations and providing an array of derived products. ENACTS and CHRIPS climate data sources are important because they are produced by interpolation of meteorological and satellite data. The data were obtained/computed from 1981 to 2016 records. Those climate data were used to fill missing values of national meteorological station using regression and normal ratio methods. The obtained current data were projected to near (2010–2039), mid (2040–2069) and end term (2070–2099) using R-programing language under ensemble twenty General Circulation Models (GCMs) in two emission scenarios called Representative Concentration Pathways (RCP) 4.5 and 8.5, RCP 4.5 and 8.5, which describes both medium and high emission scenarios. R.matlab and R.utils packages were load into the R-programing language to project the climate data. The time slices were defined the interval of thirty years. While whereas ensemble GCM method was used to reduce model uncertainty due to the structural dissimilarities among GCMs (Semenov and Stratonovitch Citation2010). Recently, there is a growing agreement in considering the climate impact study by an ensemble of GCMs (Aung et al. Citation2016). The simulation of climate from a single GCM is insufficient to provide the appropriate information (Jacob et al. Citation2007). Ideally, by using the average of an ensemble of GCMs, the individual model errors are cancelled out and the ensemble uncertainty decreases as increasingly more models are used (Weiland et al. Citation2012). Accordingly, this study used all twenty GCMs loaded data in the programing language in order to reduce the uncertainty of GCMs.
2.2.2. Keetch-Byram drought index (KBDI)
The KBDI was developed by the United States Department of Agriculture’s Forest Service for forested and wild land areas of the south-eastern United States. Over the years/decades it has also been applied to many other regions of the world in land-cover types (Dharssi et al. Citation2017). In the Australian states of Victoria KBDI was deployed for forest fire prediction (Finkele et al. Citation2006). Moreover, it was employed to study wildfire occurrence in the upper mid-west of United States. (Lorimer and Gough Citation1988), Mediterranean regions (Ganatsas et al. Citation2011; Garcia-Prats et al. Citation2015), Hawaii (Dolling et al. Citation2009), Malaysia (Ainuddin and Ampun Citation2008), Lebanon (Bayissa et al. Citation2018) and to assess the impact of climate change on global wildfire potentials (Liu et al. Citation2010).
The use of KBDI in a wide range of geographical areas implies that the index is considered as an acceptable application. Basically it also concentrates on changes occurring in the soil moisture as a result of evapotranspiration in the ecosystem (Janis et al. Citation2002). It was available at: https://agrimetsoft.com/kbdis.aspx.
Keetch-Byram Drought Index (KBDI) was used to determine forest fire risk area and forest fire risk period based on daily climate conditions. Forest fire risk area and forest fire risk period were calculated using baseline and projected maximum temperature and precipitation data. The model takes maximum temperature and precipitation. The climate data used to estimate forest fire were taken from the lowland (Berahle district) and highland (Astibi district) part of the forest. KBDI of the two elevation classes were calculated. Then, forest fire risk area of the two points was interpolated to the whole forest area using the Inverse Distance Weighting (IDW), a method that uses for interpolation (Janis et al. Citation2002; Cao et al. Citation2010). The interpolation method was applied due to the presence of low meteorological station around the forest.
The Inverse Distance Weighting method was applied to the index results by using the Arc GIS software. It estimates the value of a variable for new location using interpolation of values obtained from known locations. It combines calculated KBDI values with gridded Digital Elevation Model of the study area in order to interpolate KBDI values. Therefore, in this study the IDW method was used to map fire vulnerable area while the Keetch-Byram Drought Index (Keetch and Byram Citation1968) was used to determine forest fire risk.
From current and projected daily maximum temperatures and rainfalls, Keetch-Byram Drought Index (KBDI) software produces and uses daily maximum temperature, daily rainfall, cumulative antecedent moisture deficiency, annual average precipitation, and evapotranspiration and soil moisture. The depth of soil in which major part of root penetrates and absorbs water and nutrient, was assumed 20 cm (Salehnia et al. Citation2018). Accordingly, the theory and framework of KBDI is based on different assumptions. The first assumption is that, the rate of soil moisture loss depends on density of the vegetation cover, antecedent moisture conditions, annual rainfall and evapotranspiration. The second assumption is that the field capacity of soil is 8 inches of available water. This number suites reasonably well for use in forest fire control (Keetch and Byram Citation1968). The amount of water lost in a forested area was calculated using the following mathematical expression:
(1)
(1)
The equation can be transformed easily and can be written as follows:
(2)
(2)
Where dQ is a drought factor or soil water depletion (in mm) during a period of time dt, Q is the accumulated soil water depletion (in mm); T is daily maximum temperature (in °C); R is mean annual rainfall (in mm); 203.2 is the field capacity of soil expressed in mm (203.2 mm = 800 hundredths inches) (Keetch and Byram Citation1968). 220 In Equationequation (2)(2)
(2) , potential evapotranspiration (ETP) is estimated on a daily basis as the ratio of an exponential function of the daily maximum temperature (T), divided by an exponential function of the mean annual rainfall (R):
(3)
(3)
Finally, potential evapotranspiration is converted to actual evapotranspiration as a linear function of soil water depletion, i.e., ETP is reduced as soil dries as described by Equationequation (4)(4)
(4) :
(4)
(4)
The obtained KBDI values were categorized to determine different levels of fire risk in order to interpret easily and clarify discussion on drought. In view of that, it is categorized as a . shows the severity of forest fire.
Table 1. KBDI fire risk levels.
3. Result
3.1. Forest fire risk period
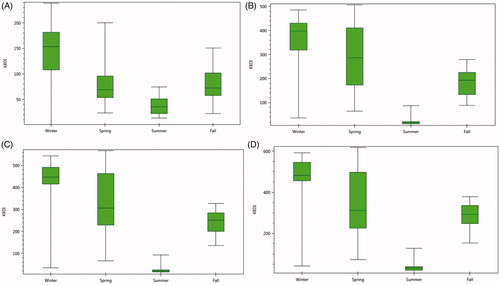
The intensity of current and future forest fire using KBDI in Desa’a forest is 145, 383, 367, 425, 437, 433 and 476 in current, near term RCP 4.5, near term RCP 8.5, midterm RCP 4.5, midterm RCP 8.5, end term RCP 4.5 and end term RCP 8.5, respectively. This means, in current (at present) there is low forest fire occurrence. In near term there may be high probability of forest fire occurrence in the lowland part. However, in the medium and high emission scenario of mid and end term, there may be very high forest fire occurrence. In addition, the risk is higher in winter than spring, fall and summer in all scenarios and time slices. Besides, there may be an occurrence of moderate to high forest fire in spring ( and ). It is observed that the KBDI values are lowest during summer and fall, while reach the maximum level in winter and spring. The probability of fire risk increases when both time slices and emission scenario (which emission scenario) increases. This indicated that the forest soil moisture will be affected due to climate change and the plants will become a good source of fuel for fire occurrence. Nevertheless, there might not be extremely high fire occurrence in all time slices and emission scenarios. and shows the occurrence of fire in summer (June, July and August), winter (December, January and February), and spring (March, April, and May) and fall (September, October, and November) temporally.
Figure 2. Forest fire risk seasons in medium emission scenario A) current B) near term C) midterm D) end term.
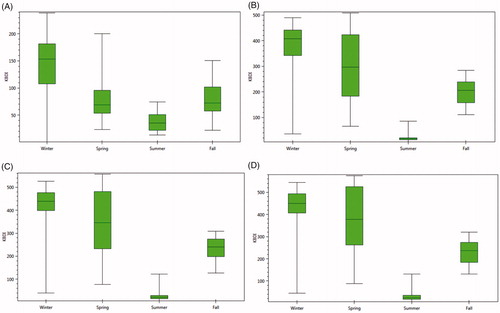
Figure 3. Forest fire risk seasons in high emission scenario A) current B) near term C) midterm D) end term.
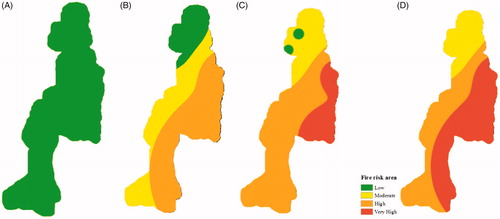
3.2. Forest fire risk area
Currently, there is no wildfire risky area in the forest. However, there might be high wildfire vulnerable area in near term of both representative concentration pathways. In current and near term there is simply low to high forest fire risky area. However, there might be very high forest fire vulnerable area in mid and end term of the century. High and very high forest fire vulnerable area may increase from zero to 12.85, 18.8, 17.1 and 46.26% in Mid RCP 4.5, Mid RCP 8.5, End RCP 4.5 and End term-RCP 8.5 of the century, respectively ( and ). and shows the occurrence of fire in summer, winter, and spring and fall spatially and temporally.
Figure 4. Forest fire risk area in medium emission scenario A) current B) Near C) Mid D) End term (green, yellow, gold and red color shows low, moderate, high and very high forest fire risk respectively).
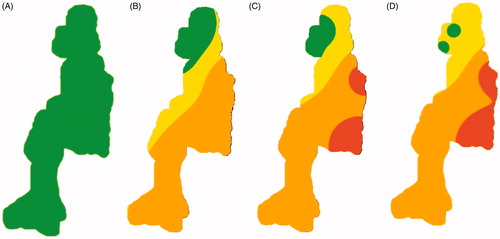
Figure 5. Forest fire risk area in high emission scenario A) current B) Near C) Mid D) End term.
There might be only low to medium forest fire occurrence in highland part of the forest due to low temperature and high rainfall. However, in lowland part of the Desa’a forest there might be source of ignition to wildfire because there is/might be high temperature and low rainfall. Additionally, there might be no very high severity of fire in current and near term. However, it might occur in mid and end term, and shifts to high elevation areas due to climate change. High fire occurrence has similar trend with very high altitudinal shift (). Therefore, climate change might cause altitudinal shift of forest fire occurrence.
Table 2. Attitudinal shift of forest fire occurrence.
Unlike Ethiopia, the risk of forest fire is particularly high in Mediterranean ecosystems during dry summer (Gülşen and Sönmez Citation2016). In addition, an increase in risk of summer droughts is likely to take place in Southern Europe (Giannakopoulos et al. Citation2009). However, to the contrary winter and spring seasons are dry seasons in Ethiopia where forest fire is high. Apart from the risk that comes from the dry seasons manmade forest fire is existential threat to the forest. According various studies about five forest fires had occurred in the years between 1958 and 1998. Of all the incidences, the 1970 and 1998 fire had destroyed about 1000 and 350 ha respectively. Human induced factors were mentioned as the main causes the fire to occur in the forest (Gebreegziabher Citation1999). Nonetheless, there were forest fires in other parts of Ethiopia triggered by drought (Dechassa and Perault Citation2001). On the other hand the entire forest land in Kutcha Woreda, South Ethiopia burns every year during dry seasons (Mengistu Citation1994). Hence, in the future climate change will influence to increase, forest fire occurrence.
The result showed that forest might be exposed to wildfire. Similar studies conducted by Flannigan et al. (2009) and Anderson et al. (Citation2000) indicate that the world forests will be vulnerable to wildfire due to climate change. Flannigan et al. (Citation2009) study furher validates that in circumboreal forest wildfire is projected to increase by 18% and 50% in near and end term of the century respectively). A separate study by Liu et al., (Citation2010) reveals that future wildfire potential may increase significantly in the United States, South America, central Asia, southern Europe, southern Africa, and Australia. The study further noted that in the globe fire potential category might increase by one level, from low to moderate potential or from moderate to high potential
4. Conclusion
This study finds out that there is a potential wildfire occurrence due to climate change impact. The study further demonstrates that forest fire risk might be lowest during summer and fall but it can reach the maximum level during winter and spring seasons. It also signals that the probability of fire risk increases when both time slices and emission scenario increases. Notably the lowland part of the forest is more vulnerable to wildfire ignition than other part located in the high land due it vicinity to zone of great East African Rift Valley which minor eruptions and volcanic shocks are common. Apart other factors that aggravate forest fire to occur in the lowland part of the forest, forest density is treated as one and it increases from low to high elevation. Nevertheless, there might be no extremely forest fire in all time slices and emission scenarios.
Hence, the study recommends that sustainable forest fire management practices such as firebreak construction should be applied to control the fire. In addition to meteorological fire occurrence, the forest is close to volcanic eruption heat; therefore, the forest should be managed in a sustainable way. And further study should be conducted including other factors such as topography, elevations, slope, wind, vegetation, soil moisture and forest density, plant species type in order to develop more robust findings to protect the forest and wildlife.
Disclosure statement
No potential conflict of interest was reported by the authors.
References
- Ainuddin N, Ampun J. 2008. Temporal analysis of the keetch-byram drought index in Malaysia: implications for forest fire management. J Appl Sci. 8(21):3991–3994.
- Anderson K, Martell DL, Flannigan MD, Wang D. 2000. Modeling of fire occurrence in the boreal forest region of Canada. Fire, climate change, and carbon cycling in the boreal forest. Springer.
- Arpaci A, Eastaugh CS, Vacik H. 2013. Selecting the best performing fire weather indices for Austrian ecoregions. Theor Appl Climatol. 114(3–4):393–406.
- Aung M, Shrestha S, Weesakul S, Shrestha P. 2016. Multi-model climate change projections for Belu River Basin, Myanmar under representative concentration pathways. J Earth Sci Clim Change. 7, L323.
- Aynekulu E, Denich M, Tsegaye D, Aerts R, Neuwirth B, Boehmer H. 2011. Dieback affects forest structure in a dry Afromontane forest in northern Ethiopia. J Arid Environ. 75(5):499–503.
- Bayissa Y, Maskey S, Tadesse T, van Andel SJ, Moges S, van Griensven A, Solomatine D. 2018. Comparison of the performance of six drought índices in characterizing historical drought for the Upper Blue Nile Basin, Ethiopia. Geosciences. 8(3):81.
- Beverly JL, Martell DL. 2005. Characterizing extreme fire and weather events in the Boreal Shield ecozone of Ontario. Agric For Meteorol. 133(1–4):5–16.
- Böhm C, Quinkenstein A, Freese D. 2011. Yield prediction of young black locust (Robinia pseudoacacia L.) plantations for woody biomass production using allometric relations. Ann For Res. 54:215–227.
- Camia A, Amatulli G. 2009. Weather factors and fire danger in the Mediterranean. Earth observation of wildland fires in Mediterranean ecosystems (pp. 71–82). Berlin, Heidelberg: Springer.
- Cao Z, Haklay M, Cheng T. 2010. IDW implementation in Map Calculus and commercial GIS products. Accuracy 2010-Proceedings of the 9th International Symposium on Spatial Accuracy Assessment in Natural Resources and Environmental Sciences; 141–144.
- Dechassa L,D, Perault M. 2001. Forest fires in Ethiopia: reflections on socio-economic and environmental effects of the fires in 2000. Addis Ababa (Ethiopia): UNDP Emergencies Unit for Ethiopia and Brown University.
- Dharssi I, Bally J, Steinle P, McJannet D, Walker J. 2017. Comparison of soil wetness from multiple models over Australia with observations. Water Resour Res. 53:633–646.
- Dolling K, Chu P-S, Fujioka F. 2005. A climatological study of the Keetch/Byram drought index and fire activity in the Hawaiian Islands. Agric For Meteorol. 133(1–4):17–27.
- Dolling K, Chu P-S, Fujioka F. 2009. Natural variability of the Keetch–Byram drought index in the Hawaiian Islands. Int J Wildland Fire. 18(4):459–475.
- Duffy PA, Walsh JE, Graham JM, Mann DH, Rupp TS. 2005. Impacts of large‐scale atmospheric–ocean variability on Alaskan fire season severity. Ecol Appl. 15(4):1317–1330.
- Finkele K, Mills GA, Beard G, Jones DA. 2006. National gridded drought factors and comparison of two soil moisture deficit formulations used in prediction of Forest Fire Danger Index in Australia. Aust Meteorol Mag. 55:183–197.
- Flannigan M, Stocks B, Turetsky M, Wotton M. 2009. Impacts of climate change on fire activity and fire management in the circumboreal forest. Glob Chang Biol. 15(3):549–560.
- Friis I. 1992. Forests and forest trees of northeast tropical Africa: their natural habitats and distribution patterns in Ethiopia, Djibouti and Somalia. HMSO.
- Ganatsas P, Antonis M, Marianthi T. 2011. Development of an adapted empirical drought index to the Mediterranean conditions for use in forestry. Agric For Meteorol. 151(2):241–250.
- Ganteaume A, Camia A, Jappiot M, San-Miguel-Ayanz J, Long-Fournel M, Lampin C. 2013. A review of the main driving factors of forest fire ignition over Europe. Environ Manage. 51(3):651–662.
- Garcia-Prats A, Antonio DC, Tarcísio FJG, Antonio MJ. 2015. Development of a Keetch and Byram—based drought index sensitive to forest management in Mediterranean conditions. Agric For Meteorol. 205:40–50.
- Gebreegziabher Z. 1999. Dessa’a protected area: an assessment of human impact, evolutionary pattern and options for sustainable management. Mekelle, Ethiopia Personal Interview M. 5,15–64.
- Giannakopoulos C, Le Sager P, Bindi M, Moriondo M, Kostopoulou E, Goodess C. 2009. Climatic changes and associated impacts in the Mediterranean resulting from a 2 C global warming. Glob Planet Change. 68(3):209–224.
- Gillett N, Weaver A, Zwiers F, Flannigan M. 2004. Detecting the effect of climate change on Canadian forest fires. Geophys Res Lett. 31(18):1–4
- Gülşen K, Sönmez ME. 2016. Determination of Meteorological Forest Fire Risks in Mediterranean Climate of Turkey. Ksü Doğ Bil Derg. 19:181–192.
- Heim RR. Jr, 2002. A review of twentieth-century drought indices used in the United States. Bull Am Meteorol Soc. 83(8):1149–1165.
- Jacob D, Bärring L, Christensen OB, Christensen JH, de Castro M, Déqué M, Giorgi F, Hagemann S, Hirschi M, Jones R, et al. 2007. An inter-comparison of regional climate models for Europe: model performance in present-day climate. Clim Change. 81(S1):31–52.
- Jaiswal RK, Mukherjee S, Raju KD, Saxena R. 2002. Forest fire risk zone mapping from satellite imagery and GIS. Int J Appl Earth Obs Geoinf. 4(1):1–10.
- Janis MJ, Johnson MB, Forthun G. 2002. Near-real time mapping of Keetch-Byram drought index in the south-eastern United States. Int J Wildland Fire. 11(4):281–289.
- Keetch JJ, Byram GM. 1968. A drought index for forest fire control. Res. Pap. SE-38, Vol. 35. Asheville (NC): US Department of Agriculture, Forest Service, Southeastern Forest Experiment Station. p. 38.
- Kutiel H, Hirsch-Eshkol T, Türkeş M. 2001. Sea level pressure patterns associated with dry or wet monthly rainfall conditions in Turkey. Theor ApplClimatol. 69(1–2):39–67.
- Liu, Y, L. Goodrick, S, A. Stanturf, J. 2013. Future U.S. wildfire potential trends projected using a dynamically downscaled climate change scenario. Forest Ecology and Management. 294:120–135. doi:10.1016/j.foreco.2012.06.049.
- Liu Z, Yang J, Chang Y, Weisberg PJ, He HS. 2012. Spatial patterns and drivers of fire occurrence and its future trend under climate change in a boreal forest of Northeast China. Glob Change Biol. 18(6):2041–2056.
- Liu Y, Stanturf J, Goodrick S. 2010. Trends in global wildfire potential in a changing climate. For Ecol Manage. 259(4):685–697.
- Lorimer CG, Gough WR. 1988. Frequency of drought and severe fire weather in north-eastern Wisconsin. J Environ Manage. 26:203–219.
- Mengistu K. 1994. Forest management system of Ethiopia. overview and options for future development. Participatory Forest Management Workshop Proceedings. Addis Ababa: MoNRDEP.
- Petritsch, R, Hasenauer, H. 2014. Climate input parameters for real-time online risk assessment. Nat Hazards. 70(3):1749–1762. doi:10.1007/s11069-011-9880-y.
- Piñol J, Terradas J, Lloret F. 1998. Climate warming, wildfire hazard, and wildfire occurrence in coastal eastern Spain. Clim Change. 38(3):345–357.
- Pötzelsberger E, Hasenauer H. 2015. Forest–water dynamics within a mountainous catchment in Austria. Nat Hazards. 77(2):625–644.
- Pourghasemi HR, Beheshtirad M, Pradhan B. 2016. A comparative assessment of prediction capabilities of modified analytical hierarchy process (M-AHP) and Mamdani fuzzy logic models using Netcad-GIS for forest fire susceptibility mapping. Geomat Nat Haz Risk. 7(2):861–885.
- Pourtaghi ZS, Pourghasemi HR, Rossi M. 2015. Forest fire susceptibility mapping in the Minudasht forests, Golestan province, Iran. Environ Earth Sci. 73(4):1515–1533.
- Pradhan B, Dini Hairi Bin Suliman M, Arshad Bin Awang M. 2007. Forest fire susceptibility and risk mapping using remote sensing and geographical information systems (GIS). Disaster Prev Manag. 16(3):344–352.
- Pyne S, Andrews P, Laven RD. 1996. Introduction to wildland fire. New York (NJ). John Wiley and Sons.
- Rollins MG, Morgan P, Swetnam T. 2002. Landscape-scale controls over 20th century fire occurrence in two large Rocky Mountain (USA) wilderness areas. Landsc Ecol. 17(6):539–557.
- Salehnia N, Zare H, Kolsoumi S, Bannayan M. 2018. Predictive value of Keetch-Byram Drought Index for cereal yields in a semi-arid environment. Theor Appl Climatol. 134(3–4):1005–1014.
- San-Miguel-Ayanz J, Moreno JM, Camia A. 2013. Analysis of large fires in European Mediterranean landscapes: lessons learned and perspectives. For Ecol Manage. 294:11–22.
- Semenov MA, Stratonovitch P. 2010. Use of multi-model ensembles from global climate models for assessment of climate change impacts. Clim Res. 41:1–14.
- Türkeş M. 2003. Spatial and temporal variations in precipitation and aridity index series of Turkey. Mediterranean Climate. Berlin, Heidelberg: Springer.
- Weiland FS, Van Beek L, Weerts A, Bierkens M. 2012. Extracting information from an ensemble of GCMs to reliably assess future global runoff change. J Hydrol. 412:66–75.
- Wilhite DA, Svoboda MD, Hayes MJ. 2007. Understanding the complex impacts of drought: A key to enhancing drought mitigation and preparedness. Water Resour Manage. 21(5):763–774.