
 ?Mathematical formulae have been encoded as MathML and are displayed in this HTML version using MathJax in order to improve their display. Uncheck the box to turn MathJax off. This feature requires Javascript. Click on a formula to zoom.
Abstract
Although afforestation is one of the best solutions for combating desertification, it requires intensive management. To minimize management efforts in plantations in arid area, it is crucial to select suitable tree species, i.e. those with a high adaptability to xeric environments. In this study, we investigated key tree traits related to drought adaptation in Populus sibirica Hort. ex Tausch and Ulmus pumila L., planted in the Korea-Mongolia Green Belt Plantation in Lun soum, Mongolia. We found that U. pumila had a smaller leaf size and smaller specific leaf area (SLA) than P. sibirica. In addition, the water use efficiency (WUE) of U. pumila (carbon isotope-based) was significantly higher than that of P. sibirica. Although biomass production was ∼2.5 times higher in P. sibirica than in U. pumila due to the differences in leaf area, there were no statistically significant differences in the photosynthetic characteristics on an area basis. These results indicate that U. pumila has a higher adaptive potential to dry conditions than P. sibirica due to its small leaf size, low SLA, and high WUE.
Introduction
The most common methods for combatting desertification are afforestation and reforestation (Miao et al. Citation2015; Yan et al. Citation2015; Fan et al. Citation2016). However, many afforestation and reforestation efforts, especially large-scale efforts, have been unsuccessful (Choi Citation2004; Cao Citation2008; Wang et al. Citation2010). In addition, improper afforestation can induce unwanted environmental problems (e.g. increased water consumption that may lower the ground water table, reduce water yield, and diminish soil moisture) (Yi and Wang Citation2013; Cao et al. Citation2016; Lu et al. Citation2018). These issues are mainly caused by lack of clear objectives, inadequate management practices, and species selection (Cao S et al. Citation2011; Cao et al. Citation2014; Qu et al. Citation2014). Appropriate species selection is key to the success of afforestation efforts and is especially important for the sustainability of the plantation, which requires long-term monitoring (Cao et al. Citation2009; Jacobs et al. Citation2015; Lu et al. Citation2018). Afforestation species are frequently selected based on their growth capacity, i.e. for fast establishment and quick recovery of degraded areas (Padilla et al. Citation2009; Zhang et al. Citation2016). However, although these fast-growing tree species generally grow well at first, some are not able to maintain their fast growth as soil water is depleted and when their water use exceeds the supply of the environment (Cao SX et al. Citation2011). To avoid these problems, there has been an increased interest in and use of slow-growing species that are less water-demanding in the afforestation or restoration of desert areas (Liang et al. Citation2006; Chazdon Citation2008; Padilla et al. Citation2009; Cao S et al. Citation2011; Jacobs et al. Citation2015; Lu et al. Citation2018).
For successful restoration, it is necessary to consider whether the planted trees have species-specific adaptive strategies to drought-stressed environments. For instance, xeromorphic traits, such as the small leaf size or specific leaf area (SLA, or its reciprocal, leaf mass per area) can help overcome extremely dry conditions (Haworth and McElwain Citation2008). In addition to morphological traits, changes in plant stomatal conductance (gs) are considered the main physiological mechanisms to regulate leaf transpiration-induced leaf water deficit (Farquhar and Sharkey Citation1982) and to avoid irreversible damage in the plant hydraulic system (Chaves Citation1991; Medrano Citation2002; Pivovaroff et al. Citation2016). Eventually, the reduction in gs in a prolonged water-stressed condition leads to a decrease in photosynthesis (Chaves Citation1991). Interestingly, however, certain biochemical property in the leaves can improve photosynthetic capacity at given values of gs by partially compensating the reduction of photosynthesis due to the stomatal limitation (Wright et al. Citation2001; Hinojo-Hinojo et al. Citation2018). These key measurements of photosynthetic capacity include the rate parameters: the maximum rate of carboxylation (VCmax) and maximum rate of electron transport (Jmax) (Farquhar et al. Citation1980; Wullschleger Citation1993). Thus, the improvement of these photosynthetic properties could increase the intrinsic water use efficiency (WUEi), which is estimated as the ratio between maximum photosynthetic rate (Amax) at gs, even though the gs reduces access to CO2 when the plants are drought stressed (Medrano et al. Citation2009).
Especially in water-limited environments, plants should minimize water loss while maximizing carbon uptake to optimize their water-use strategies (e.g. Galiano et al., Citation2011; Adams et al., Citation2013; Mitchell et al., Citation2013). For this reason, water use efficiency (WUE) is an important indicator of plant adaptability and sustainability, especially under drought stress. The relationship between WUE and drought tolerance is, however, more difficult to establish and thus to use in the selection of species for afforestation or reforestation efforts in arid regions. Some researchers have proposed that drought-tolerant species with high WUEs are more beneficial than fast-growing species with lower WUEs under water-limited conditions (Fischer and Turner, Citation1978; Ehleringer and Cooper, Citation1988). In contrast, other researchers have argued that drought-tolerant species should have low WUEs because they have conservative morphological and physiological strategies that results in low photosynthetic rates than those of species with high WUEs (Delucia and Schlesinger, Citation1991; Miller et al., Citation2001). Consequently, for sustainable conservation, it is necessary to understand the various responses, mechanisms, and strategies underpinning tree species, especially those used (or may potentially be used) for afforestation and reforestation.
Populus sibirica Hort. ex Tausch and Ulmus pumila L. are the two most commonly planted species used to combat desertification (i.e. used in afforestation or restoration efforts) in Mongolia (Jo and Park Citation2017). Populus sibirica is widely used for its high productivity, re-sprouting capability, and easy vegetative propagation, but it requires a relatively higher water supply due to its rapid growth (Rhodenbaugh and Pallardy Citation1993; Isebrands and Richardson Citation2014). On the other hand, U. pumila is considered to have high drought resistance due to its natural existence in the Mongolian desert, but it shows slow growth (Hilbig Citation1995). Despite their frequent use as restoration species, P. sibirica has not been well studied after its introduction from Russia in the 1940s; and similarly, U. pumila has been reported in only a few studies conducted in the forest steppes of Mongolia (Dulamsuren et al. Citation2005a, Citation2005b; Dulamsuren et al. Citation2009). In this study, we compared two common afforestation species, P. sibirica and U. pumila, planted in the Korea-Mongolia Green Belt Plantation in Lun soum, Mongolia, in 2008. We tested the following hypotheses: (1) the leaf morphology (leaf size and SLA) of the fast-growing P. sibirica is larger than that of U. pumila and demonstrates less seasonal variation; (2) under drought stress, P. sibirica accumulates more biomass by maintaining a higher gs and Amax; and (3) the WUE of U. pumila is higher than that of P. sibirica. We tested these hypotheses by comparing the morphological and physiological differences, stomatal regulation behavior, WUEi, and the discrimination of the C isotope (Δ13C) of these species. Leaf size and SLA were used to investigate the morphological characteristics and the Amax, VCmax, and Jmax photosynthetic traits were used to investigate the physiological characteristics. To test the physiological adaptations to drought conditions, we compared the WUEi and Δ13C. Finally, we assessed how the species-specific strategies related to the aboveground biomass (AGB) increments by estimating the growth of P. sibirica and U. pumila during the growing season.
Materials and methods
Site description
The study site was located at the Korea-Mongolia plantation in Lun soum, Tov aimag; 135 km west of Ulaanbaatar, Mongolia (). It is located at 47°51′27.1″N, 105°8′51″E, with an elevation of 1130 m. The area is in a semi-arid region, with an average temperature of 0.6 ± 0.45 °C, a growing season temperature of 16.29 ± 0.41 °C (May–September), and an average annual precipitation of 206.62 ± 22.45 mm from 1989 to 2013 in Lun station, Mongolia (NAMEM, Citation2013). Summer precipitation occurs between June and August, and accounts for 80–90% of the total annual rainfall. The mean annual potential evapotranspiration was 752.12 ± 30.68 mm; during the growing season of the Mongolian Plateau grassland from 1981 to 2013, it was 565.38 ± 26.94 mm (Cao et al. Citation2018).
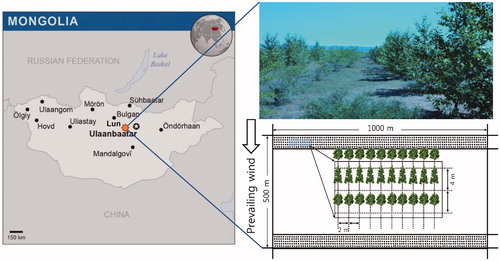
Figure 1. Map location of Lun soum in Mongolia, photograph of study site, and an example of the plantation design used in the study plots. The Populus sibirica and Ulmus pumila were planted in alternating lines. The distance between rows and the planting distance between trees were 4 m and 2 m, respectively.
Study plots and growth measurements
The study plots were located inside the plantation, in a 50 ha area (1000 m × 500 m). The trees were planted within a 20.88 ha area and the rest of area was left for agroforest use. Three-year-old P. sibirica and U. pumila (total n = 27,348 trees), were planted in alternating lines in 2008. The distance between rows and the planting distance between trees were 4 m and 2 m, respectively (). Trees were subjected to one of two irrigation regimes: 2 L (= 0.25 mm m−2) per hour and 4 L (= 0.5 mm m−2) per hour. Irrigation was performed once every 6 days, from mid-May until September 2014 (total n = 30 irrigation events), the last of which occurred on September 28. The duration of irrigation was 6 hours, during which time 2 L or 4 L water per hour was provided through drip irrigation. Sixteen trees were selected from each species (total n = 32 trees), with eight trees selected per irrigation regime for each species.
The diameter and height of trees were measured at the beginning (July 7, 2014) and end (October 27, 2014) of the study period for biomass estimates. Tree diameters were measured twice per tree at 5 cm above the ground surface, in the north-south and east-west directions, using a Vernier caliper (Absolute Digimatic Caliper, Mitutoyo, Kanagawa, Japan; 0.01 mm precision). Tree height was measured using a steel tape. The heights and diameters for each treatment are listed in . There was an increasing trend in the tree heights and diameters when the irrigation quantity increased for P. sibirica, while those of U. pumila showed the opposite trend, i.e. their heights and diameter decreased with increased irrigation. However, no statistical differences in diameter and height growth were detected between the two irrigation regimes for both species (minimum p-value = 0.11). Furthermore, no statistically significant differences were detected in the morphological and physiological traits between irrigation regimes. Therefore, we used the combined data from the two irrigation regimes to increase the statistical confidence and power of the analysis.
Table 1. Tree heights and root collar diameters of sampled Populus sibirica and Ulmus pumila grown under different irrigation regimes.
Environmental variables
Meteorological data were measured from July to September and included air temperature (Ta; °C), relative humidity (RH; %), volumetric soil water content (θ; %), photosynthetically active radiation (Q; µmol m−2 s−1), and precipitation (mm). The Ta and RH were measured using a HOBO Micro Station (H21-002, Onset Computer Corporation, Cape Cod, MA, USA). Q was measured using a Li-Cor 190 (Campbell Scientific Inc., Logan, UT, USA). The instruments were installed on a 7 m high tower. For data validation and accuracy, we also used Ta, RH (HMP155, Vaisala, Helsinki, Finland), and precipitation (TE525MM, Texas Electronics, Dallas, TX, USA) data measured at an eddy covariance tower 1500 m away from our study plots. The θ, up to a depth of 30 cm, was measured using a CS616 (Campbell Scientific Inc.). Three sensors were used for each tree species and three additional sensors were installed on bare land to determine the effects of irrigation. All the environmental variables were recorded using a data logger (CR1000, Campbell Scientific Inc.), that collected data at 15 s intervals and recorded after averaging 30 min of data. Due to power loss, Q data were not available from day of year (DOY) 182 to DOY 191 and θ data were not collected from DOY 210 to DOY 221. The error data that were received from several soil moisture sensors were corrected by regression with the data from the other sensors.
Leaf characteristics
To measure leaf size and SLA, leaves from the 32 sampled trees were collected three times: on DOY 207, 221, and 249. In total, 10 to 12 leaves were collected from each sampled tree at various heights, from the south-facing canopy. The leaves were imaged using a scanner (HP Laserjet M1132 MFP, Boise, ID, USA) at 600 dpi resolution and processed by MATLAB (R2014b; Math Works Inc., Natick, MA, USA) to calculate leaf size. Leaf weights were measured to the 0.001 g using a scale (Discovery Semi-Micro and Analytical Balance, Ohaus Corp., Switzerland), after being dried in a convection oven (OF-11E, Jeio Tech., Republic of Korea) at 65 °C for 3 days. The SLA (cm2 g−1) was calculated from the dry leaf weight (g) divided by the leaf size (cm2).
Photosynthesis measurements and intrinsic water use efficiency (WUEi)
The rate of photosynthesis was determined using a portable photosynthesis measurement system (LI-6400, Li-Cor Inc., Lincoln, NE, USA), equipped with 2 × 3 cm2 red and blue light source chambers (red + blue 6400-02B, Li-Cor Inc.). To measure the light response curve of photosynthesis, the radiation was adjusted from 1500 μmol m−2 s−1 to 0 μmol m−2 s−1 in 13 different intensity levels. The sample CO2 concentration, [CO2] in the chamber was controlled at 400 μmol mol−1 during the measurement. To measure the rate of photosynthesis at various [CO2] (A–Ci curve), the [CO2] was adjusted from 0 to 1400 μmol mol−1 in 14 concentration levels. The leaves used for measurements were selected based on locations in the canopy (between 1 m and 2 m, and south-facing), and their similar sizes and quality, and if they were fully unfolded. The leaves were measured after they were stabilized in the chamber environments, which were controlled to maintain a temperature of 25 °C and 55–65% humidity. Six leaves were chosen from the samples of each study species (P. sibirica and U. pumila) and monitored throughout the study period. The first and second measurements were conducted from DOY 209 to 217, and from DOY 244 to 253, respectively. Amax was determined as the value of the photosynthesis reaction curve at 1000 μmol m−2 s−1. VCmax and Jmax were estimated from the acquired CO2 response curves following Sharkey et al. (Citation2007).
WUEi (μmol CO2 mol−1 H2O), or the quantity of absorbed CO2 (μmol CO2 m−2 s−1) per unit of water consumption (mol H2O m−2 s−1), was estimated independently from the leaf gas exchange measurements by using the photosynthetic rate at the light saturation point. WUEi was calculated as the ratio of Amax to gs.
Stable carbon isotope analyses
To analyze stable carbon isotopes, the 12 leaves per species that were used for the photosynthesis measurements were collected, along with two more leaves from another tree of the same species (total n = 14 leaves per species). In addition, a stem core of each sample tree was collected at the end of the growing season using the tree ring core at 5 cm above the root collar, using a 5 mm increment borer (Haglof Sweden AB, Langsele, Sweden). Leaf and stem samples were dried in a convection oven (OF-11E, Jeio Tech.) at 65 °C for 3 days; for the stem sample, the section of the current year was exclusively cut out and used for the analysis. The samples were processed with a homogenizer (FastPrep-24, MP Biomedicals, Solon, OH, USA). The processed specimens were sent to the National Instrumentation Center for Environmental Management (NICEM) at the College of Agriculture and Life Science, Seoul National University in Korea for the carbon isotope analyses. The composition of the carbon isotopes was analyzed using a mass spectrometer (IsoPrime Vision-EA, Micromass, Manchester, UK) coupled with a CNS analyzer (Elementar group, Hanau, Germany). Carbon isotope (δ13C) composition was calculated as follows:
(2)
(2)
where Rsample is the abundance ratio of 13C/12C in the sample plant, and Rstandard is the Pee Dee Belemite standard (PDB, 0.0112372‰) for carbon. The accuracy of measurements was assessed using multiple replicated analyses, which indicated that the standard deviation for the δ13C measurement was < 0.1‰. The carbon isotope discrimination (Δ13C) was calculated from the acquired δ13C value, following Farquhar et al. (Citation1989).
Aboveground biomass
The aboveground tree biomass (AGB, kg) data were obtained using the allometric equations developed from harvested branches. Five trees of P. sibirica and U. pumila were sampled from near the experimental site when the leaf area of each species had reached its maximum. Branches (n = 10–15) were collected evenly from throughout the crown each individual tree, which resulted in a total of 98 and 102 branches for P. sibirica and U. pumila, respectively. The sample collection progressed from the lower to the upper branches to ensure that the size of the branches was the evenly distributed over the entire tree. Branch diameter (measured at 1 cm from point of insertion in the north-south and east-west directions, and twice in each direction), length, and its height (position) on the tree were recorded. After harvested branches were transported to the lab, the leaves were separated from the branches and dried in a convection oven (OF-11E, Jeio Tech.) at 65 °C for 3 days. After drying, the dry weight of the leaves and branches were measured to 0.001 g (Discovery Semi-Micro and Analytical Balance, Ohaus Corp.). Allometric equations for branch diameter and the respective leaf biomass were developed for each species. We tested some power equations (with the diameters of the studied trees) using the most reliable models, based on R2, and scaled them up from the sample trees to all trees. Stem biomass (SB) was calculated using the cylinder formula. Stem volume was converted to dry weight using the equation:
(3)
(3)
where DRC and DEN denote the diameter root collar and the wood density, respectively. Finally, AGB was calculated as the sum of SB, total branch, and leaf biomass of each measured tree. Allometric equations for AGB were developed using simple linear regression with DRC as the independent variable (Rawat and Singh Citation1988). The allometric equations used were:
(4)
(4)
(5)
(5)
Data analysis
Student’s t-tests were used to compare the means after data were tested for normality (Shapiro-Wilk test) and homogeneity of variance (Levene’s test). If the data did not satisfy the normality and homogeneity tests, Mann-Whitney tests were used to compare the differences. The statistical analyses were conducted in SPSS 22.0 (IBM Corp., SPSS Statistics for Windows, Chicago, IL, USA). Data were presented as means ± standard errors (SEs). p-Values < 0.05 were considered statistically significant. We compared SLA, Amax, VCmax, Jmax, WUEi, and Δ13C using analysis of variance (ANOVA) and Tukey’s standardized multiple comparisons test to identify significant differences among groups (Norusis Citation2008). We compared the linear regression lines for the relationships between VCmax and Jmax, gs and WUEi, Amax and WUEi, and Δ13C for the two species using analysis of covariance (ANCOVA), after analyzing the regressions to elucidate significant differences between the two species. Soil moisture was evaluated using a Kruskal-Wallis nonparametric test. The graphs were produced using Sigma Plot version 12.5 (Systat Software for windows, San Jose, CA, USA).
Results
Environmental variables
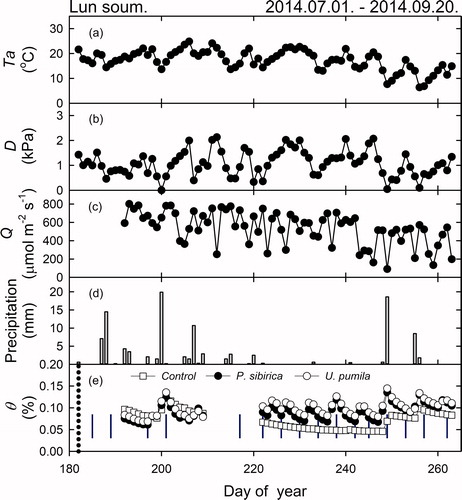
The meteorological data during the period of DOY 182 to DOY 263 showed that the average and highest Ta of Lun soum were 17.31 and 33.66 °C, respectively (). The Ta followed the change of the seasons, peaking at mid-July to early August and decreasing in September. The mean daily D and Q were 1.08 kPa, and 534.08 μmol m−2 s−1, respectively (). The total precipitation during the study period was 109.8 mm, where 71.6 mm, 8.6 mm, and 29.6 mm, were recorded in July, August, and September, respectively (). D peaked in August due to little precipitation and high Ta. Q was highest in July, probably due to the missing data in June. θ showed a higher value in July and September than in August, due to the precipitation (). The average θ of the U. pumila plot was 9.88 ± 0.23%, which was higher than that of the P. sibirica plot (9.03 ± 0.23%). θ was higher in the treatment plots than in the control plot (7.28 ± 0.27%), due to the irrigation showing clear enhancement of θ after irrigation (p < 0.001, ).
Figure 2. Daily average environmental variables in Lun soum plantation (a) Average daily mean temperature (Ta, °C), (b) vapor pressure deficit (D, kPa), (c) photosynthetically active radiation (Q, μmol m−1 S−1), (d) precipitation (mm), and (e) soil volumetric water content (θ, %) measured at the study site between July and September 2014. (□) Control, (•) Populus sibirica, (○) Ulmus pumila; (|), blue vertical line, represents irrigation treatment.
Morphological characterization of the leaves
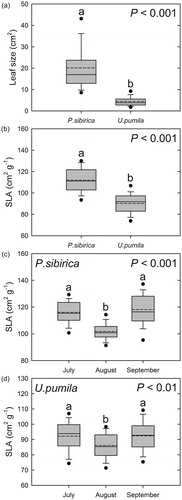
The average leaf size of P. sibirica was larger than that of U. pumila. (p < 0.001, ). Similarly, the average SLA of P. sibirica was also larger than that of U. pumila. (p < 0.001, ). There were significant variations with seasonal change in SLA within species for both species: the SLA of P. sibirica was 116.07 ± 1.49, 101.73 ± 1.13, and 118.13 ± 2.08 cm2 g−1 in July, August, and September, respectively, and that of U. pumila was 92.19 ± 1.64, 86.09 ± 1.44, and 92.44 ± 1.70 cm2 g−1, respectively (). Both species had smaller SLAs in August than in July and September (p < 0.001, p < 0.01 for P. sibirica and U. pumila, respectively).
Figure 3. Comparisons of average leaf size (cm2) and specific leaf area (SLA, cm2 g−1) of Populus sibirica and Ulmus pumila. (a) Interspecies comparison of leaf size (p < 0.001), (b) interspecies comparison of SLA (p < 0.001), (c) seasonal changes in the SLA of P. sibirica (p < 0.001), and (d) seasonal changes in the SLA of U. pumila (p < 0.01). Contained within each box are the lower quartile, median (dash), mean (short dash), and upper quartile of the values. Different letters on the error bars indicate significant differences according to the t-test and Tukey’s multiple range test at p < 0.05.
Estimation of Amax, photosynthesis parameters
Amax of P. sibirica was affected by seasonal change, showing a higher value in August and a decrease in September (p < 0.001, ). Amax of U. pumila, however, did not show such changes, and was 23.18 ± 1.32 and 20.35 ± 2.03 μmol CO2 m−2 s−1 in August and September, respectively (p = 0.266, ). In August and September, Amax did not differ between P. sibirica and U. pumila (p = 0.242 and p = 0.154, respectively, ). VCmax and Jmax were higher in August than in September for both species (p < 0.001 and p < 0.01, , respectively,). In August and September, VCmax and Jmax did not differ between P. sibirica and U. pumila.
Figure 4. Comparisons of photosynthetic characteristics between Populus sibirica and Ulmus pumila. (a) Seasonal differences in the maximum rates of photosynthesis (Amax, μmol m−2 s−1) of P. sibirica and U. pumila (p < 0.01), (b) seasonal differences in the maximum rate of carboxylation (VCmax, μmol m−2 s−1) of P. sibirica and U. pumila (p < 0.001), (c) comparison of the maximum rate of electron transport (Jmax, μmol m−2 s−1) of P. sibirica and U. pumila (p < 0.01), and (d) the relationship between VCmax and Jmax. Closed circles (•) and open circles (○) represent P. sibirica and U. pumila, respectively. The solid line represents the regression line (Jmax = 0.83 × VCmax + 56.27, R2 = 0.74, p < 0.001). Different letters on the error bars indicate significant differences according to t-test and Tukey’s multiple range tests at p < 0.05. The differences in the regression were calculated using analysis of covariance (ANCOVA).
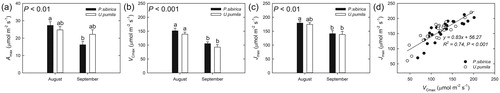
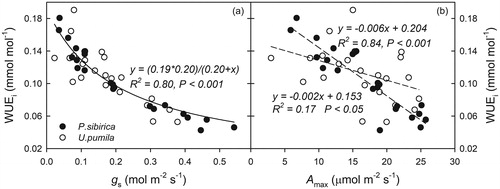
Figure 5. Comparisons of the intrinsic water use efficiency (WUEi), stomatal conductance (gs), and maximum photosynthetic capacity (Amax) between Populus sibirica and Ulmus pumila. (a) The relationship between gs (mol m−2 s−1) and WUEi (mmol mol−1) in P. sibirica and U. pumila. The curve is a non-linear regression line fit to all data. (b) The relationship between Amax (μmol m−2 s−1) and WUEi in P. sibirica and U. pumila. The dashed lines are linear regression through the data points for the two individual species. Closed circles (•) and open circles (○) represent P. sibirica and U. pumila, respectively.
The relationship between VCmax and Jmax was not significantly different between species (ANCOVA analysis, p = 0.819). The overall means of VCmax and Jmax were 122.16 ± 5.31 and 158.16 ± 5.14 μmol m−2 s−1, respectively, and both parameters were linearly correlated. As a result, the linear regression equation for the two species is given as ():
The relationship between WUEi, gs, and Amaxacross species
Differences in WUEi were seasonally dependent. In August, the WUEi of U. pumila, was higher than that of P. sibirica (p < 0.01). In September, however, there was no difference between the WUEi of U. pumila and P. sibirica (p = 0.095). Within species, the WUEi of P. sibirica differed between August and September (p < 0.01), while that of U. pumila did not (p = 0.072, ).
A strong negative, but non-linear relationship was found between gs and WUEi (). WUEi decreased as gs increased in both species (). The relationship between gs and WUEi of P. sibirica was more robust (R2 = 0.96) and had broader ranges of gs (0.04–0.54 mmol m−2 s−1) than U. pumila (R2 = 0.61 and 0.02–0.38 mmol m−2 s−1, respectively). However, the relationships between WUEi and gs for both species did not differ significantly (overall WUEi = (0.19 × 0.20)/(0.20 + gs), R2 = 0.80, p < 0.001, ). The relationship between Amax and WUEi showed a negative correlation: WUEi decreased as Amax increased in both species (). Similar to gs, a stronger negative linear relationship was found in P. sibirica (WUEi = −0.006 × Amax + 0.204, R2 = 0.84, p < 0.001) than in U. pumila (WUEi = −0.002 × Amax + 0.153, R2 = 0.17, p < 0.05). In addition, the slope of the relationship between Amax and WUEi of P. sibirica was steeper than that of U. pumila (p < 0.01, ).
Carbon isotope discrimination and intrinsic water use efficiency (WUEi) of leaves
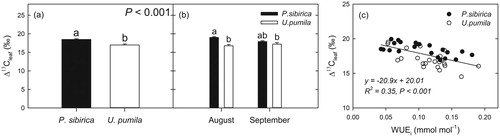
The Δ13C of U. pumila was lower than that of P. sibirica (p < 0.001, ). Seasonal changes in Δ13C in P. sibirica were observed: 19.03 ± 0.2 and 17.91 ± 0.24‰ in August and September, respectively (p < 0.01, ), but not in U. pumila: 16.77 ± 0.35 and 17.21 ± 0.42‰ in August and September, respectively (P = 0.433, ). The relationship between Δ13C and WUEi showed a negative correlation, and there was no difference between species (Δ13C = −20.9 × WUEi + 21.01, R2 = 0.35, p < 0.001, ).
Figure 6. Comparisons of the carbon isotope discrimination (Δ13C) and WUEi between Populus sibirica and Ulmus pumila. (a) Values of Δ13C (‰, mean ± SE) calculated from carbon isotope composition (δ13C) for P. sibirica and U. pumila. (b) Mean values of Δ13C over the 2 months, respectively. Different lowercase letters above the error bars indicate significant differences at p < 0.05. (c) Relationships between Δ13C and intrinsic water use efficiency (WUEi, mmol mol−1) for P. sibirica and U. pumila. The solid line represents the linear regression through the data points for both species.
Aboveground biomass growth and carbon isotope discrimination of stems
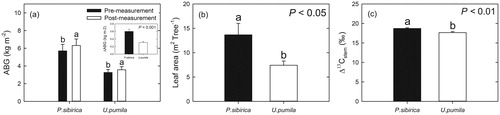
Aboveground biomass (AGB) of P. sibirica and U. pumila changed from 5.71 ± 0.74 and 3.26 ± 0.35 kg tree−1 in the pre-measurement to 6.31 ± 0.74 and 3.57 ± 0.35 kg tree−1 in the post-measurement, respectively (). Net AGB production was significantly different between P. sibirica and U. pumila, i.e. 0.6 ± 0.06 and 0.31 ± 0.03 kg tree−1, respectively (p < 0.001, ). Leaf area production also differed significantly between P. sibirica and U. pumila: 13.66 ± 2.36 and 7.43 ± 0.86 m2 tree−1, respectively (p < 0.05, ). The Δ13Cstem of U. pumila (17.64 ± 0.27‰) was significantly lower than that of P. sibirica (18.72 ± 0.18‰) (p < 0.01, ).
Figure 7. (a) Mean values of aboveground biomass (ABG, kg m−2) for Populus sibirica and Ulmus pumila. The inset presents the changes in ABG between pre-measurement and post-measurement. (b) Leaf area (m2 tree−1) of P. sibirica and U. pumila. (c) The values of stem carbon isotope discrimination (‰, Δ13C, mean ± SE) calculated from the carbon isotope compositions (δ13C) of P. sibirica and U. pumila. Different lowercase letters above the error bars indicate significant differences at p < 0.05.
Discussion
Morphological differences in leaf size and SLA
Ulmus pumila was found to have smaller and thicker leaves (smaller SLA) than P. sibirica. The low SLA recorded for U. pumila would enable reduced water loss, a thick cuticle layer, and deeply sunken stomata () (Givnish Citation1987; Park et al. Citation2016; Leigh et al. Citation2017). In addition, the small leaves of U. pumila might result in the species being less stressed and better adapted to heat stress by preventing heat accumulation due to efficient coupling of leaves with the surrounding environment (Gibson Citation1998; Monteith and Unsworth Citation2013; Leigh et al. Citation2017). These findings are further corroborated by the fact that U. pumila is naturally found in arid regions (Wesche et al. Citation2011).
The SLAs of P. sibirica and U. pumila were dependent on seasonal changes, and were lower in August than in July and September due to low precipitation and high temperatures (Coble et al. Citation2016; Fajardo and Siefert Citation2016). Furthermore, the trees in our study area consisted of two evenly distributed young species, which seemed to induce a higher soil moisture loss rate due to the increased transpiration than when planted as a single species (Delzon and Loustau Citation2005). Similar results have often been reported for seasonal changes in SLA and other leaf traits caused by water stress in hardwood species (e.g. Wilson et al. Citation2000; Xu L and Baldocchi Citation2003; Nouvellon et al. Citation2010; Chen et al. Citation2015). In addition, Gotsch et al. (Citation2010) showed that leaf characteristics are more relevant in dry than in wet conditions.
However, the SLA of both species increased in September, but the reasons for this change seem to differ between species. The larger SLA in P. sibirica may be due to nutrient reallocation for the upcoming senescence that resulted in a lighter and the larger SLA (Jurik Citation1986; Han et al. Citation2008). Populus sibirica showed higher seasonal variation than U. pumila, which showed no changes in Amax between August and September (). A rapid reduction in photosynthetic rate, which is characteristic of senescing leaves, appears to have occurred during the late autumn season (Herrick and Thomas Citation2003; Katahata et al. Citation2007). In addition, P. sibirica, being a fast-growing species with higher photosynthetic capacity, generated larger and thinner leaves with a shorter leaf longevity than the smaller, longer-lived leaves of U. pumila (Reich et al. Citation1997; Reich et al. Citation1999). These results suggest that variations in SLA can be attributed to seasonal changes in the re-translocation processes of leaf nutrients or non-structural carbohydrate contents (Misson et al. Citation2006).
Differences in photosynthesis parameters
Mongolia is characterized by a long, cold winter, with a very short growing season. Species with short-lived leaves in harsh environments tend to invest more resources in their photosynthesis efficiency rather than their structure (Cunningham et al. Citation1999; Fonseca et al. Citation2000; Ackerly et al. Citation2002). The Amax data (21.77 ± 1.22 μmol CO2 m−2 s−1) in the present study were surprisingly higher than that of the 5- to 20-year-old U. pumila (15 μmol CO2 m−2 s−1) reported from a similar environment in China with an altitude of 1300 m and around 350 mm of precipitation (Su et al. Citation2014). Similarly, P. sibirica had a higher Amax value (27.31 ± 2.12 μmol CO2 m−2 s−1 in August) than has been reported in warmer and wetter environments (average temperature of 3.7 °C and annual precipitation of 550 mm), i.e. 20.05 μmol m−2 s−1 (Xu et al. Citation2008) (). A high Amax, such as reported by Wright et al. (Citation2001) and Hinojo-Hinojo et al. (Citation2018), is assumed to increase the photosynthetic rate per unit leaf size by improving the biochemical properties such as nitrogen concentration of leaves to overcome low gs due to moisture stress and a short growing period.
The photosynthetic capacity of a plant is simply expressed with the parameters VCmax and Jmax, which represent the enzyme kinetic activity of RuBisCO (ribulose-1,5-bisphosphate carboxylase-oxygenase) and electron transport or ribulose bisphosphate (RuBP) regeneration, respectively (Farquhar et al. Citation1980). In general, these two parameters have a strong linear relationship (Jmax/VCmax = 1.5–2.0 at 25 °C; Wullschleger Citation1993; Beerling and Quick Citation1995; Von Caemmerer Citation2000; Medlyn et al. Citation2002). However, the Jmax/VCmax ratio in our study was 0.83 (), which was much lower than the general relationship; this low value was attributed to high VCmax, rather than low Jmax. The mean VCmax in our study was higher than those reported in many empirical studies (Walker et al. Citation2014; Ali et al. Citation2015; Nolan et al. Citation2017). Based on the findings of other studies, a high VCmax or low Jmax/VCmax is common in arid areas, with values ranging from 1.3 to 1.55 (Midgley et al. Citation2004; Meir et al. Citation2007; Maseyk et al. Citation2008; Zhu et al. Citation2011). The high levels of VCmax require high RuBisCO activity, which requires a high nitrogen content in the leaves (Reich et al. Citation1997; Xu L and Baldocchi Citation2003). The high VCmax reflects acclimation to abundant irradiance that originates from the high latitude (47°51′27.1″N), altitude (1130 m), and long summer days in Mongolia, because these conditions rarely limit RuBP regeneration. For this reason, trees in arid regions may increase the ability for RuBP carboxylation relatively more than for RuBP regeneration as the best strategy to maintain co-limitation and avoid photo-inhibition as much as possible at high irradiance (Hikosaka et al. Citation1999).
4.3. Different water-use strategies at various scales
In our study, we examined the water use strategies at three temporospatial scales: intrinsic leaf (i.e. WUEi), integrated leaf (i.e. Δ13Cleaf), and integrated biomass (i.e. Δ13Cstem) (). At the variation in WUEi across species was not different between species and was primarily driven by variations in gs (). However, the WUEi with high Amax was higher in P. sibirica than in U. pumila, and vice versa with low Amax (). Simply, the short-lived leaves of P. sibirica had wider ranges in gs and WUEi than the longer-lived leaves of U. pumila. These results implied that U. pumila controlled gs more conservatively, maintaining a lower gs at high Amax than P. sibirica. This pattern was consistent at the integrated time scales ( and ). Significant differences in Δ13C between P. sibirica and U. pumila indicated the different leaf-level time integrated WUE in the two species (). Likewise, the results from stable isotopes in the tree rings of P. sibirica and U. pumila were significantly different (p < 0.01, ). The above results offer a good explanation as to why U. pumila is distributed throughout the dry desert areas of Mongolia.
Furthermore, P. sibirica was found to have higher biomass production than U. pumila, presumably by using more water than U. pumila (). Consistent with this notion, the average soil moisture for U. pumila (9.88 ± 0.23%) was higher than that for P. sibirica (9.03 ± 0.23%) (). The difference in biomass production is thus presumed to be due to species-specific water consumption and growth characteristics (Ma et al. Citation2012). Populus sibirica has larger leaves and a larger leaf area than U. pumila, which also results in the increase in AGB production ( and ). In addition, shows that there were no differences in leaf gas exchange per unit leaf area, but show the difference in total biomass production due to differences in total leaf area. When the difference in leaf area (1.84 = 13.66/7.43 cm2 tree−1) was accounted for, the difference in biomass enhancement (1.96 = 0.6/0.31 kg tree−1) was substantially reduced to ∼7% (1.07 = 1.96/1.84 kg tree−1; ).
Conclusion
Our study compared the morphological and physiological characteristics as well as the WUE of 10-year-old P. sibirica and U. pumila trees, i.e. the commonly used species for the afforestation of the Mongolian desert. Regarding the morphological characteristics, U. pumila, which is native to and present throughout Mongolia, including the deserts, showed a better adaptation to the desert environment (i.e. small, thick leaves), than did P. sibirica, which was introduced from Russia in the mid-twentieth century. In contrast, Amax for P. sibirica, which is considered to have high productivity, did not differ from that in U. pumila, but the biomass yield for P. sibirica was nearly double that of U. pumila. This difference in biomass production may be attributed to the difference in leaf area and presumably transpiration, as evidenced by the lower soil water content. Even with unfavorable morphological traits for arid areas, P. sibirica showed much higher biomass production and had an Amax that was more than 1.5 times higher in August than in September. This indicated that P. sibirica assimilated a large amount of CO2 in a short period of time and its physiological activity would be expected to be diminished early. In comparison, the native species U. pumila showed small seasonal variations in physiological characteristics, such as Amax and Jmax, and grew slowly over a long period of time. According to the results of this study, U. pumila had higher WUE and a consistent Amax, while P. sibirica exhibited the opposite trends. These findings indicate that U. pumila has a lower water requirement than P. sibirica in water deficit conditions. Furthermore, U. pumila exhibited greater flexibility than did P. sibirica in adapting to a dry environment, e.g. Mongolia, via the adoption of a conservative growth strategy. As a result, P. sibirica is believed to experience more difficulties in surviving under drought stress conditions, especially due to having such higher water requirements. In addition, the comparison of the morphological and physiological characteristics of the two species revealed that they would have greatly different effects on the water environment and management of plantations, and that U. pumila is the more logical choice for use in afforestation efforts in the arid regions of Mongolia.
Acknowledgments
We thank the staff of the Korea-Mongolia Greenbelt Plantation Project and the members of the Forest Genetics and Ecophysiology Laboratory at the National University of Mongolia for their assistance in the laboratory and in the field.
Disclosure statement
No potential conflict of interest was reported by the authors.
Additional information
Funding
Related Research Data
References
- Ackerly D, Knight C, Weiss S, Barton K, Starmer K. 2002. Leaf size, specific leaf area and microhabitat distribution of chaparral woody plants: contrasting patterns in species level and community level analyses. Oecologia. 130(3):449–457.
- Adams, H D, Germino, M J, Breshears, D D, Barron-Gafford, G A, Guardiola-Claramonte, M, Zou, C B, Huxman, T E. 2013. Nonstructural leaf carbohydrate dynamics of Pinus edulis during drought-induced tree mortality reveal role for carbon metabolism in mortality mechanism. New Phytol. 197(4):1142–1151. doi:10.1111/nph.12102.
- Ali AA, Xu C, Rogers A, McDowell NG, Medlyn BE, Fisher RA, Wullschleger SD, Reich PB, Vrugt JA, Bauerle WL, et al. 2015. Global-scale environmental control of plant photosynthetic capacity. Ecol Appl. 25(8):2349–2365.
- Beerling DJ, Quick WP. 1995. A new technique for estimating rates of carboxylation and electron transport in leaves of C3 plants for use in dynamic global vegetation models. Global Change Biol. 1(4):289–294.
- Cao S, Sun G, Zhang Z, Chen L, Feng Q, Fu B, McNulty S, Shankman D, Tang J, Wang Y, et al. 2011. Greening China naturally. Ambio. 40(7):828–831.
- Cao S, Zhang J, Chen L, Zhao T. 2016. Ecosystem water imbalances created during ecological restoration by afforestation in China, and lessons for other developing countries. J Environ Manage. 183(Pt 3):843–849.
- Cao S. 2008. Why large-scale afforestation efforts in china have failed to solve the desertification problem. Environ Sci Technol. 42(6):1826–1831.
- Cao SX, Chen L, Shankman D, Wang CM, Wang XB, Zhang H. 2011. Excessive reliance on afforestation in China’s arid and semi-arid regions: lessons in ecological restoration. Earth-Sci Rev. 104(4):240–245.
- Cao SX, Chen L, Yu XX. 2009. Impact of China’s Grain for Green Project on the landscape of vulnerable arid and semi-arid agricultural regions: a case study in northern Shaanxi Province. J Appl Ecol. 46(3):536–543.
- Cao SX, Ma H, Yuan WP, Wang X. 2014. Interaction of ecological and social factors affects vegetation recovery in China. Biol Conserv. 180:270–277.
- Cao X-J, Gao Q-Z, Hasbagan G, Liang Y, Li W-H, Hu G-Z. 2018. Influence of climatic factors on variation in the Normalised Difference Vegetation Index in Mongolian Plateau grasslands. Rangel J. 40(2):91–100.
- Chaves MM. 1991. Effects of water deficits on carbon assimilation. J Exp Bot. 42(234):1–16.
- Chazdon RL. 2008. Beyond deforestation: restoring forests and ecosystem services on degraded lands. Science. 320(5882):1458–1460.
- Chen ZH, Zha TS, Jia X, Wu YJ, Wu B, Zhang YQ, Guo JB, Qin SG, Chen GP, Peltola HL. 2015. Leaf nitrogen is closely coupled to phenophases in a desert shrub ecosystem in China. J Arid Environ. 122:124–131.
- Choi YD. 2004. Theories for ecological restoration in changing environment: toward ‘futuristic’ restoration. Ecol Res. 19(1):75–81.
- Coble AP, VanderWall B, Mau A, Cavaleri MA. 2016. How vertical patterns in leaf traits shift seasonally and the implications for modeling canopy photosynthesis in a temperate deciduous forest. Tree Physiol. 36(9):1077–1091.
- Cunningham SA, Summerhayes B, Westoby M. 1999. Evolutionary divergences in leaf structure and chemistry, comparing rainfall and soil nutrient gradients. Ecol Monogr. 69(4):569–588.
- Delucia, E H, Schlesinger, W H. 1991. Resource-use efficiency and drought tolerance In adjacent great basin and sierran plants. Ecology. 72(1):51–58. doi:10.2307/1938901.
- Delzon S, Loustau D. 2005. Age-related decline in stand water use: sap flow and transpiration in a pine forest chronosequence. Agric Forest Meteorol. 129(3-4):105–119.
- Dulamsuren C, Hauck M, Mühlenberg M. 2005a. Ground vegetation in the Mongolian taiga forest‐steppe ecotone does not offer evidence for the human origin of grasslands. Appl Vegetat Sci. 8(2):149–154.
- Dulamsuren C, Hauck M, Muhlenberg M. 2005b. Vegetation at the taiga forest-steppe borderline in the western Khentey Mountains, northern Mongolia. Ann Bot Fenn. 42(6):411–426.
- Dulamsuren C, Hauck M, Nyambayar S, Bader M, Osokhjargal D, Oyungerel S, Leuschner C. 2009. Performance of Siberian elm (Ulmus pumila) on steppe slopes of the northern Mongolian mountain taiga: drought stress and herbivory in mature trees. Environ Exp Bot. 66(1):18–24.
- Ehleringer, J R, Cooper, T A. 1988. Correlations between carbon isotope ratio and microhabitat in desert plants. Oecologia. 76(4):562–566. doi:10.1007/BF00397870.
- Fajardo A, Siefert A. 2016. Phenological variation of leaf functional traits within species. Oecologia. 180(4):951–959.
- Fan B, Zhang A, Yang Y, Ma Q, Li X, Zhao C. 2016. Long-term effects of xerophytic shrub Haloxylon ammodendron plantations on soil properties and vegetation dynamics in Northwest China. PLoS One. 11(12):e0168000.
- Farquhar G, von Caemmerer S, Berry J. 1980. A biochemical model of photosynthetic CO2 assimilation in leaves of C 3 species. Planta. 149(1):78–90.
- Farquhar GD, Ehleringer JR, Hubick KT. 1989. Carbon isotope discrimination and photosynthesis. Annu Rev Plant Physiol Plant Mol Biol. 40(1):503–537.
- Farquhar GD, Sharkey TD. 1982. Stomatal conductance and photosynthesis. Annu Rev Plant Physiol. 33(1):317–345.
- Fischer, R A, Turner, N C. 1978. Plant productivity in the arid and semiarid zones. Annu Rev Plant Physiol. 29(1):277–317. doi:10.1146/annurev.pp.29.060178.001425.
- Fonseca CR, Overton JM, Collins B, Westoby M. 2000. Shifts in trait-combinations along rainfall and phosphorus gradients. J Ecology. 88(6):964–977.
- Galiano, L, Martínez-Vilalta, J, Lloret, F. 2011. Carbon reserves and canopy defoliation determine the recovery of Scots pine 4 yr after a drought episode. New Phytologist. 190(3):750–759. doi:10.1111/j.1469-8137.2010.03628.x.
- Gibson AC. 1998. Photosynthetic organs of desert plants. BioSc. 48(11):911–920.
- Givnish TJ. 1987. Comparative-studies of leaf form – assessing the relative roles of selective pressures and phylogenetic constraints. New Phytol. 106(1):131–160.
- Gotsch SG, Powers JS, Lerdau MT. 2010. Leaf traits and water relations of 12 evergreen species in Costa Rican wet and dry forests: patterns of intra-specific variation across forests and seasons. Plant Ecol. 211(1):133–146.
- Han QM, Kawasaki T, Nakano T, Chiba Y. 2008. Leaf-age effects on seasonal variability in photosynthetic parameters and its relationships with leaf mass per area and leaf nitrogen concentration within a Pinus densiflora crown. Tree Physiology. 28(4):551–558.
- Haworth M, McElwain J. 2008. Hot, dry, wet, cold or toxic? Revisiting the ecological significance of leaf and cuticular micromorphology. Palaeogeogr Palaeoclimatol Palaeoecol. 262(1-2):79–90.
- Herrick JD, Thomas RB. 2003. Leaf senescence and late-season net photosynthesis of sun and shade leaves of overstory sweetgum (Liquidambar styraciflua) grown in elevated and ambient carbon dioxide concentrations. Tree Physiol. 23(2):109–118.
- Hikosaka K, Murakami A, Hirose T. 1999. Balancing carboxylation and regeneration of ribulose-1,5-bisphosphate in leaf photosynthesis: temperature acclimation of an evergreen tree, Quercus myrsinaefolia. Plant Cell Environ. 22(7):841–849.
- Hilbig W. 1995. The vegetation of Mongolia. Amsterdam: SPB Academic Publishing.
- Hinojo-Hinojo C, Castellanos AE, Llano-Sotelo J, Penuelas J, Vargas R, Romo-Leon JR. 2018. High Vcmax, Jmax and photosynthetic rates of Sonoran Desert species: using nitrogen and specific leaf area traits as predictors in biochemical models. J Arid Environ. 156:1–8.
- Isebrands JG, Richardson J. 2014. Poplars and willows: trees for society and the environment. Boston (MA): CABI.
- Jacobs DF, Oliet JA, Aronson J, Bolte A, Bullock JM, Donoso PJ, Landhäusser SM, Madsen P, Peng S, Rey-Benayas JM, et al. 2015. Restoring forests: what constitutes success in the twenty-first century? New Forests. 46(5-6):601–614.
- Jo HK, Park HM. 2017. Effects of pit plantings on tree growth in semi-arid environments. Forest Sci Technol. 13(2):66–70.
- Jurik TW. 1986. Temporal and spatial patterns of specific leaf weight in successional Northern hardwood tree species. Am J Bot. 73(8):1083–1092.
- Katahata SI, Naramoto M, Kakubari Y, Mukai Y. 2007. Seasonal changes in photosynthesis and nitrogen allocation in leaves of different ages in evergreen understory shrub Daphniphyllum humile. Trees-Struct Funct. 21(6):619–629.
- Leigh A, Sevanto S, Close JD, Nicotra AB. 2017. The influence of leaf size and shape on leaf thermal dynamics: does theory hold up under natural conditions? Plant Cell Environ. 40(2):237–248.
- Liang ZS, Yang JW, Shao HB, Han RL. 2006. Investigation on water consumption characteristics and water use efficiency of poplar under soil water deficits on the Loess Plateau. Colloids Surf B Biointerfaces. 53(1):23–28.
- Lu CX, Zhao TY, Shi XL, Cao SX. 2018. Ecological restoration by afforestation may increase groundwater depth and create potentially large ecological and water opportunity costs in arid and semiarid China. J Cleaner Prod. 176:1213–1222.
- Ma JX, Chen YN, Li WH, Huang X, Zhu CG, Ma XD. 2012. Sap flow characteristics of four typical species in desert shelter forest and their responses to environmental factors. Environ Earth Sci. 67(1):151–160.
- Maseyk KS, Lin T, Rotenberg E, Grunzweig JM, Schwartz A, Yakir D. 2008. Physiology-phenology interactions in a productive semi-arid pine forest. New Phytol. 178(3):603–616.
- Medlyn BE, Dreyer E, Ellsworth D, Forstreuter M, Harley PC, Kirschbaum MUF, Le Roux X, Montpied P, Strassemeyer J, Walcroft A, et al. 2002. Temperature response of parameters of a biochemically based model of photosynthesis. II. A review of experimental data. Plant Cell Environ. 25(9):1167–1179.
- Medrano H, Flexas J, Galmes J. 2009. Variability in water use efficiency at the leaf level among Mediterranean plants with different growth forms. Plant Soil. 317(1-2):17–29.
- Medrano H. 2002. Regulation of photosynthesis of C3 plants in response to progressive drought: stomatal conductance as a reference parameter. Ann Bot. 89(7):895–905.
- Meir P, Levy PE, Grace J, Jarvis PG. 2007. Photosynthetic parameters from two contrasting woody vegetation types in West Africa. Plant Ecol. 192(2):277–287.
- Miao LJ, Moore JC, Zeng FJ, Lei JQ, Ding JL, He B, Cui XF. 2015. Footprint of research in desertification management in China. Land Degrad Develop. 26(5):450–457.
- Midgley GF, Aranibar JN, Mantlana KB, Macko S. 2004. Photosynthetic and gas exchange characteristics of dominant woody plants on a moisture gradient in an African savanna. Global Change Biol. 10(3):309–317.
- Miller, J M, Williams, R J, Farquhar, G D. 2001. Carbon isotope discrimination by a sequence of Eucalyptus species along a subcontinental rainfall gradient in Australia. Funct Ecology. 15(2):222–232. doi:10.1046/j.1365-2435.2001.00508.x.
- Misson L, Tu KP, Boniello RA, Goldstein AH. 2006. Seasonality of photosynthetic parameters in a multi-specific and vertically complex forest ecosystem in the Sierra Nevada of California. Tree Physiol. 26(6):729–741.
- Mitchell, P J, O'grady, A P, Tissue, D T, White, D A, Ottenschlaeger, M L, Pinkard, E A. 2013. Drought response strategies define the relative contributions of hydraulic dysfunction and carbohydrate depletion during tree mortality. New Phytol. 197(3):862–872. doi:10.1111/nph.12064.
- Monteith J, Unsworth M. 2013. Principles of environmental physics: plants, animals, and the atmosphere. Oxford: Academic Press.
- NAMEM. 2013. The National Agency for Meteorology and Environmental Monitoring of Mongolia. Weather data. http://namem.gov.mn/eng/?p=56, accessed September 25.
- Nolan RH, Tarin T, Fairweather KA, Cleverly J, Eamus D. 2017. Variation in photosynthetic traits related to access to water in semiarid Australian woody species. Funct Plant Biol. 44(11):1087–1097.
- Norusis M. 2008. SPSS 16.0 guide to data analysis. Upper saddle River (NJ): Prentice Hall Press.
- Nouvellon Y, Laclau JP, Epron D, Kinana A, Mabiala A, Roupsard O, Bonnefond JM, Le Maire G, Marsden C, Bontemps JD, et al. 2010. Within-stand and seasonal variations of specific leaf area in a clonal Eucalyptus plantation in the Republic of Congo. For Ecol Manage. 259(9):1796–1807.
- Padilla FM, Ortega R, Sanchez J, Pugnaire FI. 2009. Rethinking species selection for restoration of arid shrublands. Basic Appl Ecol. 10(7):640–647.
- Park GE, Lee DK, Kim KW, Batkhuu NO, Tsogtbaatar J, Zhu JJ, Jin Y, Park PS, Hyun JO, Kim HS. 2016. Morphological characteristics and water-use efficiency of Siberian Elm Trees (Ulmus pumila L.) within arid regions of Northeast Asia. Forests. 7(12):280.
- Pivovaroff AL, Pasquini SC, De Guzman ME, Alstad KP, Stemke JS, Santiago LS. 2016. Multiple strategies for drought survival among woody plant species. Funct Ecol. 30(4):517–526.
- Qu JJ, Cao SX, Li GS, Niu QH, Feng Q. 2014. Conservation of natural and cultural heritage in Dunhuang, China. Gondwana Res. 26(3-4):1216–1221.
- Rawat YS, Singh JS. 1988. Structure and function of oak forests in Central Himalaya.1. Dry-matter dynamics. Ann Bot. 62(4):397–411.
- Reich, P B, Ellsworth, D S, Walters, M B, Vose, J M, Gresham, C, Volin, J C, Bowman, W D. 1999. Generality of leaf trait relationships: a test across six biomes. Ecology. 80(6):1955–1969. doi:10.1890/0012-9658(1999)080[1955:GOLTRA]2.0.CO;2.
- Reich, P B, Walters, M B, Ellsworth, D S. 1997. From tropics to tundra: global convergence in plant functioning. Proc Natl Acad Sci U S A. 94(25):13730–13734. doi:10.1073/pnas.94.25.13730.
- Rhodenbaugh EJ, Pallardy SG. 1993. Water stress, photosynthesis and early growth patterns of cuttings of three Populus clones. Tree Physiol. 13(3):213–226.
- Sharkey TD, Bernacchi CJ, Farquhar GD, Singsaas EL. 2007. Fitting photosynthetic carbon dioxide response curves for C3 leaves. Plant Cell Environ. 30(9):1035–1040.
- Su H, Li YG, Liu W, Xu H, Sun OJ. 2014. Changes in water use with growth in Ulmus pumila in semiarid sandy land of northern China. Trees-Struct Function. 28(1):41–52.
- Von Caemmerer S. 2000. Biochemical models of leaf photosynthesis. Collingwood (Victoria, Australia): Csiro publishing.
- Walker AP, Beckerman AP, Gu L, Kattge J, Cernusak LA, Domingues TF, Scales JC, Wohlfahrt G, Wullschleger SD, Woodward FI. 2014. The relationship of leaf photosynthetic traits - V cmax and J max - to leaf nitrogen, leaf phosphorus, and specific leaf area: a meta-analysis and modeling study. Ecol Evol. 4(16):3218–3235.
- Wang XM, Zhang CX, Hasi E, Dong ZB. 2010. Has the Three Norths Forest Shelterbelt Program solved the desertification and dust storm problems in arid and semiarid China? J Arid Environ. 74(1):13–22.
- Wesche K, Walther D, von Wehrden H, Hensen I. 2011. Trees in the desert: reproduction and genetic structure of fragmented Ulmus pumila forests in Mongolian drylands. Flora. 206(2):91–99.
- Wilson KB, Baldocchi DD, Hanson PJ. 2000. Spatial and seasonal variability of photosynthetic parameters and their relationship to leaf nitrogen in a deciduous forest. Tree Physiol. 20(9):565–578.
- Wright IJ, Reich PB, Westoby M. 2001. Strategy shifts in leaf physiology, structure and nutrient content between species of high- and low-rainfall and high- and low-nutrient habitats. Funct Ecology. 15(4):423–434.
- Wullschleger SD. 1993. Biochemical limitations to carbon assimilation in C3 plants—a retrospective analysis of the A/Ci Curves from 109 species. J Exp Bot. 44(5):907–920.
- Xu L, Baldocchi DD. 2003. Seasonal trends in photosynthetic parameters and stomatal conductance of blue oak (Quercus douglasii) under prolonged summer drought and high temperature. Tree Physiol. 23(13):865–877.
- Xu X, Peng GQ, Wu CC, Korpelainen H, Li CY. 2008. Drought inhibits photosynthetic capacity more in females than in males of Populus cathayana. Tree Physiol. 28(11):1751–1759.
- Yan QL, Zhu JJ, Zheng X, Jin CJ. 2015. Causal effects of shelter forests and water factors on desertification control during 2000-2010 at the Horqin Sandy Land region, China. J for Res. 26(1):33–45.
- Yi X, Wang L. 2013. Land suitability assessment on a watershed of Loess Plateau using the analytic hierarchy process. PLoS One. 8(7):e69498.
- Zhang JG, Lei JQ, Wang YD, Zhao Y, Xu XW. 2016. Survival and growth of three afforestation species under high saline drip irrigation in the Taklimakan Desert, China. Ecosphere. 7(5):e01285.
- Zhu GF, Li X, Su YH, Lu L, Huang CL. 2011. Seasonal fluctuations and temperature dependence in photosynthetic parameters and stomatal conductance at the leaf scale of Populus euphratica Oliv. Tree Physiol. 31(2):178–195.