
Abstract
This study investigated the land cover changes, carbon storage dynamics and their underlying socio-economic processes before and after a community forest permit in Bleberan village, Gunungkidul, Indonesia, during 1999–2018. We used a combination of the forest canopy density model, carbon conversion and socio-economic related data to analyze land cover classes in the periods of 1999–2003, 2003–2009, and 2009–2018, representing the phases of several years before community forestry permit, initial phase of community forestry establishment and several years after community forestry permit, respectively. Results showed that at baseline (1999), where illegal logging was started on the ground, the condition of the 40 ha investigated area was dominated by non-forest in the form of open land by 54% with an amounted carbon storage of 1352.62 ton. In the phase of before community forestry permit (1999–2003), when there was continuous illegal logging, the open land rise quickly achieved to 83%, with only 312.09 ton of carbon storage remaining. In the initial phase of community forestry establishment (2003–2009), when the government issued a legalization of community forest, the mixed dryland agriculture shifted to dominate the area by 55%, with the carbon storage being increased to 1840.94 ton. The last phase, several years after community forestry permit (2009–2018), which characterized by active engagement of the community in forest rehabilitation, the area was altered to fully stocked teak plantation forest by 82%, with a carbon storage enhancement of 3379.16 ton or two times higher than that at baseline. Such results are important for the forest community authority and related stakeholder for designing appropriate forest-related policies and supporting REDD + implementation.
Introduction
The world has a total forest area of 4 billion hectares (FAO Citation2020) which play an important role in the carbon cycle (IPCC Citation2001; Karsenty et al. Citation2003). Forests have a function of carbon pool which found in the living biomass and soil and they become sources of carbon when they are deforested and degraded by natural processes or human activities (Karsenty et al. Citation2003). Globally, total carbon stock in forests decreased from 668 giga tons of carbon (GtC) in 1990 to 662 GtC in 2020, as a consequence of the decline in global forest area by 178 million hectare during 1990–2020 (FAO Citation2020). In addition to declined forest area, International Tropical Timber Organization (ITTO) stated that approximately 500 million ha of tropical forest (12% of the total worldwide forest) was degraded in 2000 (ITTO Citation2002). At the country level, Indonesia is an example of tropical country experiencing large-scale deforestation, in which the extent of their deforestation area in early 2000s was the third highest after Brazil and Congo/Zaire (Sunderlin et al. Citation2005). Their forest area declined from 118 million hectares in 1990 to 91.01 million hectares in 2015 (FAO Citation2016). In addition, the state forest land in Indonesia, for example, which was originally primary dry forest, has an estimated carbon storage for national scale of 132.99 ton of Carbon ha−1. Degrading forest land into secondary dry forest, the carbon storage amount will be remain around 98.84 ton of Carbon ha−1 (Tosiani Citation2015). Since forests act as key players of carbon sequestration, it is important to place forests at high priority for protection and conservation (Canadell and Raupach Citation2008).
Tropical deforestation and degradation, generally defined as the substantial decline in forest structure or function over time, is perceived to be an enormous contributor of greenhouse gas emissions (de Andrade et al. Citation2017; Pearson et al. Citation2017). However, it is a key challenge to determine the exact quantity of how much carbon is actually emitted in the short- and long-term from deforestation and degradation activities (Asner et al. Citation2009). In addition, the declined and degraded forest is currently more subtle identified using much higher resolution imagery by the change in forest canopy cover (Mitchell et al. Citation2017). One of the common drivers of deforestation and forest degradation is timber harvesting, either legal or illegal. Furthermore, Ji et al. (Citation2018) used the term “illegal logging” to refer the entire supply and demand process of illegally logged timber. Illegal logging is a significant problem in Indonesia and has disastrous effects on the environment, economy, and society in Indonesia (Obidzinski et al. Citation2006).
In response to the serious impacts of declined and degraded state forest land resulting from illegal logging, the Ministry of Environment and Forestry, the Republic of Indonesia (MoEF RI) was to accelerate community involvement in forest rehabilitation in the form of forest security, business partners, and restoring watersheds (Ministerial Decree P.39/2015). The keyword was formulated into a social forestry strategy, providing legal access, and improving businesses capacity to community management. Furthermore, the Directorate General of Social Forestry and Environmental Partnership within the MoEF RI had allocated a target area by the end of 2019 of 12.7 million hectares of state forest land to community management (Bappenas Citation2015). This program was carried out through permits of management and use of state forest under the schemes of village forest, community forest (Hutan Kemasyarakatan/HKm), people’s timber plantation, customary forest, and company–community partnership forest. It was followed by the Ministerial Decree P.83/2016 to establish the scope, conditions, and licensing procedures for these various schemes.
One of the three social forestry implementations in Indonesia is to resolve conflicts and tenurial in forest areas, where communities around the forest vicinity are granted permit to manage state forest areas (MoEF RI 2018). A number of researchers have emphasized that a parcel of forest land where prolonged conflicts still remained unresolved can be subject to forest degradation (Maryudi et al. Citation2016; Mutolib et al. Citation2017; Riggs et al. Citation2016). HKm, for instance, is meant to provide legal and easy access to farmer groups to collaboratively manage forest resources to improve the welfare of people living in, and around, forest areas, to increase the productivity of the forest, and to preserve the forest and the environment (de Royer et al. Citation2018). Therefore, the permit of Use of Community Forest (Izin Usaha Pemanfaatan Hutan Kemasyarakatan/IUPHKm) is granted for 35 years (renewable for an additional 35 years) over the state forest with protection or production status as long as there are no encumbered rights or permits and the benefits return to the farmer groups.
HKm is mainly implemented to address two objectives, i.e., improving livelihood of local people and forest condition (Santika et al. Citation2017; MoEF RI 2018). Therefore, two important factors which need consideration in assessing such program are the livelihood issues and forest conditions. In recent years, some studies have assessed the livelihood issues, particularly socio-economic impact of HKm implementation in Indonesia (Djamhuri Citation2008; Lestari et al. Citation2015; Mulyadin et al. Citation2016). In regard to forest condition, Forest Canopy Density (FCD) model which consists of bio-physical phenomenon for assessing current status of forest on the basis of canopy cover (Rikimaru et al. Citation2002), is one of remote sensing technique that is able to detect forest cover changes, e.g. deforestation and forest degradation (Nandy et al. Citation2003; Chandrashekhar et al. Citation2005; Muhammad et al. Citation2014; Abdollahnejad et al. Citation2017). In particular, some remote sensing-based studies have also highlighted forest cover changes as an impact of the community forestry implementation in Nepal (Gautam et al. Citation2002; Niraula et al. Citation2013). However, in the context of HKm implementation, it is difficult to generate HKm development processes from remote sensing-based study, and socio economic-based study are therefore needed to study such processes. Meanwhile, socio-economic based-study is difficult to quantify of land cover changes and can never cover large area (Soler and Verburg Citation2010). Therefore, the combination of remote sensing with socio economic-based studies can provide a detailed and complementary comprehension of land cover changes and their underlying socio-economic processes (Soler and Verburg Citation2010).
By combining remote sensing and socio-economic approaches, this study was aimed at investigating the land cover changes and their underlying socio-economic processes in the HKm Bleberan, Gunung Kidul Regency, Province of Daerah Istimewa Yogyakarta (DIY), Indonesia. The following three sequential time periods were taken into consideration: several years before HKm, in the initial phase of HKm establishment and after HKm permit. These three time periods of HKm development were also expected to illustrate the process of forest transition theory (Mather and Needle Citation1998), as highlighted by previous study (Wardhana et al. Citation2012). Finally, the condition of land cover was coupled to the environmental benefits, especially carbon storage to support the Reducing Emissions from Deforestation and Forest Degradation (REDD+) program.
Methods
Study site
This research was conducted in Gunungkidul Regency (), one of the five regencies in the Province of Daerah Istimewa Yogyakarta - DIY (), Indonesia (). Gunungkidul regency () is located geographically between 7°46′ and 8°12′ south latitude and 110°21′–110°50′ east longitude (BPS-Statistics of Gunungkidul Regency Citation2017a). Moreover, the regency has an area of 485.36 km2 or occupies 46.63% of the DIY Province areas and makes Gunungkidul Regency the largest area in DIY Province (BPS-Statistics of Daerah Istimewa Yogyakarta Province Citation2017). Administratively, the regency is divided into 18 districts, and one of them is Playen District, which is located in the west. Playen is the second largest district with an area of 105.26 km2 or 7.9% of the regency (BPS-Statistics of Gunungkidul Regency Citation2017a). There are 13 villages in Playen, one of which is Bleberan village located near the southwestern region with an area of 16.26 km2 or 15.45% of the district (BPS-Statistics of Gunungkidul Regency Citation2017b).
Figure 1. Location of the study area: (a) the community forest of Bleberan (HKm Bleberan) organized into four blocks and presented on Google Earth image in 2006, (b) Gunung Kidul Regency, (c) DIY Province, (d) Indonesia.
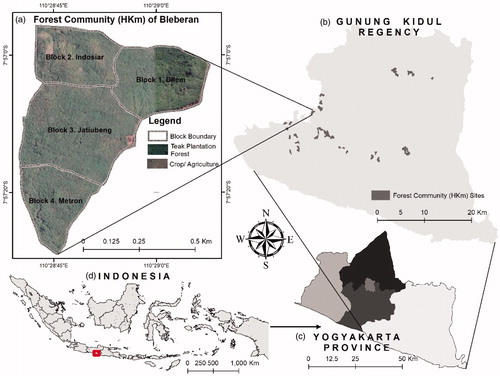
The regional topography of Gunungkidul regency () is indicated by mountainous region or well known as thousand mountains. Three zones have been identified, namely Baturagung (200–700 masl) in the north, Ledoksari (150–200 masl) in the middle, and Karst Gunung Sewu (100–300 masl) in the south. The livelihood of the population depends primarily on the agricultural sector. The land condition is characterized by relatively thin soil layers and often known as batu bertanah or soil-coated stones. The region has an average precipitation of 1881.94 mm/year (2011–2016) with an average number of rainy days of 92.22/year. The average air temperature is 27.7 °C, with the maximum and minimum being 32.4 °C and 23.2 °C, respectively (BPS-Statistics of Gunungkidul Regency Citation2017a).
A number of 35 KTHKms handed IUPHKm Decree which covered an area of 1069.8 hectares and a community participation of 3104 households in Gunungkidul Regency (MoEF RI Citation2018; ). The IUPHKm is spread in 7 of 18 districts. The top three largest HKm areas are located in Playen, Paliyan, and Semanu districts, with the total areas amounting to 243, 233.2, and 209.5 hectares, respectively (MoEF RI 2018). In the district of Playen, eight IUPHKms were handed to KTHKms in 2007 involving 683 households. These IUPHKms are located in 4 of 13 villages, namely Banyusoco, Getes, Bleberan, and Karang Duwet (MoEF RI Citation2018). The study was focused on IUPHKm Bleberan.
The KTHKm Tani Manunggal handed the IUPKHm permit in Bleberan village with an allocated working area of 40 hectares and was managed by the agroforestry system (BPDAS Opak Serayu Progo Citation2011). Accompanied by the forestry service and assisted by the NGO, this area was organized and divided into four blocks. Furthermore, these blocks were identified with arabic numbers and specific names in an anticlockwise order as follows: 1. Dilem, 2. Indosiar, 3. Jatiubeng, and 4. Metron, covering an area of 24.1%, 19.3%, 38.2%, and 18.4%, respectively ().
Data collection
The research was carried out in HKm Bleberan between January and March 2018. HKm permit was issued in 2007 and granted to KTHKm Tani Manunggal. The collected data comprised two components, spatial data and socio-economic data. The main spatial data encompassed multi-temporal satellite imageries and vector boundary of HKm area (), while socio-economic data consisted of data from interview and focus group discussion and relevant documents concerning community forestry. Satellite images were acquisited in the dry season because in tropical country, the cloud-free Landsat images were usually available in the dry season rather than those in the wet season (Liu et al. Citation2015).
Table 1. List of spatial data used for accessing land cover, acquisited in the period of dry season.
Socio-economic data were collected using several techniques to explore the required information. These techniques included interviews with respondents and key persons and focus group discussion. Interviews were conducted with 50 farmers randomly selected from 98 KTHKm members to explore the social capital in the form of motivation (Lee et al. Citation2017). Interviews were also conducted with 7 current formal elite figures in KTHKm, covering the advisor, the two chairpersons, the treasurer, the chief of production facilities, and as well as the chairperson and the treasurer of cooperation section. These interviews were directed to explore about the history of establishment of the KTHKm, the details of the existing critical problems and how to deal with it, and future insights regarding the development and role of KTHKm. In addition, a ground check was carried out by visiting the HKm area and observing the condition of canopy cover at the end of 2018. A single focus group was held once by inviting the 7 interviewed elite figures and 10 selected key persons representing 50 interviewed respondents. Discussion was directed at addressing the following three targets: firstly, to clarify the role of non govermental organizations (NGOs) assistance during the establishment and development of KTHKm, secondly, to confirm the summary of the interview results, and thirdly, to explore their engagement to retain teak timber forest sustainability.
Data analysis
Image pre-processing
Geometric, atmospheric and image normalization were applied to Landsat imageries in pre-processing step. Landsat imageries were geometrically corrected to World Geodetic System (WGS) 1984 datum and Universal Transverse Mercator (UTM) coordinate system Zone 49S using Ground Control Points (GCPs) derived from Indonesian based map. The 1999, 2003 and 2009 images were then registered for 2018 image using the same reference of GCPs. As suggested by Young et al. (Citation2017), atmospheric correction was then performed for registered Landsat images by using ATCOR-3, a tool developed by ERDAS Imagine Software which able to correct atmospheric condition. In order to make images comparable, image normalization was then applied for geographic-atmospheric corrected images because we used multi-temporal images with different sensor under vary of atmospheric conditions (El Hajj et al. Citation2008). Linear regression with ‘band-by-band approach’ to compare pseudo-invariant features (PIFs) – the landscape element which have a nearly constant reflectance value over time (Junior et al. Citation2013), was selected as a method for image normalization. Subset operation with a guide of the HKm Bleberan vector boundary was performed to determine the study area on the corrected images.
Forest canopy density, land cover changes, and carbon storage
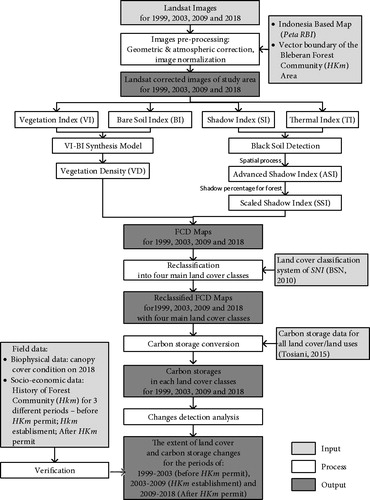
We employed the FCD model derived from various indices (Abdollahnejad et al. Citation2017; Bandyopadhyay et al. Citation2017) as follows: vegetation index (VI), shadow index (SI), thermal index (TI), and bare soil index (BI). These four proposed indices exhibit important characteristics according to the amount of vegetation quantity and bare soil. Abdollahnejad et al. (Citation2017) explained that both VI and SI values have similar behavior and correlate positively with vegetation quantity, where these values increased with the increase in vegetation quantity. In contrast, the TI value decreased with the increase in vegetation quantity. Meanwhile, the BI increased with the increase of bare soil. Using these indices with the proposed formula (), the FCD value was calculated in percentage for each pixel. The FCD Mapper Software was then used to calculate and analyze the FCD value. Based on FCD value in each pixel, we presented the FCD map in selected years, i.e.1999, 2003, 2009, and 2018 in the same period of dry season, representing before HKm program, intitial HKm program, initial HKm permit, and a decade of HKm permit in the 40 ha investigated area, respectively.
Table 2. Formulas/algorithms used to calculate indices in the FCD model.
The mapping of land cover was based on the land cover classification system of Indonesian National Standards (Standar Nasional Indonesia/SNI) No. 7645-2010 developed by the National Standardization Agency (Badan Standarisasi Nasional-BSN Citation2010). Therefore, we proposed a classification scheme comprising four land cover types based on the dominant land cover types and the FCD value in the study area. These four land cover classes were non-forest, open forest, moderately dense forest, and dense forest for the FCD values <10%, 10–40%, 40–70%, and >70%, respectively. Furthermore, we identified land use and calculated the areas of each land cover class, and through carbon storage conversion approach for national scale of the corresponding land cover class (Tosiani Citation2015), the total carbon storage of each land cover class could be estimated accordingly (). Such carbon storage data were determined from forest inventory measurement in 4450 permanent sample plot (PSP) throughout Indonesia during 1996−2013 (Tosiani Citation2015). The conversion value from biomass to carbon is 0.5 (Tosiani Citation2015).
Table 3. Classification of forest canopy density into land cover class and identified land use, and carbon storage estimation using covertion approach of carbon storage for national scale.
Analysis of socio-economic data related to HKm development
Socio-economic data and information on the level of motivation was analyzed in a descriptive narrative (Roslinda et al. Citation2017). In this forum, it was also directed as self-assessment of human resource capacity to meet all applicable requirements and conditions. Alternative solutions were formulated after passing through the participant validation process (Nyumba et al. Citation2018).
A flowchart summarizing the steps involved in the assessment of land cover and carbon storage changes are described in the following .
Figure 2. A flowchart summarizing the steps involved in the assessment of land cover and carbon storage changes in HKm Bleberan.
Results
Forest canopy cover and carbon storage development
At the baseline of investigation in 1999, the land cover condition of the study area was dominated by degraded forest (). About 54% was non-forest in the form of open land, and only approximately 16% was dense forest in the form of secondary forest located in the western part of block 3. The remaining 32% consisted of 19% and 11% of open forest in the form of mixed dryland agriculture and moderately dense forest in the form of plantation forest, respectively (). Therefore, the total capacity of carbon storage in the investigated area amounted to 1352.62 ton of Carbon ().
Figure 3. Forest canopy density map in four different successive years: (a) 1999, (b) 2003, (c) 2009, and (d) 2018.
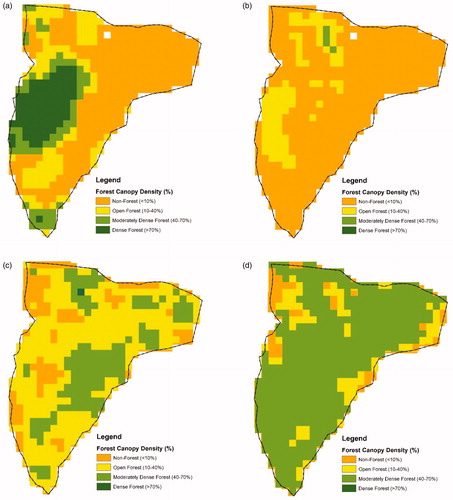
Figure 4. Stacked histogram of land cover and their changes in the 40 ha investigated area for the time periods of 1999–2003, 2003–2009, and 2009–2018.
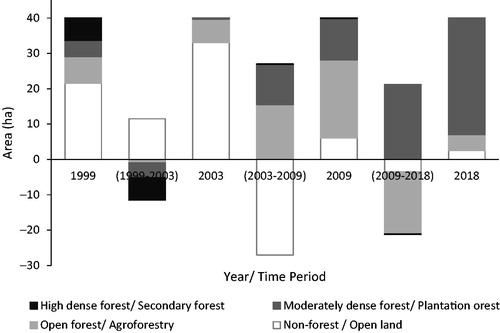
Figure 5. Stacked histogram of carbon storages and their changes in the 40 ha investigated area for the time periods of 1999–2003, 2003–2009, and 2009–2018.
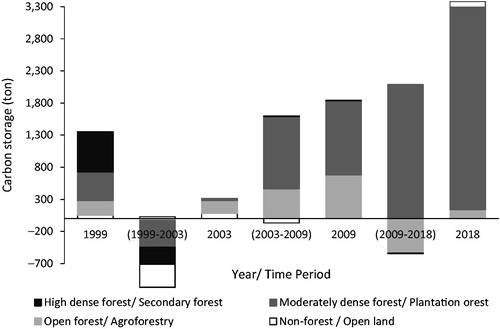
In the period of 1999–2003 (before HKm Permit), the process of forest degradation has occurred continuously till 2001 due to the effects of massive illegal logging/political instability (). Based on interview, this period was also marked by the HKm program socialization by the Forest Service, the issuance of regulations regarding the management of HKm, technical and institutional assistance by NGOs and the establishment of farmer groups as a requirement for obtaining a HKm permit (). As a result of illegal logging at the initial period of HKm, by the year 2003, the total area of non-forest increased rapidly and reached around 83%. The remaining dense forest in 1999 was shifted to open forest in the form of mixed dryland agriculture. Less than 1% of moderate dense forest was found in the form of plantation forest (). Moreover, this period was identified by remarkable changes of land cover to open forest (). With this composition of land cover, the carbon storage amount in the designated area remained at 312.09 ton of Carbon only ().
Figure 6. Timeline of three phases in HKm Bleberan development during 1999–2018 described by related policies (boxes with solid lines) and events/activities (boxes with dashed lines) based on document review, interview and FGD results.
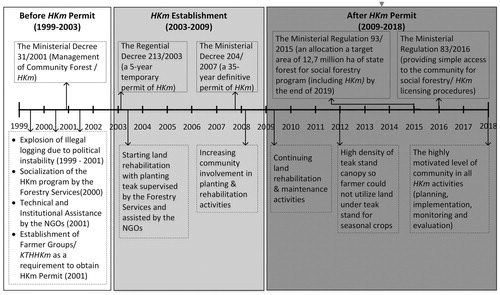
In the period of 2003–2009 (HKm Establishment), the established KTHKm Tani Manunggal obtained temporary HKm permit based on the Regential Decree in 2003. Based on this temporary permit, KTHKm Tani Manunggal began to conduct rehabilitation in their allocated working areas (). After achieving success in performing forest land rehabilitation for five years of evaluation which is supervised by Forestry Service and NGOs, then the KTHKm Tani Manunggal handed the IUPHKm permit by the Ministerial Decree at the end of 2007 (). Giving legal access through issued IUPHKm has indeed accelerated community participation in the implementation of the social forestry program. The performance of the KTHKm was reflected by land cover improvement in 2009 (). Most of the non-forest was changed into open forest in the form of mixed dryland agriculture, which predominantly covered 55.3% of the area and was distributed evenly across the blocks. Therefore, the open land was reduced drastically and remained at around 15.2% only. However, the moderately dense forest in the form of plantation forest increased significantly to 29.3% of the area. Suprisingly, <1% of dense forest was found in block 2 (). With this composition of land cover, the total carbon storage in the allocated working area was remarkably enhanced to 1840.94 ton of Carbon (). This amount was higher than the carbon storage amount at baseline in 1999.
In the period of 2009–2018 (after HKm Permit), the KTHKm Tani Manunggal continuously exhibited good performance in rehabilitating the allocated working area (). Given legal access in the form of an HKm permit for non-timber products by the agroforestry system and the hope of procuring the managed teak timber were the two factors by which the emergence of m otivation of KTHKm was fully involved in the state forest land rehabilitation program. This motivation led to retain and maintain the managed teak forest until the fully stocked teak forest was achieved. Based on the interviews, more than half of KTHHKm members belonged to the highly motivated level. Farmers were actively involved in each stage of investigation, starting from planning, implementation, and monitoring and evaluation of HKm activities. Based on interview, the level of farmers’ motivation was 52%, 46%, and only 2%, representing high, medium, and low categories, respectively. As a result of these condition, most of the open forest in 2009 has been remarkably altered into moderately dense forest in the form of plantation forest for about a decade. Therefore, plantation forest dominated the area and the non-forest was declined accordingly (). In early 2018, the land cover consisted of 82.3%, 11.2%, and 6.5% of plantation forest, mixed dryland agriculture, and open land, respectively (). With this composition, the carbon storage amount approximated to 3379.16 ton of Carbon ().
This amount was two times higher than the amount at baseline in this study.
Discussion
The results indicated that there is a difference in land cover changes under three different time periods of HKm development. In the first period of HKm development (1999–2003), there were a massive change from forest to non-forest (deforestation) that caused by the explosion of illegal logging activities. This finding is inline with previous study which emphasized the highest levels of annual deforestation rates in Indonesia were recorded in the period of 1996−2000, at 3.51 million hectares, which was higher than annual deforestation rate during the period of 2003–2017, at 0.71 million hectares (MoEF Citation2018). Meanwhile, in the last two time period of HKm development (2003–2018), the vegetated area tend to increase gradually. This finding is consistent with previous study (Wardhana et al. Citation2012), which found there is a land transitition from open land to vegetated area (dominated by forest plantation) during 2000–2012 at the all landscape zones in the Gunung Kidul Regency, including Ledok zone, where the study area is located. Another previous study have highlighted the explosion of illegal logging caused by political instability (the fall of Suharto’s regime) Indonesia during the late 1900s (Burgess et al. Citation2012). Based on these facts, it is reasonable that the forest loss within the pre-HKm permit period (1999–2003) was higher than those in other periods (2003–2009 and 2009–2018).
Based on the forest transition theory (Mather and Needle Citation1998), land cover change and land transition in HKm Bleberan can be categorized in several stages. First period (1987–1999) can be categorized into the second stage of forest transition (high deforestation), the second period (2003–2009) is considered to be in the third stage (reducing deforestation and forest cover began to stabilize) and the last period (2009–2018) is classified in the forth stage (reforestation). Wardhana et al. (Citation2012) revealed that current land transition in Gunung Kidul Regency is close to the final stage of the growth process which is equal to the the third stage of the forest transition model by Mather and Needle (Citation1998).
As indicated in the results, the proposed community forestry – HKm in Bleberan village, which is intented to address degraded and deforested land, is considered as a successful program, indicated by an increase in forest cover. As highlighted by previous studies, an increase in forest cover can be used as a biophysical indicator in measuring the success of HKm program (Gautam et al. Citation2002; Niraula et al. Citation2013). This will complement socio-economic indicators, e.g. increased income, increased community welfare, which are often used to assess the success of HKm program (Djamhuri Citation2008; Lestari et al. Citation2015; Mulyadin et al. Citation2016). In case of study area, the combination of appropriate policies, strong institutions (e.g. KTHKm as subject, Forestry services as supervisor, NGOs as technical/institutional assistance), high motivation from the community/farmer (as social modal), accelerate the success of HKm implementation.
Community farmers were highly motivated to participate in HKm program in response to the provided legal access (Acheampong et al. Citation2018) by ministerial decree in 2001. They took the initiative to establish KTHKm covering solidity of members, regular meetings, and involvement in forest management activities. While applying the HKm permit, the KTHKm Tani Manunggal started to rehabilitate the degraded designed forest land. The KTHKm continued to rehabilitate the allocated working area by the agroforestry system of teak as the primary crop based on a temporary permit in 2003 for 5 years. Due to the good performance of rehabilitating the allocated working area, the KTHKm passed an official evaluation of 5 years’ period and finally was given a definitive permission in 2007 for the first period of 35 years. In addition, the KTHKm showed long-term commitment in connection and working with community-based forest management rules. This commitment in the long-term and mutual respect of terms and conditions was the essence of mutual trust in the success of small-scale forest management (Guillén et al. Citation2015).
The land tenure is consequently one of the most important steps to guarantee the success of the HKm program. Baynes et al. (Citation2015) stated that land tenure is the most complex factor determining the success of community forestry. Regional guarantee with certainty of legality leads to comfort and security for managing and making decisions about forest resources (Larson Citation2012). With the agroforestry systems, farmers can obtain annual crop yields for fulfillment of their livelihood. As an obligation, farmers have to maintain teak trees with a long timeframe duration for teak timber to reach harvest age. In addition, Baynes et al. (Citation2015) stated that tenure security is the factor that most influences the members’ motivation of community farmer groups.
KTHKm Tani Manunggal has demonstrated the active engagement of a community for long-term process, starting from teak planting and maintaining it to reduce deforestation. This potential enabling condition (Arts and de Koning Citation2017) led to the success of KTHKm in altering damaged forest land into fully stocked teak plantation forest and eventually enhancing carbon stock (Pelletier et al. Citation2016). In this fully stocked forested area, furthermore, the amount of carbon was stored primarily in the vegetation pools, especially above the ground (Sil et al. Citation2017). This success of forest rehabilitation has contributed to climate change mitigation efforts through the REDD + program, especially in increasing the forest biomass stock and carbon sequestration (Beyene et al. Citation2016).
In accordance with the REDD + case, teak species plays the most important role in carbon storage, wherein the capability of this species to sink the carbon was the highest in contrast to other species such as mahagony, acacia, and sengon (Setiahadi Citation2017). Since 2009, the canopy density increased steadily until the end of 2018. The denser the forest canopy, the greater the average carbon storage (Pandey et al. Citation2014). Furthermore, the availability of information on carbon accumulation rates, carbon removal, carbon prices, and opportunity costs can be used to evaluate the economic feasibility of REDD + in community forests (Pandit et al. Citation2017).
Conclusions
In the first phase of HKm development – several years before HKm permit (1999–2003), which characterized by illegal logging explosion, the remaining dense forest in 1999 was changed to open and non-forest in 2003 followed by a decrease in carbon storages. For the second phase – initial phase of HKm establishment (2003–2009), which marked by obtaining HKm permit, the start of land rehabilitation activity and increased community involvement, there was a change in the most of non-forest area in 2003 to open forest in 2009 which was simultaneously followed by an increase in carbon storages. In the last phase – several years after HKm permit (2009–2018), the highly motivated level of community led to the conversion of the most open forest areas in 2009 to moderate dense forests in 2018 followed by an increase in carbon storages.
The lesson learnt from this study is that the combination of appropriate policies, strong institutions (e.g. KTHKm as subject, Forestry services as supervisor, NGOs as technical/institutional assistance), highly level of participation and motivation from the community/farmer (as social modal), accelerate the success of HKm implementation The success of HKm which is biophysically characterized by an increase of forest cover has contributed to climate change mitigation efforts through the REDD + program, especially in increasing the forest biomass stock and carbon sequestration.
Overall, our study demonstrated that the complementary use of remote sensing, carbon conversion and socio-economic data, has been proved useful for describing the phases of community forestry/HKm development through some indicators, namely land use changes, carbon dynamics and the underlying socio-economic processes. Such data and information are important for the HKm authority and related stakeholder in prioritizing actions for designing appropriate forest-related policies and supporting REDD + implementation.
Disclosure statement
No potential conflict of interest was reported by the author(s).
References
- Abdollahnejad A, Panagiotidis D, Surový P. 2017. Forest canopy density assessment using different approaches–review. J Sci. 63:106–115.
- Acheampong EO, Agyeman KO, Amponsah O. 2018. The motivation for community participation in forest management: the case of Sefwi-Wiawso forest district. Int Forest Rev. 20(1):1–17.
- Arts A, de Koning J. 2017. Community forest management: an assessment and explanation of its performance through QCA. World Dev. 96:315–325.
- Asner GP, Rudel TK, Aide TM, Defries R, Emerson R. 2009. A contemporary assessment of change in humid tropical forests. Conserv Biol. 23(6):1386–1395.
- Bappenas - Badan Perencanaan Pembangunan Nasional 2015. Rencana Pembangunan Jangka Menengah Nasional (RPJMN) Tahun 2015–2019. Bappenas. Jakarta.
- Bandyopadhyay J, Mondal I, Maiti KK, Biswas A, Acharyya N, Sarkar S, Paul A, Das P. 2017. Forest canopy density mapping for Natural Resource Management of Jangalmahal Area, India, using geospatial technology. Int J Curr Res. 9:56073–56082.
- Baynes J, Herbohn J, Smith C, Fisher R, Bray D. 2015. Key factors which influence the success of community forestry in developing countries. Global Environ Change. 35:226–238.
- Beyene AD, Bluffstone R, Mekonnen A. 2016. Community forests, carbon sequestration and REDD+: evidence from Ethiopia. Envir Dev Econ. 21(2):249–272.
- BPDAS Serayu Opak Progo 2011. Profil Kelompok Tani HKm DIY. Yogyakarta: BPDAS SOP.
- BPS–Statistics of Daerah Istimewa Yogyakarta Province 2017. Provinsi Daerah Istimewa Yogyakarta dalam Angka (Daerah Istimewa Yogyakarta Province in Figures). Yogyakarta Province: BPS-Statistic of D.I.
- BPS–Statistics of Gunungkidul Regency 2017a. Kabupaten Gunungkidul dalam Angka (Gunungkidul Regency in Figures). Yogyakarta: BPS-Statistics of Gunungkidul Regency.
- BPS–Statistics of Gunungkidul Regency 2017b. Kecamatan Playen dalam Angka (Playen District in Figures). Yogyakarta: BPS-Statistics of Gunungkidul Regency.
- BSN – Badan Standarisasi Nasional. 2010. Klasifikasi penutup lahan. Jakarta: Badan Standarisasi Nasional.
- Burgess R, Hansen M, Olken BA, Potapov P, Sieber S. 2012. The Political Economy of Deforestation in the Tropics. Q J Econ. 127(4):1707–1754.
- Canadell JG, Raupach MR. 2008. Managing forests for climate change mitigation. Science. 320(5882):1456–1457.
- Chandrashekhar MB, Saran S, Raju PLN, Roy PS. 2005. Forest canopy density stratification: how relevant is biophysical spectral response modeling approach? Geocarto Int. 20(1):15–21. http://dx.doi.org/10.1080/10106040508542332.
- de Andrade RB, Balch JK, Parsons AL, Armenteras D, Roman-Cuesta RM, Bulkan J. 2017. Scenarios in tropical forest degradation: carbon stock trajectories for REDD+. Carbon Bal Manag. 12(1):6.
- de Royer S, van Noordwijk M, Roshetko JM. 2018. Does community-based forest management in Indonesia devolve social justice or social costs? Int Forest Rev. 20(2):167–180.
- Djamhuri TL. 2008. Community participation in a social forestry program in Central Java, Indonesia: the effect of incentive structure and social capital. Agroforest Syst. 74(1):83–96.
- FAO 2016. The state of the world’s forests 2016 – forests and agriculture: land-use challenges and opportunities. Rome: FAO.
- FAO 2020. The state of the world’s forests 2020 – forests, biodiversity and people. Rome: FAO.
- Gautam AP, Webb EL, Eiumnoh A. 2002. GIS assessment of land use/land cover changes associated with Community Forestry Implementation in the Middle Hills of Nepal. Mt Res Dev. 22(1):63–69.
- Guillén LA, Wallin I, Brukas V. 2015. Social capital in small-scale forestry: a local case study in Southern Sweden. For Policy Econ. 53:21–28.
- El Hajj M, Bégué A, Lafrance B, Hagolle O, Dedieu G, Rumeau M. 2008. Relative radiometric normalization and atmospheric correction of a SPOT 5 time series. Sensors (Basel). 8(4):2774–2791. http://dx.doi.org/10.3390/s8042774.
- IPCC - Intergovernmental Panel on climate change. 2001. Third Assessment Report - climate change 2001. In: Houghton JT, Ding Y, Griggs DJ, Noguer M, van der Linden PJ, Xiaosu D, editors. Climate change 2001: The Scientific Basis Contribution of Working Group I to the Third Assessment Report of the Intergovernmental Panel on climate change (IPCC). Cambridge (UK): Cambridge University Press. p. 944.
- ITTO 2002. ITTO guidelines for the restoration, management and rehabilitation of degraded and secondary tropical forests. ITTO Policy Development Series No. 13. Japan: Yokohama.
- Ji Y, Ranjan R, Truong C. 2018. Determinants of illegal logging in Indonesia: an empirical analysis for the period 1996–2010. J Sust For. 37(2):197–220.
- Junior OAC, Guimarães R, Silva N, Gillespie A, Gomes R, Silva C, de Carvalho A. 2013. Radiometric normalization of temporal images combining automatic detection of pseudo-invariant features from the distance and similarity spectral measures, density scatterplot analysis and robust regression. Remote Sen. 5(6):2763–2794. http://dx.doi.org/10.3390/rs5062763.
- Karsenty A, Blanco C, Dufour T. 2003. Instruments related to The United Nations Framework convention on climate change and their potential for Sustainable Forest Management in Africa. Forests and Climate Change Working Paper 1. Rome: FAO. Available at http://www.fao.org/3/ac836e/AC836E03.htm.
- Larson AM. 2012. Tenure rights and access to forests: A training manual for research. Bogor (Indonesia): CIFOR.
- Lee Y, Rianti IP, Park MS. 2017. Measuring social capital in Indonesian community forest management. Forest Sci Technol. 13(3):133–141.
- Lestari S, Kotani K, Kakinaka M. 2015. Enhancing voluntary participation in community collaborative forest management: a case of Central Java, Indonesia. J Environ Manage. 150:299–309.
- Liu J, Heiskanen J, Aynekulu E, Pellikka PKE. 2015. Seasonal Variation of Land Cover Classification Accuracy of Landsat 8 Images in Burkina Faso. The International Archives of the Photogrammetry, Remote Sensing and Spatial Information Sciences, Vol. XL-7/W3, 2015. 36th International Symposium on Remote Sensing of Environment; May 11–15; Berlin, Germany.
- Maryudi A, Citraningtyas ER, Purwanto RH, Sadono R, Suryanto P, Riyanto S, Siswoko BD. 2016. The emerging power of peasant farmers in the tenurial conflicts over the uses of state forestland in Central Java, Indonesia. For Policy Econ. 67:70–75.
- Mather AS, Needle CL. 1998. The forest transition. Area. 30(2):117–379.
- Mitchell AL, Rosenqvist A, Mora B. 2017. Current remote sensing approaches to monitoring forest degradation in support of countries measurement, reporting and verification (MRV) systems for REDD+. Carbon Bal Manag. 12(1):9.
- MoEF RI. 2018. Program Perhutanan Sosial dan Kemitraan Lingkungan. Disampaikan oleh Kepala Bagian Program dan Evaluasi Kepala Bagian Program dan Evaluasi. Sekretariat Direktorat Jenderal Perhutanan Sosial dan Kemitraan Lingkungan; 13 Januari 2018; Di Yogyakarta.
- Muhammad A, Prasetyo LB, Dan Kartono AP. 2014. Pemetaan Perubahan Forest Canopy Density di KPH Kuningan. Prosiding Seminar Nasional Penginderaan Jauh 2014. Bogor, Indonesia.
- Mulyadin RM, Surati S, Ariawan K. 2016. Kajian Hutan Kemasyarakatan Sebagai Sumber Pendapatan: Kasus Di Kabupaten Gunungkidul, Yogyakarta (Study of community forest as source of income: a case in Gunungkidul Regency, Yogyakarta). Jurnal Penelitian Sosial dan Ekonomi Kehutanan. 13(1):13–23.
- Mutolib A, Yonariza M, Ismono H. 2017. Forest ownership conflict between a local community and the state: a case study in Dharmasraya, Indonesia. J Trop For Sci. 29:163–171.
- Nandy S, Joshi PK, Das KK. 2003. Forest canopy density stratification using biophysical modeling. Indian Soc Remote Sens. 31(4):291–297.
- Niraula RR, Gilani H, Pokharel BK, Qamer FM. 2013. Measuring impacts of community forestry program through repeat photography and satellite remote sensing in the Dolakha district of Nepal. J Environ Manage. 126:20–29.
- Nyumba TO, Wilson K, Derrick CJ, Mukherje N. 2018. The use of focus group discussion methodology: insights from two decades of application in conservation. Methods Ecol Evol. 9(1):20–32.
- Obidzinski K, Andrianto A, Wijaya C. 2006. Timber smuggling in Indonesia: critical or overstated problem?: Forest governance lessons from Kalimantan. Bogor (Indonesia): CIFOR.
- Pandey SS, Maraseni TN, Cockfield G. 2014. Carbon stock dynamics in different vegetation dominated community forests under REDD+: a case from Nepal. For Ecol Manage. 327:40–47.
- Pandit R, Neupane PR, Wagle BH. 2017. Economics of carbon sequestration in community forests: Evidence from REDD + piloting in Nepal. JFE. 26:9–29.
- Pearson TRH, Brown S, Murray L, Sidman G. 2017. Greenhouse gas emissions from tropical forest degradation: an underestimated source. Carbon Bal Manag. 12(1):3.
- Pelletier J, Gélinas N, Skutsch M. 2016. The place of community forest management in the REDD + Landscape. Forests. 7(12):170.
- Riggs RA, Sayer J, Margules C, Boedhihartono AK, Langston JD, Sutanto H. 2016. Forest tenure and conflict in Indonesia: contested rights in Rempek Village, Lombok. Land Use Policy. 57:241–249.
- Rikimaru A, Roy PS, Miyateke S. 2002. Tropical forest cover density mapping. Trop Ecol. 43:39–47.
- Roslinda E, Ekyastuti W, Kartikawati SM. 2017. Social capital of community forest management on Nusapati Village, Mempawah District, West Kalimantan, Indonesia. Biodiversitas. 18(2):548–554.
- Santika T, Meijaard E, Budiharta S, Law EA, Kusworo A, Hutabarat JA, Indrawan TP, Struebig M, Raharjo S, Huda I, et al. 2017. Community forest management in Indonesia: avoided deforestation in the context of anthropogenic and climate complexities. Global Environ Change. 46 (2017):60–71.
- Setiahadi R. 2017. How significant is the existence of forest community contribution in GHG emissions reduction? J Eng Appl Sci. 12:4826–4830.
- Sil Â, Fonseca F, Gonçalves J, Honrado J, Marta-Pedroso C, Alonso J, Ramos M, Azevedo JC. 2017. Analysing carbon sequestration and storage dynamics in a changing mountain landscape in Portugal: insights for management and planning. Int J. Biodivers Sci Ecosyst Serv Manage. 13(2):82–104.
- Soler LS, Verburg PH. 2010. Combining remote sensing and household data for regional scale analysis of land cover change in Brazilian Amazon. Reg Environ Change. 10(4):371–386.
- Sunderlin WD, Angelsen A, Belcher B, Burgers P, Nasi R, Santoso L, Wunder S. 2005. Livelihoods, forests, and conservation in developing countries: an overview. World Dev. 33(9):1383–1402.
- Tosiani A. 2015. Buku Kegiatan Serapan dan Emisi Karbon. Direktorat Inventarisasi dan Pemantauan Sumber Daya Hutan Direktorat Jendral Planologi Kehutanan dan Tata Lingkungan Kementerian Lingkungan Hidup. Jakarta.
- Wardhana W, Sartohadi J, Rahayu L, Dan Kurniawan A. 2012. Analisis Transisi Lahan di Kabupaten Gunung Kidul dengan Ciitra Penginderaan Jauh multi-temporal. Jurnal Ilmu Kehutanan. VI(2):89–102.
- Young NE, Anderson RS, Chignell SM, Vorster AG, Lawrence R, Evangelista PH. 2017. A survival guide to Landsat preprocessing. Ecology. 98(4):920–932.