
 ?Mathematical formulae have been encoded as MathML and are displayed in this HTML version using MathJax in order to improve their display. Uncheck the box to turn MathJax off. This feature requires Javascript. Click on a formula to zoom.
Abstract
This study aimed to investigate the effect of suppressing transpiration on the physiological characteristics of trees and identify suitable indicators to assess tree vitality. Three seedlings of Zelkova serrata were used: a control, a unit treated on the upper sides of the leaves (TU), and a unit treated on double sides of the leaves (TD). Changes in photosynthetic rate, transpiration rate, sap velocity, and bark temperature following the suppression of transpiration were measured. The transpiration rate and other physiological characteristics of TU were not significantly different from those of the control except for photosynthetic rate. However, TD showed a significantly lower photosynthetic rate, transpiration rate, and sap velocity compared to the control. The bark temperature of TD was not significantly higher than that of the control and TU. Our findings indicate that photosynthetic rate and sap velocity were positively correlated with transpiration rate, whereas bark temperature was negatively correlated. Furthermore, photosynthetic rate showed the most significant linear relationship with transpiration rate, suggesting the photosynthetic rate is a suitable physiological indicator to evaluate the vitality of Z. serrata.
Introduction
Vitality has been considered as the tree’s ability to grow under the condition the system finds itself (Shigo Citation1991; Martinez-Trinidad et al. Citation2010). It has been used to evaluate the health of woody plants (Ferretti Citation1997; Song Citation2014). Assessing tree vitality is important not only for the creation of green landscapes and afforestation but also for conservation and restoration. Tree vitality assessments are mostly based on the quantification of trees diagnosed with pests or the management of wood production (Song Citation2014). For example, damage to crown or branches or tree growth in height or diameter are measured for vitality assessment. Such an assessment method can easily evaluate items and criteria but provides qualitative results, which are often led by the evaluator's subject (Song Citation2014). Therefore, tree vitality assessments need to be based on quantitative and objective indicators, implying the need for researchers to identify simple and reliable indicators of tree vitality. A common method for tree vitality assessments is to measure the electrical resistance of cambium in the tree trunk using a Shigometer (Kim, Park, et al. Citation2002; Chae et al. Citation2012; Hwang and Kim Citation2016). Other methods include measuring the decay state of the tree trunk using sound waves (Song et al. Citation2001; Kang et al. Citation2014), assessing water stress using thermal imaging technology (Lee et al. Citation2019), or measuring chlorophyll contents and photosynthesis in assimilation organs (Maxwell and Johnson Citation2000; Xu and Baldocchi Citation2003).
Meanwhile, common limitations of such quantitative studies include discrepancies in assessments between individual measurement values and evaluators, as well as inconsistencies in variations in measured indicators (Martinez-Trinidad et al. Citation2010; Song Citation2014). According to Song (Citation2014), such inconsistencies arise because the conditions and factors of trees reflected by each physiological indicator vary, indicating that a single indicator cannot accurately represent tree vitality.
Transpiration is the first sign that plants react under environmental stresses such as drying, low temperature, and heat (Jia et al. Citation2002; Christmann et al. Citation2007). Transpiration is known to influence sap velocity (Han and Kim Citation1996). Jung et al. (Citation2014) compared crop productivity according to transpiration rate by inhibiting leaf transpiration using a physical spray-coating treatment; their results suggest that transpiration is directly related to plant vitality.
In this study, we investigated the photosynthetic rate, sap velocity, and bark temperature after inhibiting transpiration in Zelkova serrata. We aimed to find a suitable indicator for tree vitality assessment using transpiration of plants. Since Z. serrata is known for its rapid growth, the tree species is considered a suitable tree material for this experiment to evaluate vitality. Moreover, the relationships between transpiration rate and each physiological indicator were examined.
Materials and methods
Tree materials
A wild-type clone of Z. serrata was selected as the experimental material. Three 3-year-old seedlings were measured as 1.14 ± 0.02 m and 1.06 ± 0.12 cm in height and root collar diameter, respectively.
Transpiration inhibition
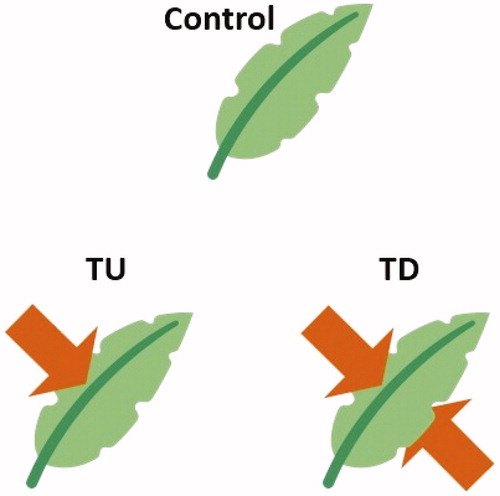
A transpiration inhibitor (Cloudcover; Easy Gardener Products, Texas, USA) was used to control tree vitality. The inhibitor forms a thin film on the surface of the sprayed leaves, thereby decreasing the plant's transpiration rate. After diluting the inhibitor with tap water in a 1:10 ratio, 400 ml was sprayed at 08:00 using a compressed sprayer as follows: 200 ml of the inhibitor were sprayed on the upper sides of the leaves of Z. serrata only (TU), whereas the remaining 200 ml were sprayed on both sides of the leaves (TD) (). One control tree was not treated with the transpiration inhibitor. This experiment was conducted outdoors in Sangju for smooth transpiration in clear weather from 09:00 to 18:00 on 26 September 2019.
Figure 1. Schematics of transpiration inhibition treatments used in this study (Control: control plot, TU: treatment applied on the upper sides of the leaves, TD: treatment applied on double sides of the leaves).
Weather data measurement
We measured the light intensity, temperature, and relative humidity on the day of the experiment. Light intensity was measured using a quantum sensor (Apogee Instruments, Logan, Utah, USA) and an automatic data logger (MSTL Mini Logger; STA, Anyang, Korea). Temperature and humidity were measured at 1-min intervals between 09:00 and 18:00 by connecting a temperature and humidity sensor (STL_T/RH; STA) mounted on a portable instrument shelter to the automatic data logger.
Measurement of photosynthetic rate, transpiration rate, and stomatal conductance
This experiment was conducted from 09:00 to 18:00 on 26 September 2019. Photosynthetic rate, transpiration rate, and stomatal conductance were measured using a portable photosynthesis meter (Li-6400XT; Li-Cor Biosciences, Lincoln, Nebraska, USA), equipped with an LED light source (6400-02; Li-Cor Biosciences) and a CO2 injector system (6400-01; Li-Cor Biosciences). This system enabled researchers to artificially control light intensity, CO2 concentration, and humidity. For the measurement, the air flow rate entering the leaf chamber of Li-6400XT was adjusted to 500 mmol s−1, and CO2 concentration was adjusted to 400 mmol mol−1 (Kim et al. Citation2001). A quantum sensor was attached to Li-6400XT to detect changes in light intensity and allow the LED light source to synchronize as an external light source in the leaf chamber. We used this method to measure the photosynthetic intraday response under the same conditions of sunlight from 09:00 to 18:00. The photosynthetic rate, transpiration rate, and stomatal conductance were measured every 15 min and the plant’s water use efficiency (WUE = Pn/Tr) for photosynthesis was calculated using the ratio of transpiration rate (Tr) and photosynthetic rate (Pn) (Kim, Kim, et al. Citation2002a).
Sap velocity measurement
Sap velocity was measured using a sap flow meter (SFM; ICT, New South Wales, Australia) using the heat ratio method based on the heat pulse (Burgess et al. Citation2001). We drilled three holes, 5-mm apart in the center of stem approximately 10 cm above the roots, and installed the heat probe and two temperature sensing probes. The three probes were installed equally spaced on sapwood and heat pulses were emitted from a heater probe located in the middle. The emitted heat pulse raises the temperature of the sap in vessels, which is detected by heat sensors located at the upper and lower probes. Sap velocity was calculated using the detected temperature value (), thermal diffusivity (
), and distance between the sensors (
) as follows (Marshall Citation1958; Burgess et al. Citation2001):
Measurements were performed at 5-min intervals from 09:00 to 18:00. The exposed probe outside of the stem was wrapped with foil to minimize temperature interference caused by radiant heat, direct sunlight, and rainfall.
Bark temperature measurement
The temperature measurement of Z. serrata bark was performed using an infrared camera (FLIR T420; FLIR Systems, Wilsonville, Oregon, USA). To avoid thermal interference of SFM heater probe, a point located 10 cm above the probe of sap velocity was marked. Temperature was recorded every hour from 09:00 to 18:00 on 26 September 2019. Thermal images were taken at a distance of 1 m from each treatment zone to allow for better focus. The thermal image was corrected by inputting ambient temperature and emissivity values. We used the FLIR Tools (ver. 5.13) to calculate the bark temperature after post-processing the thermal images (Kim et al. Citation2016).
Data analysis
All analyses were conducted using a software (SPSS version 21.0; SPSS, Chicago, IL, USA). We analyzed the correlation between the transpiration rate and photosynthetic rate, stomatal conductance, WUE, sap velocity, and bark temperature. Differences in treatment plots were analyzed using Pearson's correlation coefficients. The statistical significance was set at p < 0.05.
Results
Weather data
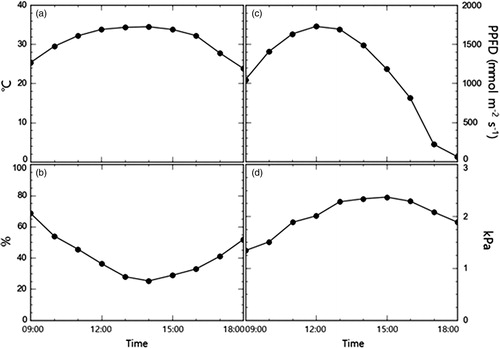
The maximum temperature on the experiment day (26 September 2019) was 34.5 °C with an average of 28.8 ± 7.2 °C (). Average relative humidity was 49.3 ± 25.3%. The maximum and average light intensity were 1729.4 and 1007.0 ± 591.8 mmol m−2 s−1, respectively. Average vapor pressure deficit was 1.9 ± 0.4 kPa.
Figure 2. Changes in environmental factors during experiment day, (a) temperature, (b) relative humidity, (c) light intensity (PPFD: photosynthetic photon flux density) and (d) vapor pressure deficit.
Transpiration rate and stomatal conductance
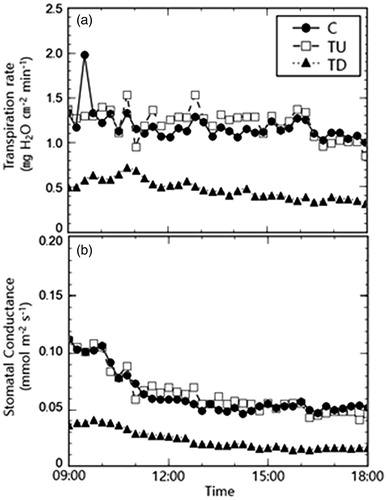
Transpiration rate and stomatal conductance of each treatment plot with time are shown in the following graph (). The average transpiration rate was 1.23 ± 0.17, 1.18 ± 0.16, 0.47 ± 0.10 mg H2O cm−2 min−1 for the control, TU, and TD treatments, respectively (). Meanwhile, the average stomatal conductance was 0.07 ± 0.02, 0.07 ± 0.02, and 0.03 ± 0.01 mmol m−2 s−1 for the control, TU, and TD treatments, respectively (). TD showed a significantly lower rate of transpiration and stomatal conductance than the control and TU (p < 0.001), respectively.
Figure 3. Comparison of daily patterns in (a) transpiration rate and (b) stomatal conductance in the three plots.
Photosynthetic rate
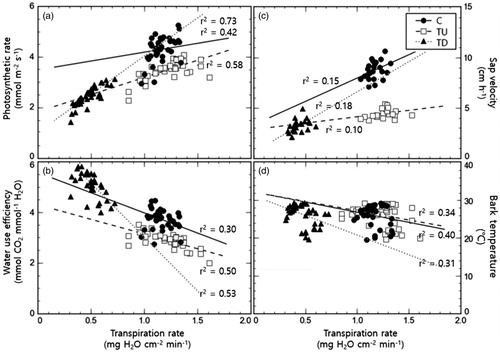
Diurnal changes in each plot’s photosynthetic response treated with a transpiration inhibitor are shown in . The average photosynthetic rate of the control was 4.31 ± 0.50 mmol m−2 s−1, which was significantly higher than TU and TD (p < 0.001), with recorded values of 3.50 ± 0.36 and 2.45 ± 0.37 mmol m−2 s−1, respectively. The photosynthetic rate of TU was also higher than that of TD (p < 0.001). Our correlation analysis showed a positive linear relationship between photosynthetic rate and transpiration rate with corresponding determination coefficients (r2) of 0.42, 0.58, and 0.73 for the control, TU, and TD, respectively ().
Figure 4. Changes in the physiological responses of Zelkova serrata with different transpiration inhibition treatments. Variables recorded were (a) photosynthetic rate, (b) water use efficiency (WUE), (c) sap velocity, and (d) bark temperature.
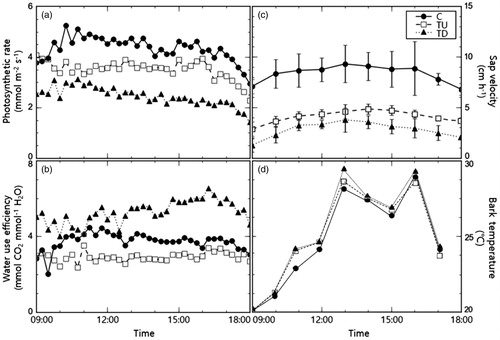
Figure 5. Correlation graphs between transpiration rate and each physiological response investigated in this study. The effects of inhibiting the transpiration rate of Zelkova serrata on (a) photosynthetic rate, (b) water use efficiency, (c) sap velocity, and (d) bark temperature.
Water use efficiency
The average WUE of TD was 5.26 ± 0.61 mmol CO2 mmol−1 H2O, which was significantly higher than that of the control and TU, at 3.70 ± 0.46 and 2.88 ± 0.29 mmol CO2 mmol−1 H2O, respectively (p < 0.001; ). The WUE of TU was lower than that of the control (p < 0.001). Our correlation analysis showed a negative linear relationship with WUE and transpiration rate, albeit not statistically significant (; r2 = 0.30, 0.50, 0.53).
Sap velocity
The sap velocity was highest in the control (8.35 ± 1.23 cm/h), whereas TU and TD averaged 4.02 ± 0.88 and 2.75 ± 1.05 cm/h, respectively: significantly lower than that of the control (p < 0.001; ). TU's sap velocity was statistically higher than TD (p < 0.01). In all treatments, we observed a positive linear relationship between sap velocity and transpiration rate, albeit with a low statistical significance (; r2 = 0.15, 0.10, 0.18).
Bark temperature
While the bark temperature for the plants in both treatments (TU and TD: 25.1 ± 3.7 and 25.3 ± 3.9 °C, respectively) were higher than that of the control (25.0 ± 3.7 °C), it was not statistically significant (p > 0.05; ). Also, there was no statistical difference between the TU and TD (p > 0.05). There was no significant correlation between bark temperature and transpiration rate (; r2 = 0.40, 0.34, 0.31). The difference in atmosphere and bark temperature also showed the lowest in the control compared to the two treatments, which was not statistically significant ().
Table 1. Temperature changes between tree bark and atmosphere during the day in each of the plots (± standard deviation).
Discussion
This study provided a physiological basis of evaluating tree characteristics for vitality assessment of Z. serrata. Following artificial inhibition of foliar transpiration, we traced the temporal progress of physiological characteristics of the tree species under different transpiration regimes. The photosynthetic rate, which was highly correlated with the transpiration rate, is considered a suitable parameter for vitality assessment. While WUE, sap velocity and bark temperature showed responses to the transpiration inhibition, they were not considered appropriate for vitality assessment due to the low correlations with the transpiration inhibition.
Using Cloudcover, we artificially inhibited foliar transpiration, decreasing the transpiration rate and stomatal conductance. We suppressed the transpiration in TU; however, the transpiration rate and stomatal conductance of TU were similar to those of the control. Stomata may be present at the upper or only the lower surface of the leaves depending on the plant species. The stomata of Z. serrata are known to exist on the lower surface of the leaves (Wang et al. 2001). Due to the stomatal distribution, TU appears to have avoided the effect of transpiration suppression, exhibiting physiological parameters similar to the control.
The stomatal conductance of the control and TU was high due to the high demand for CO2 inside the leaves in the morning with high incident light and photosynthetic activity. Stomata of TD were coated with Cloudcover, showing relatively similar stomatal conductance from morning to afternoon. The photosynthetic rate of TU decreased, even though the transpiration rate and stomatal conductance of the TU were not significantly different from those of the control. According to Han et al. (Citation2007), the stomatal conductance is less affected by light intensity than photosynthetic rate. The upper surface of the TU is coated by Cloudcover, which did not block the stomata, but seems to have reflected some light, apparently inhibiting photosynthesis. While the stomatal conductance and photosynthetic rate are closely related, stomatal conductance is not necessarily an important factor in controlling photosynthetic rate (Farquhar and Sharkey Citation1982; Jung et al. Citation2014). However, unlike the progress observed for photosynthetic rate, the WUE showed a negative linear relationship with transpiration rate, albeit not statistically significant. A possible explanation for this could be that transpiration increased more slowly than the photosynthetic rate (Han et al. Citation2007).
We expected that if the vitality deteriorates, the sap velocity decreases. The decrease in the sap velocity in the treatment plots showed that the transpiration rate and the sap transfer were linked, as observed by Han and Kim (Citation1996), Wullschleger et al. (Citation2001). However, contrary to our expectations, the sap velocity of the treatment plots was reduced, but it was not significantly correlated with the transpiration rate. Although there was no difference in the transpiration rate between the control and TU, the difference in the sap velocity was found. The plant treated with TU had lower WUE than the control, which may support the reduced sap velocity of TU. Since water is known to directly affect photosynthesis (Han and Kim Citation1993; Kozlowski and Pallardy 1996), we expected that variations in WUE could influence the photosynthetic rate and sap velocity. However, TD showed the lowest sap velocity while the WUE was higher than other treatment plots. This may be attributed to that transpiration increased more slowly than the photosynthetic rate (Han et al. Citation2007). WUE tends to decrease as the transpiration increases because the more active the transpiration is, the more moisture is lost. In other words, clogging of the stomata by Cloudcover reduced the transpiration of TD, which reduced water loss compared to the control and TU. WUE increases as transpiration increases; however, it gradually decreases at some point (Yoo et al. Citation2009). As a result, the WUE of TD increased, but the tension to pull up the water of the vessel would have decreased as the transpiration decreased. The reason why the sap velocity was not correlated with the transpiration is considered to be a problem caused by the lack of consideration of transpiration of plant tissues, wetting stress and climatic factors that affect the movement of sap and leaf transpiration (Aroca et al. Citation2001; Jung et al. Citation2014).
Contrary to the sap velocity, we expected that the bark's temperature would increase as the vitality deteriorated. Stomatal control is considered as the main controlling factors of water flow in plants (Jones Citation1992; Bacelar et al. Citation2007). Stomatal closure by Cloudcover was assumed to slow down sap transfer. It was expected that the faster the sap velocity, the better the cooling effect and the temperature would decrease. The results showed the difference in the sap velocity due to the control of transpiration. However, there was no significant difference in bark temperature between treatment plots. Tissue transpiration occurs when there is an imbalance between the water absorption of roots and the transpiration action of leaves (Aroca et al. Citation2001, Jung et al. Citation2014). In this work, artificial inhibition of transpiration is assumed to have caused tissue transpiration. In the TD with reduced transpiration rate, tissue transpiration could be activated, and the bark temperature was not significantly different from the control. Bark temperature was negatively correlated with increasing transpiration rate in all treatments, possibly because transpiration is the main driver of sap velocity, which influences bark temperature (Han and Kim Citation1996). However, the bark temperature and the transpiration were not significantly correlated, suggesting that bark temperature was also affected by the thickness of sapwood and bark, solar radiation, and long wave radiation than by the cooling effect of sap movement caused by transpiration.
Conclusion
This study showed daily progress of physiological responses of Z. serrata to artificial inhibition of foliar transpiration. It suggests that the photosynthetic rate would be an appropriate indicator for the evaluation of tree vitality. Other physiological characteristics such as WUE, sap velocity and bark temperature had low correlation with the transpiration rate, making them difficult to use as indicators of vitality assessment. Further works await the elaborate considerations of these physiological parameters in allied tree species under various environment conditions.
Acknowledgments
We thank Junhyung Park and Jeongin Kim for their assistance.
Disclosure statement
No potential conflict of interest was reported by the author(s).
References
- Aroca R, Tognoni F, Irigoyen JJ, Sánchez-Díaz M, Pardossi A. 2001. Different root low temperature response of two maize genotypes differing in chilling sensitivity. Plant Physiol Biochem. 39(12):1067–1073.
- Bacelar EA, Moutinho-Pereira JM, Gonçalves BC, Ferreira HF, Correia CM. 2007. Changes in growth, gas exchange, xylem hydraulic properties and water use efficiency of three olive cultivars under contrasting water availability regimes. Environ Exp Bot. 60(2):183–192.
- Burgess SS, Adams MA, Turner NC, Beverly CR, Ong CK, Khan AA, Bleby TM. 2001. An improved heat pulse method to measure low and reverse rates of sap flow in woody plants. Tree Physiol. 21(9):589–598.
- Chae YG, Suh DJ, Kim HY, Kim YJ, Kim JG. 2012. Change of tree vitality of Pinus densiflora in the Baeckdudaegan area. Proceedings of the 2012 Annual Meeting of the Korean Forest Society, 151–154.
- Christmann A, Weiler EW, Steudle E, Grill E. 2007. A hydraulic signal in root‐to‐shoot signalling of water shortage. Plant J. 52(1):167–174.
- Farquhar GD, Sharkey TD. 1982. Stomatal conductance and photosynthesis. Annu Rev Plant Physiol. 33(1):317–345.
- Ferretti M. 1997. Forest health assessment and monitoring–issues for consideration. Environ Monit Assess. 48(1):45–72.
- Han SS, Kim SH. 1993. Ecophysiological interpretations on the water relations parameters of trees (VII) – measurement of water flow by the heat pulse method in a Larix leptolepis stand. J Korean Soc Forest Sci. 82(2):152–165.
- Han SS, Kim SH. 1996. Ecophysiological interpretations on the water relations parameters of trees (IX) – measurement of the transpiration rate by the heat pulse method in a Quercus mongolica stand. J Korean Soc Forest Sci. 85(2):288–299.
- Han SS, Jeon DS, Sim JS, Jeon SR. 2007. Effects of light, temperature, water changes on physiological responses of Kalopanax pictus leaves (VII) -Daily changes of stomatal transpiration, water use efficiency, and intercellular (Ci) CO2 concentration versus atmosphere CO2 concentration (Ca) ratio (Ci/Ca). J Forest Environ Sci. 3(3):3.
- Hwang DG, Kim DY. 2016. Assessment of landscape tree vigor using cambial electrical resistance. Ecol Resilient Infrastruct. 3(4):302–306.
- Jia W, Wang Y, Zhang S, Zhang J. 2002. Salt‐stress‐induced ABA accumulation is more sensitively triggered in roots than in shoots. J Exp Bot. 53(378):2201–2206.
- Jones HG. 1992. Plants and microclimate: a quantitative approach to environmental plant physiology. Cambridge: Cambridge University Press.
- Jung IH, Park NB, Kim SY, Na YE, Kim SI. 2014. Screening methods for plant-coating materials and transpiration inhibitory effect of soybean oil to crops. Korean J Plant Resour. 27(4):380–391.
- Kang BH, Cho SJ, Son JK, Kim NC, Kim MH. 2014. The health analysis of protected tree ‘Zelkova serrata’ using an ultrasonic tomograph. J Korea Soc Environ Restor Technol. 17(2):73–83.
- Kim JY, Kweon SG, Park JH, Lee HR, Kim KW. 2016. Digital infrared thermal imaging of crape myrtle leaves infested with sooty mold. Plant Pathol J. 32(6):563–569.
- Kim PG, Kim SH, Lee SM, Lee CH, Lee EJ. 2002. Adaptability to the water relations of Populus alba x P. glandulosa in 'Kimpo' waste landfills. J Korean Soc Forest Sci. 91(3):279–286.
- Kim PG, Yi YS, Chung DJ, Woo SY, Sung JH, Lee EJ. 2001. Effects of light intensity on photosynthetic activity of shade tolerant and intolerant tree species. J Korean Soc Forest Sci. 90(4):476–487.
- Kim SK, Park SB, Nam JC, Kim SH. 2002. Effects of location and soil characteristics on the vegetation structure and tree vitality of urban park and green open space. J Korea Soc Environ Restor Technol. 15(6):1–44.
- Kozlowski TT, Pallardy SG. 1996. Physiology of woody plants. Boca Raton: Elsevier.
- Lee AY, Kim SY, Hong SJ, Han YH, Choi Y, Kim M, Yun SK, Kim G. 2019. Phenotypic analysis of fruit crops water stress using infrared thermal imaging. J Biosyst Eng. 24(1):477–478.
- Marshall DC. 1958. Measurement of sap flow in conifers by heat transport. Plant Physiol. 33(6):385–396.
- Martinez-Trinidad T, Watson WT, Arnold MA, Lombardini L, Appel DN. 2010. Comparing various techniques to measure tree vitality of live oaks. Urban For Urban Greening. 9(3):199–203.
- Maxwell K, Johnson GN. 2000. Chlorophyll fluorescence-a practical guide. J Exp Bot. 51(345):659–668.
- Shigo AL. 1991. Modern arboriculture: a systems approach to the care of trees and their associates. Durham (NH): Shigo and Trees, Associates.
- Song KJ, Han SH, Ha TJ. 2001. Detection of discolored or decayed wood in landscape woody plants by internal electric resistance measurements. Korean J Environ Ecol. 15(1):17–25.
- Song Y. 2014. Indicators for the quantitative assessment of tree vigor condition and its theoretical implications-a case study of Japanese flowering-cherry trees in urban park. J Korea Soc Environ Restor Technol. 17(4):57–67.
- Wang YF, Ferguson DK, Zetter R, Denk T, Garfi G. 2001. Leaf architecture and epidermal characters in Zelkova ulmaceae. Bot J Linn Soc. 136(3):255–265.
- Wullschleger SD, Hanson PJ, Todd DE. 2001. Transpiration from a multi-species deciduous forest as estimated by xylem sap flow techniques. For Ecol Manage. 143(1–3):205–213.
- Xu L, Baldocchi DD. 2003. Seasonal trends in photosynthetic parameters and stomatal conductance of blue oak (Quercus douglasii) under prolonged summer drought and high temperature. Tree Physiol. 23(13):865–877.
- Yoo CY, Pence HE, Hasegawa PM, Mickelbart MV. 2009. Regulation of transpiration to improve crop water use. Crit Rev Plant Sci. 28(6):410–431.