
 ?Mathematical formulae have been encoded as MathML and are displayed in this HTML version using MathJax in order to improve their display. Uncheck the box to turn MathJax off. This feature requires Javascript. Click on a formula to zoom.
Abstract
Changes in stand biomass, stem density, mortality and recruitment were monitored from 2000 to 2016 at 5- or 6-year intervals of Mt. Geumsan (GMS). The GMS had 34 woody plant species and 2698 living stems (DBH ≥ 2 cm) ha−1 in 2016, with an increase in biomass from 233.80 ton ha−1 in 2000 to 282.15 ton ha−1 in 2016. The dominant species in the canopy layer was Quercus serrata, while Chamaecyparis obtusa was the dominant species in the subtree layer. During the 17 years, the biomass of Q. serrata increased from 156.35 to 198.40 ton ha−1, while the stem density of Q. serrata declined from 395 to 268 stems ha−1. In addition, the biomass of C. obtusa increased from 12.70 to 24.09 ton ha−1, and also the stem density of C. obtusa increased from 722 to 898 stems ha−1. The forest structure of GMS is expected to maintain dominance of Q. serrata, and C. obtusa is increasing. Therefore, GMS was a natural broad-leaved forest composed of Q. serrata, but natural broad-leaved species at the site are declining due to the regeneration and growth of C. obtusa, which is relatively shade-tolerant compared to other species.
Introduction
Balance in the global carbon is a major current issue because carbon concentration in the atmosphere affects climate both at a global and local scale (Zhao et al. Citation2019). Forest ecosystems are one of the major carbon sinks, with 45% of the carbon found in the terrestrial biosphere being stored and exchanged (Bonan Citation2008; Yao et al. Citation2018). Trees in a forest ecosystem assimilate or release carbon from and to the atmosphere, and these processes are regulated by the growth of trees (Thom et al. Citation2017). Therefore, understanding forest stand dynamics of forest ecosystems is fundamental to understand terrestrial carbon cycling and can be observed through changes in recruitment, growth and mortality of stems and growth of stems in forest stands (Bordin and Müller Citation2019). In addition, knowledge of forest stand dynamics offers insights into the structure of the current forest stand and future forest ecosystem (Swetnam et al. Citation1999).
Forest succession is driven mainly by interspecific differences in life-history traits such as shade tolerance, as slow-growing shade-tolerant species replace relatively shade-intolerant species (Kobe et al. Citation1995). Shade tolerance is a key component of tree fitness and the foundation of current theories of forest succession in forests (Valladares and Niinemets Citation2008). Shade tolerance is considered an important factor in forest succession because the difference between light competition and shade tolerance is an important determinant of forest structure and dynamics (Canham et al. Citation1994; Gravel et al. Citation2008). The mortality of trees depends on the rate and stage of stand development and frequency of disturbance (Harcombe et al. Citation1990). Trees die for a variety of reasons such as competition, suppression, old age, disease, insect pests, and other environmental stressors (Lugo and Scatena Citation1996). The recruitment of shade-tolerant species can occur in old forests (Franklin et al. Citation2002), and young trees can grow slowly, leading to stems that last for decades (Henttonen et al. Citation2019).
South Korea has a large forested area covering approximately 63% in 2020 of the total land area (100,000 km2) (National Institute of Forest Science Citation2011). The Korea Long-Term Ecological Research (KLTER) network was established in 2000 in the Mt. Geumsan (GMS) area of, Korea by the National Institute of Forest Science (NIFoS). GMS is registered as an official site in the International Long-Term Ecological Research-Dynamic Ecological Information Management System (ILTER-DEIMS, https://deims.org/). The dominant species at the GMS site are Quercus serrata Thunb. Ex Murray, Chamaecyparis obtusa (Siebold & Zucc.) Endl, Carpinus tschonoskii Maxim., and Carpinus laxiflora (Siebold & Zucc.) Blume (Yun and Chun Citation2018). These tree species are widely distributed throughout East Asia (Kira Citation1991), and Q. serrata, C. tschonoskii, and C. laxiflora are common throughout South Korea. However, C. obtusa is limited to the southern part of South Korea. C. obtusa has been planted in the southern region in South Korea since the 1960s, becoming one of the most important plantation species in South Korea, C. obtusa accounted for about 34.05% of the total planted area (14,542 ha) in 2019 (Korean Forest Service Citation2020).
The aim of this study was to investigate how the stand structure, species composition, and biomass in the warm temperate forest of GMS have changed over 17 years. For this purpose, the number of stems, basal area (BA), biomass, mortality, recruitment rate, and relative growth rate of DBH and height were monitored in a 1-ha permanent plot at GMS over 17 years.
Methods
Study site
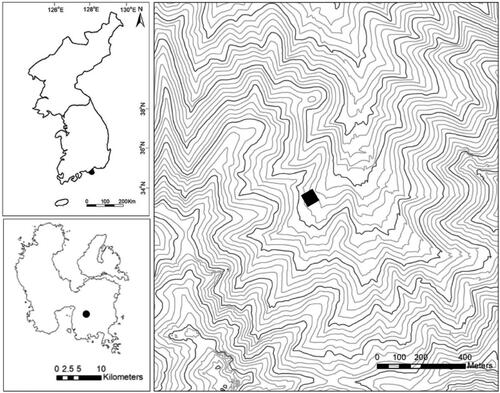
The present study was conducted at the GMS (34°45’N, 127°59’E) LTER site on the southern coast of the Hallyeohaesang National Park in Gyeongsangnam-do, Korea (). A 1-ha study plot (100 m × 100 m) was established in 2000 and was divided into 100 subplots of 100 m2 by compass surveying. The area is located in a warm-temperate forest zone. The long-term (1981–2010) annual mean temperature and precipitation at this site were 14.1 °C and 1839.4 mm, respectively (Korea Meteorological Administration Citation2015). GMS is situated at a 360–430 m hillside elevation with slopes ranging from 12–28°.
Figure 1. Location of study site (Mt. Geumsan long-term ecological research sites) in Korea.
Data collection
All individual woody stems ≥2 cm diameter at breast height (DBH) were identified to species, tagged, and measured using a diameter tape, and tree heights were measured using a Vertex hypsometer (Vertex IV, Haglöf, Sweden). The plot was re-censused in 2006, 2011, and 2016. The precise identification and scientific names of trees were confirmed by the National Knowledge and Information System for Biological Species of Korea (www.nature.go.kr) and a checklist of vascular plants in Korea (Korea National Arboretum, Citation2007).
Plant mortality and recruitment
The annual mortality rates (%year−1) and recruitment rates (%year−1) were calculated by the following:
where N0 is the initial number of stems initial census, Ns is the number of surviving stems among the initial censused trees, and Nf is the total number of stems during the census period (t years) (Condit et al. Citation1995; Sheil and May Citation1996; Condit et al. Citation1999).
Relative growth rate of DBH and height
The relative growth rate of DBH (RGRD) and height (RGRH) were calculated as follows:
where D2, H2 and D1, H1 are the initial and final measurements for DBH and height, respectively, and t2 and t1 represent the time interval (Evans Citation1972).
Biomass estimate
Biomass was calculated for each stem using species-specific allometric equations. Five tree species that had a high proportion of stand basal area were selected as dominant species. Thirty-four tree species were recorded in all field plots and classified as five types for more accurate biomass estimate: (1) Q. serrata, (2) C. obtusa, (3) C. tschonoskii, (4) C. laxiflora and (5) other tree species. The DBH and height of Q. serrata, C. obtusa, and C. laxiflora were used to estimate their biomass using different biomass allometric equations () (National Institute of Forest Science Citation2010). The biomass equation of C. tschonoskii used the biomass equation of C. laxiflora, which is in the same genus, Carpinus. And the biomass of other tree species was estimated using the biomass equation reported by Lim et al. (Citation2003). Total biomass production in the plots was obtained by summing the biomass of all the standing trees.
Table 1. Allometric equations used to estimate biomass of Quercus serrata, Chamaecyparis obtusa, Carpinus tschonoskii, C. laxiflora, and other tree species.
Results
The total numbers of stems (DBH ≥ 2 cm) at the 1 ha permanent plot (trees ha−1) in 2000, 2006, 2011, and 2016 were 3933, 3563, 3055, and 2698, respectively. A total number of species was 34 species and it did not change during the survey period. The species with a high proportion of stand BA were Q. serrata, C. tschonoskii, C. laxiflora, and C. obtusa. Aside from these, Pinus densiflora Siebold & Zucc, Acer pseudosieboldianum (Pax) Kom, Styrax japonicus Siebold & Zucc, Stewartia pseudocamellia Maxim. and others were observed.
The number of Q. serrata stems continued to decrease from 395 trees ha−1 in 2000 to 268 trees ha−1 in 2016, but C. obtusa stems continued to increase from 722 trees ha−1 in 2000 to 898 trees ha−1 in 2016 (). The number of Q. serrata was only 268 trees ha−1 (9.93%), and the sum of BA was 18.73 m2ha−1 in 2016 (55.48%) (). In contrast, the number of C. obtusa was 898 trees ha−1 (33.28%), while the sum of BA was 4.38 m2ha−1 in 2016 (12.98%). The difference in the number of Q. serrata and C. obtusa between 2000 and 2016 is due to the different numbers of dead trees and recruited trees. The number of dead trees of Q. serrata was 127 trees ha−1 over 17 years since 2000, while there was no tree recruitment. Meanwhile, the number of dead trees of C. obtusa was 163 trees ha−1 during the same period, and the number of recruited trees was 339 trees ha−1.
Figure 2. Sequential changes in the number of stems (trees ha−1), and biomass (ton ha−1) in GMS from 2000 to 2016.
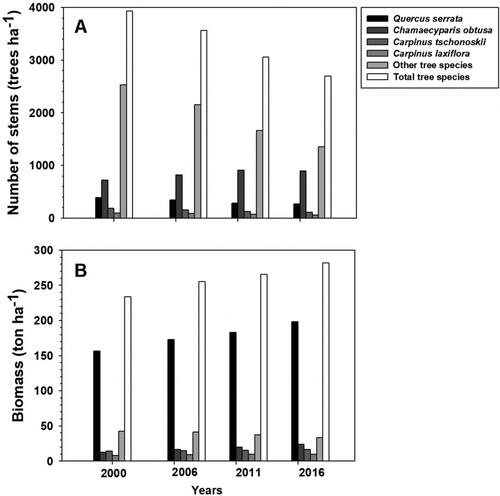
Table 2. Sequential changes in the sum of basal area (m2ha−1), average of DBH (cm), and average of height (m) of dominant tree species from 2000 to 2016.
The average DBH of Q. serrata, C. obtusa, C. tschonoskii, C. laxiflora, and other tree species continuously increased over the 17 years in 2016. The average DBH of Q. serrata was the largest, with 28.19 ± 0.60 cm, and C. obtusa was the smallest at 5.90 ± 0.17 cm in 2016. Likewise, the average height of Q. serrata, C. obtusa, C. tschonoskii, C. laxiflora, and other tree species also continuously increased over the 17 years. The average height of Q. serrata was the largest, 18.09 ± 0.17 m, and C. obtusa was the smallest, at 5.24 ± 0.11 m.
Meanwhile, the number of stems and BA of other tree species (P. densiflora, A. pseudosieboldianum, S. japonicus, S. pseudocamellia, etc.) continually decreased over 17 years. Among them, A. pseudosieboldianum, which decreased from 395 trees ha−1 in 2000 to 327 trees ha−1 in 2016, accounted for the largest number of stems of other tree species. The number of stems of S. japonicus continuously decreased from 346 trees ha−1 in 2000 to 149 trees ha−1 in 2016, and the number of stems of S. pseudocamellia continuously decreased from 262 trees ha−1 in 2000 to 115 trees ha−1 in 2016.
The number of stems and sum of BA of P. densifora among other tree species has also been continuously decreasing over 17 years, from 40 trees ha−1 in 2000 to 16 trees ha−1 in 2016. The sum of BA of P. densifora decreased from 1.64 m2ha−1 in 2000 to 1.02 ± m2ha−1 in 2016.
The mean relative growth rate of DBH and height of dominant tree species varied over the survey period (). However, the mean annual relative growth of DBH and height in each dominant tree species showed a similar pattern during the three survey periods. The mean annual relative growth rate (mm year−1) of DBH of Q. serrata in each survey interval was 0.09 ± 0.005, 0.10 ± 0.004, and 0.08 ± 0.005, respectively. The mean relative growth rate of height (cm year−1) of Q. serrata in each survey interval was 1.36 ± 0.118, 0.66 ± 0.107, and 0.76 ± 0.071, respectively. Similarly, the mean annual relative growth rate of DBH (mm year−1) of C. obtusa in each survey interval was 0.26 ± 0.013, 0.27 ± 0.007, and 0.25 ± 0.008, respectively, while the mean relative growth rate of height (cm year−1) of C. obtusa in each survey interval was 3.00 ± 0.097, 2.51 ± 0.120, and 1.10 ± 0.126, respectively.
Table 3. The mean relative growth rate of DBH and height of dominant tree species.
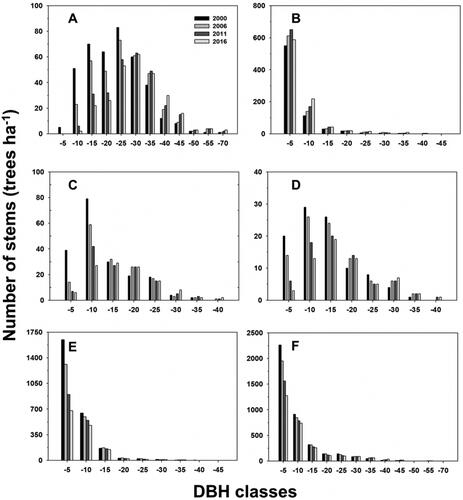
The DBH size distribution of the dominant tree species differed with species (). At the species level, the DBH size distribution of the dominant tree, Q. serrata showed a right-skewed distribution; the peak was in the 20-25 cm class and a few recruitment stems (2–5 cm) were observed. In addition, C. tschonoskii and C. laxiflora showed a right-skewed distribution; the peak was in the 5–10 cm class and recruitment stems (2–5 cm) were continuously decreased from 2000 to 2016. However, C. obtusa and the other tree species showed a reversed-J pattern with multiple small stems; the peak was in the recruitment stems (2–5 cm). Other tree species and all tree stems showed a reversed-J pattern with multiple small stems, with the peak similarly in the recruitment stems (2–5 cm). The DBH size distribution of all tree stems in the GMS site showed a reversed-J pattern with multiple small stems ().
Figure 3. Diameter at breast height (DBH) class distributions of the species in the permanent plot, (A) Quercus serrata, (B) Chamaecyparis obtusa, (C) Carpinus tschonoskii, (D) Carpinus laxiflora, (E): other tree species, and F: all tree stems.
The number of dead trees, mortality rate, number of recruitment trees, and recruitment rate of dominant tree species varied according to the survey period. Annual mortality (% year−1) of Q. serrata in each survey interval was 2.26, 3.82, and 1.23, respectively (). Annual mortality (% year−1) of C. obtusa in each survey interval was 0.97, 1.07, and 1.82, respectively. The recruitment rate (% year−1) of C. obtusa in each survey interval was 3.16, 3.04, and 1.60, respectively. However, the recruitment tree of Q. serrata did not appear during the survey period, while the recruitment tree of C. obtusa appeared the most.
Table 4. Sequential changes in the dead tree, mortality, recruitment tree, and recruitment rate of dominant species from 2000 to 2016.
Discussion
Our findings demonstrate that GMS forests are in the process of succession, moving from deciduous broadleaf forests to evergreen coniferous forests. This contrasts with typical forest succession in Korea, which usually moves from coniferous forest dominated by P. densiflora to deciduous broadleaf forest dominated by Q. serrata (Choung and Hong Citation2006; Kato and Hayashi Citation2006). Consequently, GMS forests are composed of deciduous broadleaf species (Q. serrata, C. tschonoskii, and C. laxiflora) and coniferous species (C. obtusa) because of natural regeneration and invasion by exotic shade-tolerant coniferous species.
In 2016, the canopy of the GMS forests mostly consisted of deciduous broadleaf species (Q. serrata, C. tschonoskii, and C. laxiflora) while the subtree layer was evergreen conifer species (C. obtusa). The forest structure and dynamics were driven by differences in mortality and recruitment rates among tree species (Nakashizuka et al. Citation1992; Cai et al. Citation2020) and by the functional traits of the tree species, such as their degree of shade-tolerance (Clark and Clark Citation1992). The GMS forest may change from a Q. serrata dominated forest to a C. obtusa co-dominated forest because of the recruitment rate of C. obtusa. It is possible that recruitment of Q. serrata occurred but was not observed because seedling failed to survive. This could be due to the greater competitiveness of C. obtusa, due to its high shade tolerance (Yoshida and Kamitani Citation2000). In mature forests, such as those in GMS, the shade-tolerant species may persist or increase, but shade-intolerant species may not persist in the mature forests, although some long-lived, shade-intolerant species may persist for a long time (Chun and Lee Citation2019). For example, Higo et al. (Citation1995) reported that a forest of P. densiflora was shifting to Q. serrata due to competition. Similarly, Beon and Bartsch (Citation2003) reported that competition between P. densiflora and Q. serrata was mediated due to the difference in the species’ shade tolerance.
The composition of forests can be attributed to competition among species or individual trees (Sheil and May Citation1996). In our study, the DBH size distribution for all tree stems in GMS showed a typical reversed-J-shaped curve, with a high proportion of trees in the 2–5 cm class. The reverse J-shaped curve is the characteristics of species with continuous regeneration (Rasingam and Parathasarathy Citation2009). On the other hand, the DBH size distribution of the dominant species also shows the potential of changes in dominant species from a Q. serrata-dominated forest to a C. obtusa co-dominant forest. The canopy dominant Q. serrata had very few stems in the understory layer, while the subtree dominant C. obtusa had many stems in the middle layer. Therefore, it is expected that Q. serrata will be replaced in the canopy by C. obtusa in the future. The DBH size distribution of C. obtusa shows the presence of relatively abundant small trees and young trees compared to other major tree species. Generally, shade-tolerant species show a reversed-J-shaped curve (Kume et al. Citation2003); C. obtusa showed a typical reversed-J-shaped curve in the permanent plots and small trees could be found together with few large trees of this species. The larger trees of C. obtusa can disperse their seeds over a considerable distance by wind dispersal and can regenerate from seed after site disturbance (Yamagawa et al. Citation2008). It is well known that C. obtusa regenerates only by seed (Yamamoto Citation1998). Indeed, C. obtusa was not planted in GMS, but rather it is thought that these seeds were spread by the wind from the C. obtusa planted about 2 km from GMS.
Meanwhile, GMS forests continue to accumulate biomass despite changes in tree species composition, DBH, height, mortality, and recruitment. Generally, trees with larger DBH and height have greater biomass (Chai et al. Citation2019). As the major overstory tree in GMS, Q. serrata made an increasing contribution to total stand biomass over the 17 years of this study, due to the higher biomass accumulation of the remaining large trees with increased DBH and height. Meanwhile, C. obtusa as an understory tree also provided increasing stand biomass, due to an increase in the number of stems caused by a higher recruitment rate. On the other hand, the other tree species were found to have a decrease in their contribution to biomass, due to a reduction in the number of stems. The dominance of larger trees makes the forest more vulnerable to biomass losses from stochastic or disturbance-related mortality (Eisen and Plotkin Citation2015). Thus, it is uncertain whether biomass will continue to accumulate in GMS in the future.
Large trees are especially vulnerable to natural disturbances (Hanson and Lorimer Citation2007). Medium-sized trees have advantages over small and large trees in intraspecific and interspecific competition (Bastias et al. Citation2020). It is believed that canopy gaps in GMS forests formed by deaths of larger trees from typhoons, strong winds, or heavy rain enhance the regeneration of C. obtusa. Disturbances from typhoons occurred at GMS in 2002, 2003, 2007 and 2014 (Chun and Lee Citation2019). It is likely that during these years, GMS forests experienced an increase in the mortality of broadleaved species (Q. serrata, C. tschonoskii, and C. laxiflora), and an increase in the recruitment of C. obtusa. Generally, canopy gaps in climax forests are an important element in forest succession because they allow for the growth of young trees of the next generation (Jaloviar et al. Citation2020; Petrokas Citation2020). In GMS forests, the mortality of Q. serrata in the upper layers affected the development of the middle and lower layer by increasing the opening of the canopy. Depending on the species, small trees might be more vulnerable to shade under the closed canopy or to breakage from falling stems (Miura et al. Citation2001). In the middle and lower layer, an increase was observed in the number of C. obtusa because of the change in light conditions due to the occurrence of opening caused by the damage of Q. serrata in the upper layer.
The direction of succession toward the climax forest composition in GMS is somewhat uncertain due to the unknown of future intensity and frequency of disturbance. The present dominant tree species, Q. serrata, is relatively shade-intolerant compared to C. obtusa, usually with only a few understory individuals (Masaki et al. Citation1992). Q. serrata can regenerate by seed dispersal only in light gaps and cannot reproduce under a closed canopy. Thus, they require gap formation for their regeneration. In contrast, C. obtusa is a shade-tolerant species that forms a sapling bank under a closed canopy. If disturbances are low in intensity and frequency, it will lead to a stable community structure and higher dominance of the more shade-tolerant species (Cho and Boerner Citation1991; Busing and White Citation1997).
At our study site, the numbers of P. densiflora continued to decrease from 40 trees ha−1 in 2000 to 16 trees ha−1 in 2016. The maximum DBH of P. densiflora was 40.0 cm, and the average DBH of the P. densiflora was 22.6 ± 1.0 cm in 2010. It is speculated that P. densiflora continues to decline in number because of environmental changes under climate change and competition. In addition, P. densiflora is vulnerable to temperature increases, and it has been reported that mortality of P.densiflora increases at higher temperatures (Kishi Citation1999). In relation to height and biomass increase, Q. serrata is believed to have suppressed P. densiflora because it exhibits a higher shade tolerance than P. densiflora (Beon and Bartsch Citation2003). Meanwhile, the BA of tree species other than the dominant species has continually declined over the 17 years of this study. This is expected to have contributed to the reduction of biomass and basal area because numbers of large-sized P. densiflora declined. The number of stems, basal area, and biomass of P. densiflora in GMS forests is expected to decrease in the future. Meanwhile, our hypothesis suggests that P. densiflora forests convert over time to Q. serrata and C. laxiflora forests, which is believed to be a climax forest in Korea (Park et al. Citation2009; Hong et al. Citation2012; Byeon et al. Citation2018). However, our results suggest that this may not be a stable forest, as exotic C. obtusa may be a disturbance factor in a mature Q. serrata and C. laxiflora dominated stand in GMS.
Conclusions
Our results indicate that the forests structure of GMS is still changing, and their live tree biomass contributes to accumulating carbon. Overall, the 17 year monitoring of the GMS forest showed that the development of the forest included increasing numbers of tree stems and increasing biomass. Therefore, the GMS has sequestered a substantial amount of carbon through woody biomass increment and will continue to do so in the future. While C. obtusa was the most abundant shade-tolerant tree species in the GMS, Q. serrata was the dominant, relatively shade-intolerant tree species. Therefore, the forest structure of GMS is expected to continue with an increase in C. obtusa, while Q. serrata is expected to remain dominant.
References
- Bastias CC, Truchado DA, Valladares F, Benavides R, Bouriaud O, Bruelheide H, Coppi A, Finer L, Gimeno TE, Jaroszewicz B, et al. 2020. Species richness influences the spatial distribution of trees in European forests. Oikos. 129(3):380–390.
- Beon MS, Bartsch N. 2003. Early seedling growth of pine (Pinus densiflora) and oaks (Quercus serrata, Q. mongolica, Q. variabilis) in response to light intensity and soil moisture. Plant Ecol. 167(1):97–105.
- Bonan GB. 2008. Forests and climate change: forcings, feedbacks, and the climate benefits of forests. Science. 320(5882):1444–1449.
- Bordin KM, Müller SC. 2019. Drivers of subtropical forest dynamics: the role of functional traits, forest structure and soil variables. J Veg Sci. 30(6):1164–1174.
- Busing RT, White PS. 1997. Species diversity and small-scale disturbance in an old-growth temperate forest: a consideration of gap partitioning concepts. Oikos. 78(3):562–568.
- Byeon SY, Yun CW. 2018. Community structure and vegetation succession of Carpinus laxiflora forest stands in south Korea. Korean J Environ Ecol. 32(2):185–202.
- Cai H, Li F, Jin G. 2020. Soil nutrients, forest structure and species traits drive aboveground carbon dynamics in an old-growth temperate forest. Sci Total Environ. 705:135874.
- Canham CD, Finzi AC, Pacala SW, Burbank DH. 1994. Causes and consequences of resource heterogeneity in forests: interspecific variation in light transmission by canopy trees. Can J For Res. 24(2):337–349.
- Chai RK, Andrus RA, Rodman K, Harvey BJ, Veblen TT. 2019. Stand dynamics and topographic setting influence changes in live tree biomass over a 34-year permanent plot record in a subalpine forest in the Colorado Front Range. Can J For Res. 49(10):1256–1264.
- Cho DS, Boerner REJ. 1991. Canopy disturbance patterns and regeneration of Quercus species in two Ohio old-growth forests. Vegetatio. 93:9–18.
- Choung HL, Hong SK. 2006. Distribution patterns, floristic differentiation and succession of Pinus densiflora forest in South Korea: a perspective at nation-wide scale. Phyto. 36(2):213–229.
- Chun JH, Lee CB. 2019. Temporal changes in species, phylogenetic, and functional diversity of temperate tree communities: insights from assembly patterns. Front Plant Sci. 10:294.
- Clark DA, Clark DB. 1992. Life history diversity of canopy and emergent trees in a neotropical rain forest. Ecol Monogr. 62(3):315–344.
- Condit R, Ashton PS, Manokaran N, LaFrankie JV, Hubbell SP, Foster RB. 1999. Dynamics of the forest communities at Pasoh and Barro Colorado: comparing two 50–ha plots. Philosophical Transactions of the Royal Society of London. Series B: Biol Sci. 354:1739–1748.
- Condit R, Hubbell SP, Foster RB. 1995. Mortality rates of 205 neotropical tree and shrub species and the impact of a severe drought. Ecol Monogr. 65(4):419–439.
- Evans GC. 1972. The quantitative analysis of plant growth (Vol. 1). Berkley, California: Univ of California Press.
- Eisen K, Plotkin AB. 2015. Forty years of forest measurements support steadily increasing aboveground biomass in a maturing, Quercus-dominant northeastern forest. J Torrey Bot Soc. 142(2):97–112.
- Franklin JF, Spies TA, Van Pelt R, Carey AB, Thornburgh DA, Berg DR, Lindenmayer JF, Harmon ME, Keeton WS, Shaw DC, et al. 2002. Disturbances and structural development of natural forest ecosystems with silvicultural implications, using Douglas-fir forests as an example. For Ecol Manage. 155(1–3):399–423.
- Gravel D, Beaudet M, Messier C. 2008. Partitioning the factors of spatial variation in regeneration density of shade-tolerant tree species . Ecology. 89(10):2879–2888.
- Hanson JJ, Lorimer CG. 2007. Forest structure and light regimes following moderate wind storms: Implications for multi-cohort management. Ecol Appl. 17(5):1325–1340.
- Harcombe PA, Harmon ME, Greene SE. 1990. Changes in biomass and production over 53 years in a coastal Picea sitchensis–Tsuga heterophylla forest approaching maturity. Can J For Res. 20(10):1602–1610.
- Henttonen HM, Nöjd P, Suvanto S, Heikkinen J, Mäkinen H. 2019. Large trees have increased greatly in Finland during 1921–2013, but recent observations on old trees tell a different story. Ecol Indic. 99:118–129.
- Higo M, Shinohara A, Kodama S. 1995. The regeneration behavior of major component species in the secondary forest dominated by Pinus densiflora and Quercus serrata in central Japan. For Ecol Manage. 76(1–3):1–10.
- Hong SH, Cho JW, Kim JS, Lee SD, Choi SH. 2012. Characteristics of the Carpinus laxiflora community in the Gyeongju National Park. Korean Soc Environ Ecol. 26:934–940.
- Jaloviar P, Sedmáková D, Pittner J, Jarčušková Danková L, Kucbel S, Sedmák R, Saniga M. 2020. Gap structure and regeneration in the mixed old-growth forests of National Nature Reserve Sitno, Slovakia. Forests. 11(1):81.
- Kato J, Hayashi I. 2006. Quantitative analysis of a stand of Pinus densiflora undergoing succession to Quercus mongolica ssp. crispula: 1. A 31-year record of growth and population dynamics of the canopy trees. Ecol Res. 21(4):503–509.
- Kira T. 1991. Forest ecosystems of east and southeast Asia in a global perspective. Ecol Res. 6(2):185–200.
- Kishi Y. 1999. Survival of Pinus densiflora and P. thunbergii forests in Ibaraki Prefecture severely damaged by Bursaphelenchus xylophilus. J For Res. 4(4):287–290.
- Kobe RK, Pacala SW, Silander JA, Jr, Canham CD. 1995. Juvenile tree survivorship as a component of shade tolerance. Ecol App. 5(2):517–532.
- Korean Forest Service. 2020. Forestry statistical yearbook. Vol. 50. Daejeon.
- Korea Meteorological Administration. 2015. Climatological normals of Korea. Seoul: Korea Meteorological Administration.
- Korea National Arboretum. 2007. Checklist of vascular plants in Korea. Pocheon: Korea National Arboretum.
- Kume A, Satomura T, Tsuboi N, Chiwa M, Hanba YT, Nakane K, Horikoshi T, Sakugawa H. 2003. Effects of understory vegetation on the ecophysiological characteristics of an overstory pine, Pinus densiflora. For Ecol Manage. 176(1–3):195–203.
- Lim JH, Shin JH, Jin GZ, Chun JH, Oh JS. 2003. Forest stand structure, site characteristics and carbon budget of the Kwangneung natural forest in Korea. Korean J Agr For Meteorol. 5:101–109.
- Lugo AE, Scatena FN. 1996. Background and catastrophic tree mortality in tropical moist, wet, and rain forests. Biotropica. 28(4):585–599.
- Masaki T, Suzuki W, Niiyama K, Iida S, Tanaka H, Nakashizuka T. 1992. Community structure of a species-rich temperate forest, Ogawa Forest Reserve, central Japan. Vegetatio. 98(2):97–111.
- Miura M, Manabe T, Nishimura N, Yamamoto SI. 2001. Forest canopy and community dynamics in a temperate old‐growth evergreen broad‐leaved forest, south‐western Japan: a 7‐year study of a 4‐ha plot. J Ecol. 89(5):841–849.
- Nakashizuka T, Iida S, Tanaka H, Shibata M, Abe S, Masaki T, Niiyama K. 1992. Community dynamics of Ogawa Forest Reserve, a species-rich deciduous forest, central Japan. Vegetatio. 103:105–112.
- National Institute of Forest Science. 2010. Carbon emission factors and biomass allometric equations by species in Korea. Seoul.
- National Institute of Forest Science. 2011. Statistical yearbook of forestry. Daejeon.
- Park BC, Oh CH, Cho CW. 2009. Community structure analysis of Carpinus laxiflora communities in Seoul. Korean J Environ Ecol. 23:333–345.
- Petrokas R. 2020. Forest climax phenomenon: an invariance of scale. Forests. 11(1):56.
- Rasingam L, Parathasarathy N. 2009. Tree species diversity and population structure across major forest formations and disturbance categories in Little Andaman Island, India. Trop Ecol. 50:89.
- Sheil D, May RM. 1996. Mortality and recruitment rate evaluations in heterogeneous tropical forests. J Ecol. 84(1):91–100.
- Swetnam TW, Allen CD, Betancourt JL. 1999. Applied historical ecology: using the past to manage for the future. Ecol Appl. 9(4):1189–1206.
- Thom D, Rammer w, Seidl R. 2017. The impact of future forest dynamics on climate: interactive effects of changing vegetation and disturbance regimes. Ecol Monogr. 87(4):665–684.
- Valladares F, Niinemets U. 2008. Shade tolerance, a key plant feature of complex nature and consequences. Annu Rev Ecol Evol Syst. 39(1):237–257.
- Yamagawa H, Ito S, Nakao T. 2008. Early establishment of broadleaved trees after logging of Cryptomeria japonica and Chamaecyparis obtusa plantations with different understory treatments. J For Res. 13(6):372–379.
- Yamamoto S. 1998. Regeneration ecology of Chamaecyparis obtusa and Chamaecyparis pisifera (Hinoki and Sawara cypress), Japan. Coastally restricted Forests. Oxford: Oxford University Press; p. 101–110.
- Yao Y, Piao S, Wang T. 2018. Future biomass carbon sequestration capacity of Chinese forests. Sci Bull. 63(17):1108–1117.
- Yoshida T, Kamitani T. 2000. Interspecific competition among three canopy-tree species in a mixed-species even-aged forest of central Japan. For Ecol Manage. 137(1–3):221–230.
- Yun SJ, Chun J. 2018. Long-term ecological research on Korean forest ecosystems: the current status and challenges. Ecol Res. 33(6):1289–1302.
- Zhao F, Wu Y, Sivakumar B, Long A, Qiu L, Chen J, Wang L, Liu S, Hu H. 2019. Climatic and hydrologic controls on net primary production in a semiarid loess watershed. J Hydrol. 568:803–815.