
Abstract
Drought damage and waterlogging damage are the most frequent abiotic injuries throughout the lifespan of trees. Nonetheless, because the signs of visible damage are similar between these types of injury, physiological indicators must be analyzed to make a scientific differential diagnosis. This study was aimed at investigating growth and physiological indicators of drought (DS) and waterlogging stress (WL) in Prunus yedoensis. Overall growth indices such as tree height, diameter at root collar (DRC), and total dry weight could be ranked in the decreasing order “control > DS > WL.” In particular, there was a prominent decrease in root growth in WL, and DRC in DS was lower by 9.2% than DRC before the experiment. As for water saturation deficit (WSD) increased to 37.4% by 28 days after treatment initiation (DAT) in DS. WL showed a sharp decline of photosynthetic indicators such as the net photosynthesis rate (A), stomatal conductance (gs), and maximum carboxylation rate (Vcmax) starting from 7 DAT. By contrast, DS manifested a significant decrease starting from 14 DAT. The DS had higher levels of leaf and root inorganic components than WL did, suggesting an improvement in the osmoregulatory ability. The overall nutritional status of WL was low due to deterioration of the absorption function of the roots. In both DS and WL, energy transfer rates of photochemical reactions, e.g. absorbed photon leads to reduction further than QA- (ΦPO), absorbed photon leads to electron transport further than QA- (ΦEO), and absorbed photon leads to reduction of QA- (ΨO), decreased, as did vitality indices, e.g. the performance index on absorption basis (PIabs), driving force on absorption basis (DFabs), and the structure function index on absorption basis (SFIabs). However, WL featured a decrease in Electron transport flux from QA to QB (ETo/RC) and Electron transport flux until PSI acceptors (REo/RC), whereas DS experienced a slight increase or almost no change. Consequently, PIabs, DFabs, SFIabs, and the drought factor index are highly sensitive environmental-stress indicators, whereas WSD, DRC growth, chlorophyll a content, ETo/RC, and REo/RC appear to have high potential as diagnostic indicators of drought or waterlogging damage.
Introduction
In South Korea, approximately 60–70% of annual precipitation corresponds to the summer, with relatively dry days in spring and autumn, thus showing a prominent trend of uneven distribution of precipitation among seasons, which has led to drought and waterlogging damage to trees steadily reported for a very long time in residential areas (National Institute of Forest Science Citation2020). The Korea Meteorological Administration predicts that extreme precipitation events such as drought and torrential rain will become more frequent due to increased precipitation variability following climate change (Korea Meteorological Administration Citation2020).
According to the 2019 tree diagnosis statistics in residential area, 7.6% of abiotic damage was found to be meteorological factors such as drought and floods. However, it can be predicted that the abiotic damage could become much more severe with the anthropogenic factors for example, poor drainage and limited space (National Institute of Forest Science Citation2020). Furthermore, with the introduction of a tree doctor system that professionally diagnoses tree diseases and prescribes remedies in residential areas, there is a pressing social need for the systematization and specialization of techniques for diagnosing physiological damage such as that caused by drought or waterlogging stress. Nonetheless, it is difficult to make a scientific diagnosis to trees in practice because the diagnosis of abiotic injuries such as drought or waterlogging damage to trees is based on empirical rules derived from fragmentary information such as visual analysis (Boone and Westwood Citation2006).
As nondestructive diagnostic techniques for plants, cambial electrical resistance (Plamping et al. Citation2009), internal decay assessment using ultrasound (Martinis et al. Citation2004; Son et al. Citation2021), leaf pigment analysis, and chlorophyll fluorescence analysis (Oukarroum et al. Citation2007) have been developed, but most studies have been focused on such crops as sesame (Boureima et al. Citation2012), barley (Oukarroum et al. Citation2007), cucumber, and tomato (Sousaraei et al. Citation2021). Regarding damaging factors, there have been many studies on drought stress, but relatively little research on waterlogging or flooding stress. In particular, the drought factor index (DFI), which is a recently developed drought stress indicator, is known to help making a relatively accurate diagnosis and is widely used to select cultivars resistant to drought damage (Oukarroum et al. Citation2007; Boureima et al. Citation2012). On the other hand, studies on differences in damage caused by biotic and abiotic stressors other than drought stress—such as waterlogging, salt damage, and infections—are hard to find, and their results require verification.
Prunus yedoensis is a representative tree species in residential areas often used as a street tree or park tree, with its popularity due to splendid flowers in the spring; this species represented approximately 21% of street trees in South Korea as of 2015 (Lee et al. Citation2018) and is also the tree species that is third most treated for abiotic damage (National Institute of Forest Science Citation2020). Therefore, the present study was designed to investigate growth status and physiological responses of P. yedoensis (a representative tree in living space) to drought and waterlogging conditions, which are frequently experienced throughout its lifespan, and to obtain basic data for a scientific tree diagnosis and management system.
Materials and methods
Plant material and growth conditions
Two-year-old P. yedoensis seedlings were used, which were grown for 1 month after being planted in a 15 L pot containing soil mixed with peat moss, perlite, and vermiculite in a 1:1:1 ratio (v/v/v) in a greenhouse at the Korea National College of Agriculture and Fisheries on March 29, 2020. To facilitate rooting, Multifeed 20 (N:P:K = 20:20:20) was diluted to 2 g/L to fertilize the soil once at 400 mL/pot, and the number of leaf buds was maintained at 20 before bursting of the leaves.
For the experiment, 12 seedlings were assigned to each of the following groups: control, drought stress (DS), and waterlogging (WL). The control group was irrigated with 1,000 mL of water twice a week; the irrigation was stopped entirely for group DS; and group WL was submerged to the ground level by means of a semitransparent square tank from May 7 to June 5. To reproduce the oxygen depletion phenomenon as much as possible, the water used for the waterlogging was not replaced until the end of the experiment, and the water level was maintained by adding water. At the beginning of the experiment, a portable temperature-humidity meter (HOBO H08-004-02, ONSET, USA) was installed at a height of 2 m from the ground to keep track of the changes in temperature and humidity in the air, and soil water content (SWC) was monitored at 1 h intervals during the experiment by embedding one soil moisture sensor (10HS, ONSET, USA) for each group at a depth of 15 cm in the pot. The vapor pressure deficit (VPD) was calculated from the measured temperature and humidity as well (Nidumolu et al. Citation2014).
Photosynthetic responses
The photosynthetic reaction was measured weekly using a portable photosynthesis system (Li-6800, Li-Cor Inc., Lincoln, NE, USA). The net photosynthesis rate (A), stomatal transpiration rate (E), and stomatal conductance (gs) were determined five times in each group using an LED light source attached to the portable photosynthesis system, with the photosynthetic photon flux density (PPFD) fixed at 1,000 µmol·m−2·s−1. Based on the measurements, the ratio of intercellular to atmospheric CO2 concentration (Ci/Ca), instantaneous transpiration efficiency (ITE), and intrinsic water use efficiency (WUEi) were calculated (Sharkey et al. Citation2007; Lee et al. Citation2021). In addition, the CO2 response curve (A-Ci) in mesophyll cells according to the CO2 concentration (0 to 1,400 µmol⋅m−2⋅s−1) was constructed three times per group, and the maximum carboxylation rate (Vcmax), the maximum electron transport rate (Jmax), and the CO2 compensation point (Γ) were computed (Sharkey et al. Citation2007). Common measurement conditions, such as air inflow into the chamber and temperature, were kept consistent at 600 μmol·s−1 and 25 °C ± 1 °C, respectively.
Water saturation deficit (WSD) and growth characteristics
WSD was investigated at intervals of 1 week, five times per treatment group, and fresh weight (FW) was measured immediately after leaf cutting. Turgid weight (TW) was determined after moisture was absorbed for at least 24 h to reach the equilibrium state for maximum water holding under the conditions of dark room temperature (25 °C). After drying of the leaves whose saturated weight was measured at 80 °C for 48 h, dry weight (DW) was determined to calculate WSD (Rybka et al. Citation2019). To examine growth characteristics, height and diameter at root collar (DRC) were analyzed before the start of the experiment and at the end of it. DRC was measured at a point 1 cm above the ground using vernier calipers, and the height was determined with a measuring tape. At the end of the experiment, the leaves, stems, and roots of each specimen were separated, and the dry weight of each part was measured. The dry weight of each part was measured after a sample was dried in a dryer (DS-80-5, Dasol Scientific Co. Ltd., Gyeonggido, Korea) at 80 °C for 48 h. The top(leaf + shoot) to root ratio (T/R ratio, g/g), leaf weight ratio (LWR, g/g), and root weight ratio (RWR, g/g) were calculated from the above measurements. The T/R ratio defined as dry weight of top divided by dry weight of root, LWR is the ratio of leaf weight to plant dry weight and RWR is the ratio of root dry weight to plant dry weight.
Plant analysis
For the isolation of inorganic components, 0.5 g of a sample was used after drying at 105 °C for 16 h and grinding. The sample was placed in a microwave (Mars5, Mars6, CEM, USA) decomposition container and decomposed for 24 h by the addition of 7 mL of a nitric acid solution (HNO3:H2O at 1:1). It was then passed through filter paper (Whatman No. 6, Maidstone, England) and subjected to the analysis. Trace element quantitative analysis was carried out using inductively coupled plasma (ICP, PerkinElmer Optima 8300, USA), and the detection wavelength was 317.933 nm for Ca, 285.213 nm for Mg, 766.490 nm for K, and 588.995 nm for Na. Total nitrogen (T-N) was assayed with a CN analyzer (Vario MAX CN, Elementar, Langenselbold, Germany).
Chlorophyll and carotenoid contents
To determine the chlorophyll and carotenoid concentrations, five leaves were collected from each treatment group at an interval of 1 week. The collected leaves then cut in to leaf pieces of 0.1 g, respectively, and were placed in a 20 mL glass bottle, which contains 10 mL of a dimethyl sulfoxide (DMSO) solution. The pigment was extracted in a thermostat set to 60 °C, for 6 h (Hiscox and Israelstam Citation1979). The extracted solution was analyzed for absorbance at wavelengths of 663, 645, and 470 nm on a UV/VIS Spectro-photometer (HP 8453, Hewlett-Packard, USA), and then chlorophyll a, b, and a + b and carotenoid concentrations were calculated (Arnon Citation1949; Lichtenthaler Citation1987).
Chlorophyll a fluorescence
This assay was performed by the analysis of the polyphasic rise of chlorophyll a fluorescence transients (OKJIP), and the leaves that had been dark-adapted for 20 min were irradiated with a dose of light of 3,500 µmol·m−2⋅s−1 for 1 s using a plant efficiency analyzer (Hansatech Instrument Ltd., King’s Lynn, England), and chlorophyll fluorescence density at 50 μs (stage O), 300 μs (stage K), 2 ms (stage J), 30 ms (stage I), and 500 ms (stage P) was assayed five times each week in each group. Through OKJIP analysis, biophysical parameters (biophysical parameters; VJ, VK, Mo ECo/ABS, ΦPO, ΦEO, ΨO, REo/ETo, ABS/RC, TRo/RC, ETo/RC, DIo/RC, REo/RC, RC/CSo, PIabs, DFabs, and SFIabs) were computed and presented (Strasser et al. Citation2000; Jiang et al. Citation2008; Wang et al. Citation2012) (), and the DFI was calculated from the performance index of plants (Oukarroum et al. Citation2007).
Table 1. Summary of chlorophyll fluorescence parameters from OKJIP test.
One-way ANOVA was performed on the growth characteristics and plant analysis results for each treatments. A-Ci curve parameters (Vcmax, Jmax, and Γ), chlorophyll fluorescence parameters (VJ, VK, ABS/RC, DIo/RC, PIabs, DFabs, and SFIabs), and chlorophyll and carotenoid contents were subjected to one-way ANOVA for all time points in treatment groups with significance tested at the 5% level by Duncan's multiple range test (DMRT). A, E, gs, ITE, WUEi, and Ci/Ca were tested by one-way repeated-measures ANOVA. The SPSS Statistics Program (Version 19.0) was employed for all statistical analyses.
Results and discussion
The growth environment
During the experimental period, the average daytime temperature and relative humidity were 25.9 ± 4.4 °C and 50.8 ± 17.8%, respectively, from 9 am to 7 pm. The atmospheric water VPD, representing the drying power of the atmosphere, was 2.7 kPa (). As the experiment progressed, the temperature steadily increased as compared to the change in relative humidity. After the end of the experiment in June, the weekly average temperature was as high as 32 °C, and the VPD was also very high, at 3.6 kPa. The time point featuring the highest VPD was at 2 pm on June 4, with a temperature of 36.5 °C and a relative humidity of 36.7%, whereas the VPD rose to 4.5 kPa, thereby creating a very hot and dry environment. As the temperature temporarily rose to 32.3 °C, and the VPD was 3.7 kPa on May 14, which was the initial period of the experiment (), strong stress may have been caused by the dry atmosphere at this time point.
Figure 1. Changes of temperature (a), relative humidity (b), vapor pressure deficit (c) and soil water contents (d) during the experimental period.
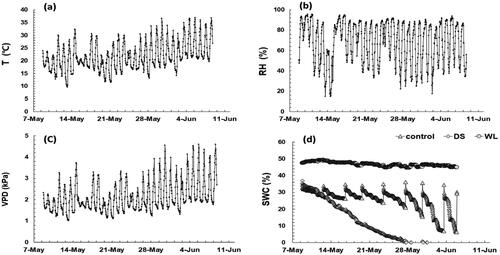
During the experimental period, the average SWC of the control group was 25.8%, and that of group WL was 46.7%. In group DS, the SWC gradually decreased from 36.8% just before the experiment to almost 0% at 21 days after treatment initiation (DAT; ).
Photosynthetic responses
As the duration of drought stress and waterlogging of P. yedoensis increased, the net photosynthesis rate (A), stomatal transpiration rate (E), and stomatal conductance (gs) continued to decrease, but the extent of the decrease differed among the groups (). Especially, a decrease in gs is known to result in a decrease in E(Kim et al. Citation2021). Group DS showed little difference from the control group up to 7 DAT, which falls into the initial period of the experiment, whereas group WL manifested a relatively large decrease, indicating that stomatal closing and the photosynthetic-rate decrease were more sensitive to waterlogging than to drought stress.
Figure 2. Changes in maximum photosynthesis rate (a), stomatal transpiration rate (b), stomatal conductance (c), instantaneous transpiration efficiency (d), intrinsic water use efficiency (e) and ratio of intercellular to atmospheric CO2 concentration (f) of Prunus yedoensis under different water conditions. Each value is expressed as the mean ± SD (n = 5). DAT: days after treatment.
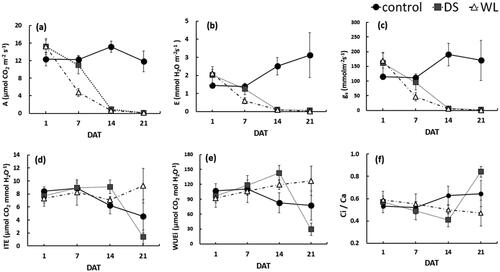
The overall photosynthetic reaction according to such indicators as A and E rapidly deteriorated in group DS owing to the decrease in gs and stomatal closing starting from 14 DAT, and these values were similar to those in group WL (), whereas the SWC at this time point was 6% ().
As for water use efficiency, group DS had the highest instantaneous transpiration efficiency (ITE) and intrinsic water use efficiency (WUEi) up to 14 DAT, the reduction of gs and E explains the increase in WUE values. These results showed that the existence of a mechanism for efficient water use even under the conditions of insufficient moisture. By 21 DAT, the ratio of CO2 in mesophyll cells not used for photosynthesis (Ci/Ca) increased significantly along with a sharp decrease in water utilization efficiency (). The decrease of WUE at 21 DAT, suggest the occurrence of non-stomatal factor such as functional and structural damage of photosynthetic apparatus, which limits the photosynthetic activity in P. yedoensis.; a similar trend was observed in Jatropha curcas (de Santana et al. Citation2017). In general, severe drought stress is known to induce stomatal closing, which leads to considerable restrictions on the supply of CO2 and moisture, and the diffusion resistance of intracellular CO2 is also known to rise, resulting in a decrease in photosynthesis (Singh and Singh Citation2003; Lee et al. Citation2014; Tsonev et al. Citation2014; Lee Citation2018). P. yedoensis showed a similar response to waterlogging stress. As presented in , most indicators underwent significant changes during the treatment period. Furthermore, there were effects of the moisture factor and an effect of the interaction of factors “duration of treatment” and “moisture” (p < 0.05). As for ITE and WUEi, there was no significant effect of the moisture factor (p > 0.05) ().
Table 2. Repeated measures ANOVA for maximum photosynthesis rate (A), stomatal transpiration rate (E), stomatal conductance (gs), instantaneous transpiration efficiency (ITE), intrinsic water use efficiency (WUEi) and ratio of intercellular to atmospheric CO2 concentration (Ci/Ca) of Prunus yedoensis under different water conditions.
The photosynthetic ability of plants is determined by the balance between the carboxylation rate according to ribulose-1,5-bisphosphate (RuBP) carboxylase/oxygenase (Rubisco) activity and the regeneration rate of RuBP, and the latter rate is limited by electron transfer efficiency (Hopkins and Hüner Citation2008). The maximum carboxylation rate (Vcmax) and the maximum electron transfer rate (Jmax) of P. yedoensis computed from the A-Ci curve tended to gradually decrease as the drought or waterlogging stress progressed. In particular, in group WL, Vcmax and Jmax dropped sharply starting from 7 DAT to 47.1 and 51.3%, respectively, as compared to 1 DAT, whereas in group DS, there was a significant decrease starting from 14 DAT (p < 0.05) (). Conversely, the CO2 compensation point (Γ) gradually increased in group DS, up to 4.1-fold at 21 DAT compared to 1 DAT. The waterlogging stress also raised Γ as the experiment progressed but without statistical significance (p > 0.05) (). The above results suggested that the carboxylation activity of Rubisco in P. yedoensis decreased starting from a relatively early period under the influence of waterlogging, thereby impairing the ability of the plant to fix CO2. Because the regeneration of RuBP was also delayed by the stress, the overall photosynthetic ability greatly diminished.
Table 3. Changes in maximum carboxylation rate (Vcmax), maximum electron transport rate (Jmax) and CO2 compensation point (Γ) of Prunus yedoensis under different water conditions.
WSD, growth characteristics, and inorganic components
There was no significant difference between groups DS and WL of P. yedoensis in the WSD up to 14 DAT as compared to 1 DAT (p > 0.05). Visually, however, leaf sagging was noted in group DS (). This group featured a very sharp upsurge of WSD, by 6.9-fold (WSD of 21.9%) after 21 DAT and by 11.7-fold (WSD of 37.4%) after 28 DAT, as compared to 1 DAT (p < 0.05) (); almost no water was absorbed by group WL plants at 21 DAT, indicating severe damage to mesophyll tissue ( and ). These data revealed that the amount of moisture supplied to the leaves was reduced by the lack of soil moisture under continuous drought stress, thereby yielding a prominent increase in WSD. This trend was observed in many studies, for example, an increase in WSD of Oplopanax elatus and Dendropanax morbiferus by about 20-fold due to drought (Lee et al. Citation2014; Lee Citation2018) and a decrease in the relative water content of Quercus ilex and Citrus species (Tsonev et al. Citation2014). In particular, for citrus plants, there was no significant change in the relative water content of the leaves during waterlogging (García-Sánchez et al. Citation2007), in line with the results of our experiment on P. yedoensis. Accordingly, WSD is likely to be an effective indicator of drought stress; in particular, an increase in the WSD of P. yedoensis to 20% may indicate drought damage.
Figure 3. Changes in water saturation deficits (a), height growth (b) and root collar growth (c) of Prunus yedoensis under different water conditions. Each bar is expressed as the mean ± SD (n = 5). Means with difference letters are significantly different by DMRT Test (p < 0.05). DAT: days after treatment; ns: non-significance; n.d.: not detected.
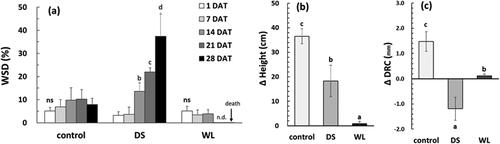
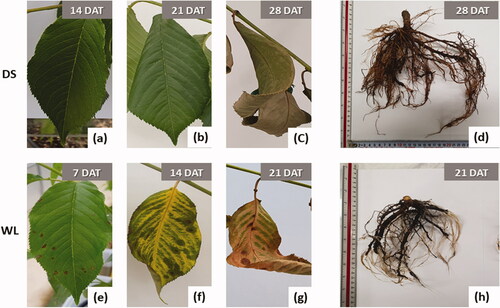
Figure 4. Visual damage of drought treatment (a–d) and waterlogging treatment (e–h) during the experimental period. DAT: days after treatment.
The increases in height and DRC were very small after the drought stress and waterlogging. Within 4 weeks after treatment initiation, most of the seedlings in group WL barely differed in these parameters from the data point before the experiment. Although in the control group, the DRC enlarged by 1.47 ± 0.39 mm, the DRC change in group DS was −1.19 ± 0.45 mm, showing a reduction by 9.2% as compared to the time point before treatment (). This trend was in contrast to the finding that group DS achieved about 50% of the growth seen in the control group, thus manifesting a decrease in the dry weight of the stem (). A decrease in dry weight of the stem in Jatropha curcas has been reported too (de Santana et al. Citation2017). P. yedoensis showed active growth in height at the early stages of drought stress, but under continuous stress, the growth in height became stagnant, resulting in an overall value lower than that in the control group. As the drought stress continued, the water supply for photosynthesis became blocked, and the water consumed by metabolic activity could not be restored in time, thereby giving rise to water deficiency in the tissue.
Table 4. Growth characteristics of Prunus yedoensis under different water conditions.
The dry weight of plant parts could be ranked in the order “control > group DS > group WL,” and the latter group featured the smallest overall growth. In general, it is known that the T/R ratio decrease under drought conditions (Seiler and Johnson Citation1988), but the T/R ratio of P. yedoensis showed the opposite tendency (). It is considered that to be because the decrease in root growth due to drought stress is more than that in the top (leaf and shoot). This trend was observed in several studies, for example, Acacia mangium (Lee et al. Citation2010), Salix gracilistyla (Nakai et al. Citation2010), Liriodendron tulipifera (Kim and Han Citation2015) and Jatropha (de Santana et al. Citation2017). In group WL, the total dry weight was only 24% of that in the control group (). In particular, there was no significant difference in the LWR between the treatment, but the T/R ratio was the highest with relatively low RWR, indicating well-pronounced deceleration of root growth owing to waterlogging stress ( and ).
This tendency is known to be due to the hindering of plant root respiration by waterlogging, making it difficult to absorb nutrients and obtain the energy necessary for material transport (Boru et al. Citation2003; Ryan and Law Citation2005). In contrast, Waterlogging has been reported to promote biomass growth in Fraxinus velutina and Salix spp. (Zhao et al. Citation2014). Most of these species are resistant to waterlogging, and in general, total dry weight is known to decrease (Domingo et al. Citation2002).
shows the inorganic-component of P. yedoensis in its leaves and roots. Among these components, the total nitrogen content was found to be higher in groups DS and WL than in the control group for both leaves and roots. Ca, Mg, and K levels of both leaves and roots in group WL were the lowest among all groups. The K content of the leaves was 30.8% higher in group DS than in the control group (p < 0.05), but in group WL, there was no significant difference from the control. K is known to activate many enzymes involved in photosynthesis and respiration and to perform an important function in osmoregulation (Hopkins and Hüner Citation2008). On the other hand, Ca and Mg concentrations in leaves and Mg and K concentrations in roots were somewhat lower in group WL than in the control group, with apparent discoloration of leaves (). Mg is a structural component of chlorophyll porphyrin, and in the case of deficiency, with prominent discoloration of the leaves, a simultaneous deficiency in Ca, which maintains membrane stability of dividing cells, is known to cause malformation or necrosis of young leaves (Hopkins and Hüner Citation2008).
Table 5. Inorganic components in leaf and root of Prunus yedoensis under different water conditions.
Overall, an increase in Ca, Mg, K, and Na levels in group DS points to a mechanism improving the absorption of inorganic ions under stress and thereby increasing concentrations of inorganic solutes in plant cells and promoting the osmoregulatory ability. In group WL, the absorption of essential nutrients was reduced by the accumulation of toxic components due to the blockage of oxygen supply to the roots, in line with a trend in citrus species documented by García-Sánchez et al. (Citation2007).
As a result, under drought stress, P. yedoensis showed a significant increase in the K content of leaves, which is strongly associated with the osmoregulatory function, and under waterlogging stress, there was a decrease of Mg and Ca levels in leaves, leading to their visible discoloration.
Chlorophyll and carotenoid contents
In group DS of P. yedoensis, the total chlorophyll and carotenoid contents were higher by 30 and 38%, respectively, at 28 DAT than at 1 DAT. In group WL, the total chlorophyll content and the carotenoid content gradually rose until 4 DAT, and these parameters significantly dropped by 21 DAT, just before withering. Compared to 1 DAT, the total chlorophyll content was 60.2%, and the carotenoid content was 83.6% at 28 DAT (). Waterlogging causes chlorophyll decomposition (Kozlowski Citation1997), and drought stress is reported to reduce the total chlorophyll content in Albizia lebbeck, Cassia siamea, and Oplopanax elatus because the lack of moisture in leaves causes damage to the chloroplast membrane (Saraswathi and Paliwal Citation2011; Lee et al. Citation2014). Nevertheless, a different trend was observed in group DS of P. yedoensis.
Table 6. Changes in chlorophyll (Chl) and carotenoid (Car) contents of Prunus yedoensis under different water conditions.
This tendency for increasing WSD suggests that the chlorophyll content was increasing—as compared to the live wet weight of the leaves—owing to the lack of moisture in the leaves. In particular, to reduce the interference caused by strong light, the plants were grown under 30% light blockage; as a result, we found that shaded light seems to strongly affect the color of the leaves maintained until just before withering (). In addition, the Chl a/b ratio tended to decrease with increasing duration of both drought stress and waterlogging. In group DS, this effect was explained by a significant increase in the amount of Chl b as compared to the chlorophyll a amount. In group WL, however, the Chl a/b ratio decrease was caused by a significant increase in the Chl b content until 14 DAT, but a sharp decrease in the Chl a amount was the main reason for the decrease in the Chl a/b ratio at 21 DAT (). Salix integra cv. hongpi is also reported to undergo obvious Chl a downregulation due to waterlogging (Zhao et al. Citation2014). According to these results, P. yedoensis experiences a relatively rapid decrease in the leaf pigment amount with increasing waterlogging stress, in particular, a prominent decrease in the amount of Chl a, which is mainly bound to the reaction center (Evans Citation1987).
Chlorophyll a fluorescence
The OKJIP curve was used to compare chlorophyll fluorescence responses between the DS and WL groups of P. yedoensis ( and ). The subtle changes in chlorophyll fluorescence, VK and VJ, mean that the ratio of total fluorescence changed relative to the alterations at each step (K and J). While there was no significant change in the control group, a significant increase was observed at 28 DAT in group DS and at 21 DAT in group WL (p < 0.05) (). The increase in VK means that electron transport (after the initial electron acceptor QA− in photosystem II) is inhibited due to inactivation of the oxygen-evolving complex (Wang et al. Citation2012; Lee Citation2018). This phenomenon appears to be a stress response with a delay in the recovery of electron acceptors. In particular, in group DS, there was a gradual increase in VK with the increasing duration of drought stress and a tendency for an increase by 3.8-fold under severe stress at 28 DAT, just before withering, as compared to that at 1 DAT. However, Group WL showed a gradual increase in VJ, which means a reduction in the ratio of QA (QA−) to the reaction center of photosystem II with increasing duration of waterlogging stress (). To generate QA− in the photosynthetic electron transport chain, electrons must be transported through pheophytin (Pheo). Because this period is very short, electrons cannot move and end up accumulating excessively under severe stress such as drought or waterlogging conditions. This blockage of electron transport at the receptor site of photosystem II manifests itself as VJ upregulation (Zhang et al. Citation2018).
Figure 5. Changes in several chlorophyll fluorescence parameters (VJ (a), VK (b), ABS/RC (c), DIo/RC (d), PIabs (e), DFabs (f), SFIabs (g) and Drought factor index (h)) of Prunus yedoensis under different water conditions. Each bar is expressed as the mean ± SD (n = 5). Means with difference letters are significantly different by DMRT Test (p < 0.05). DAT: days after treatment; ns: non-significance.
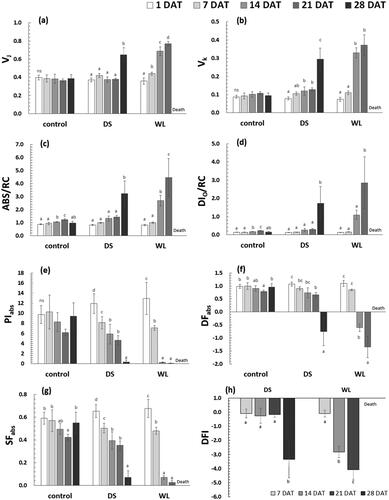
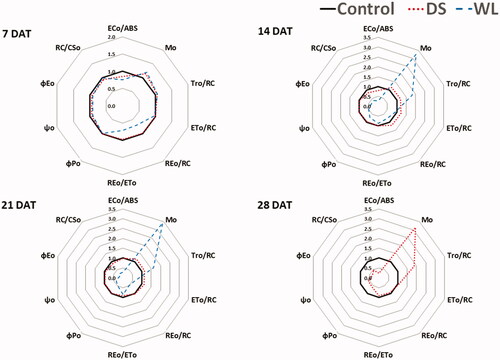
Figure 6. Radar plots of several chlorophyll fluorescence parameters (ECo/ABS, Mo, TRo/RC, ETo/RC, REo/RC, REo/ETo, ΦPO, ΦEO, ΨO and RC/CSo) of Prunus yedoensis under different water conditions. The values of the calculated parameters were shown as relative to those of the control (n = 5).
ABS/RC denotes absorbed light energy per reaction center, and DIo/RC means energy emitted as heat and not captured by the reaction center (Strasser et al. Citation2000). ABS/RC and DIo/RC of P. yedoensis had a tendency similar to that of VK and VJ, with group DS experiencing a sharp increase at 28 DAT, and group WL starting from 14 DAT (p < 0.05) (). These results can be interpreted as the existence of a mechanism preventing damage to the photosynthetic apparatus under drought or waterlogging stress, with deactivation of reaction centers and dissipation of excitation energy as heat (Wang et al. Citation2012; Ceusters et al. Citation2019; Lee et al. Citation2021).
PIabs, DFabs, and SFIabs serve as vitality indices of the photosynthetic apparatus under various types of environmental stress and have proven to be sensitive indicators of environmental stress (Strasser et al. Citation2000; Boureima et al. Citation2012; Wang et al. Citation2012; Zushi et al. Citation2012). PIabs denotes energy conservation efficiency in the process of reducing electron carriers by means of absorbed light energy, DFabs indicates the driving force of photosynthesis, and SFIabs characterizes the molecular structure and function of the photosynthetic apparatus (Dudeja and Chaudhary Citation2005; Demetriou et al. Citation2007). In case of P. yedoensis, PIabs and SFIabs obviously diminished with increasing duration of drought stress and waterlogging, whereas DFabs dropped sharply at the time point of severe stress (at 28 DAT in group DS and at 14 DAT in group WL). Furthermore, in group DS, PIabs decreased to less than 50% starting from 14 DAT as compared to 1 DAT, but SFIabs stayed over 50% even at 21 DAT, suggesting that PIabs is a more sensitive indicator of stress. A similar trend was seen in group WL (). Therefore, in P. yedoensis, PIabs and SFIabs decrease starting from the early stages of drought and waterlogging stresses, with PIabs undergoing a more pronounced decline. DFabs appears to strongly decrease at the time of relatively severe stress. In addition, with an increase in the drought stress and waterlogging stress in groups DS and WL, photochemical damage to photosystem II, such as a reduction in vitality indices, probably was responsible for the nonstomatal factors’ contributing to the reduction in the net photosynthetic rate (García-Sánchez et al. Citation2007).
Oukarroum et al. (Citation2007) presented the DFI as a drought stress indicator based on PIabs, which was recently used in many studies, for example, in the selection of cultivars resistant to drought damage (Boureima et al. Citation2012; Paul et al. Citation2016; Sousaraei et al. Citation2021). Nevertheless, because a sharp drop of the DFI was observed in both groups DS and WL of P. yedoensis (p < 0.05) (), it is difficult to regard the DFI as a specific indicator of drought stress, and it seems more appropriate to employ this parameter as a performance index under various types of environmental stress.
presents changes in the chlorophyll fluorescence index as a function of drought or waterlogging stress duration, as compared to the control group. Although the timing of a prominent response to stress was different between groups WL and DS, there were decreasing trends of ECo/RC, REo/ETo, ΦPO, ΦEO, ΨO, and RC/CSo, whereas Mo and TRo/RC had an increasing tendency. In particular, a decline of reaction center activity (RC/CSo) and enhanced reaction center closure (Mo) lead to a decrease in electron transfer (ECo/RC) per unit of absorbed light energy (Demetriou et al. Citation2007). As a consequence, energy transfer ratios decreased for each step of the photochemical reaction (ΦPO, ΦEO, and ΨO in ).
The indicators that were significantly different between groups DS and WL included ETo/RC and REo/RC. In particular, ETo/RC and REo/RC significantly diminished in group WL as compared to the control group, indicating obvious inhibition of electron transport per reaction center and electron transfer intended to reduce the reaction center (P700) of photosystem I after QA reduction (Jiang et al. Citation2008). Some researchers reported that ETo/RC in Erythrina crista-galli does not change with prolonged waterlogging, but REo/RC significantly declines after 30 days of waterlogging (Larré et al. Citation2013). In Physocarpus amurensis, a 36% decrease in ETo/RC was registered after 16 days of waterlogging (Zhang et al. Citation2018), in agreement with the above findings.
In group DS, however, ETo/RC went up slightly with no significant shift of REo/RC, suggesting that the reaction of transfer of light energy to photosystem I was proceeding relatively efficiently (Lee et al. Citation2021).
Conclusion
Overall growth indices of P. yedoensis such as tree height, DRC, dry weight of each part (leaf, stem, and root), and total dry weight could be ranked in decreasing order as control > group DS > group WL. In particular, there was marked deceleration of root growth in group WL, and DRC in group DS diminished by 9.2% as compared to the data point before the experiment. As for WSD, there was no significant alteration in group WL, whereas group DS featured a sharp increase to WSD of 37.4% at 28 DAT, suggesting high potential of WSD as a specific indicator of drought stress. An increase in WSD to about 20% is likely to indicate drought damage. And also, the Chl a/b ratio tended to decrease with increasing waterlogging stress, in particular, a prominent decrease in the amount of Chl a.
In group WL, there was a sharp decline of photosynthetic indicators such as A, gs, E, Vcmax, and Jmax starting from 7 DAT, whereas group DS manifested a significant decrease starting from 14 DAT, and the reduction in photosynthetic activity was more sensitive to stress in group WL than in group DS. Therefore, these water stresses have exerted a negative effect on growth of P. yedoensis through reductions in gas exchange and biomass production. Furthermore, the increase in WUE with reduction of gs and E, indicating the existence of a mechanism for efficient water use even under the conditions of insufficient moisture.
The DS group had higher levels of leaf and root inorganic components than group WL did, and this finding may be related to an improvement of the osmoregulatory ability. The overall nutritional status of group WL was low due a worsened absorption function of the roots, and yellowing of the leaves was induced by a lack of Ca and Mg.
In both groups DS and WL, energy transfer rates of photochemical reactions, e.g. ΦPO, ΦEO, and ΨO, declined, as did vitality indices of the photosynthetic apparatus, e.g. PIabs, DFabs, and SFIabs. PIabs in particular underwent a pronounced decrease in the initial period of stress, but thereafter, under severe stress, a DFabs drop was the most sensitive indicator of stress. The indicators that were significantly different between groups DS and WL included ETo/RC and REo/RC. In group WL, there was a decrease in ETo/RC and REo/RC, whereas in group DS, slight elevation was documented or almost no change. Consequently, PIabs, DFabs, SFIabs, and DFI were found to be highly sensitive indicators of environmental stress, whereas WSD, DRC growth, Chl a, ETo/RC, and REo/RC appear to have high potential as diagnostic indicators of drought and/or waterlogging damage.
Disclosure statement
No potential conflict of interest was reported by the author(s).
Additional information
Funding
References
- Arnon DI. 1949. Copper enzymes in isolated chloroplasts. Polyphenoloxidase in Beta vulgaris. Plant Physiol. 24(1):1–15.
- Boone R, Westwood R. 2006. An assessment of tree health and trace element accumulation near a coal-fired generating station, Manitoba, Canada. Environ Monit Assess. 121(1–3):151–172.
- Boru G, Vantoai T, Alves J, Hua D, Knee M. 2003. Responses of soybean to oxygen deficiency and elevated root-zone carbon dioxide concentration . Ann Bot. 91(4):447–453.
- Boureima S, Oukarroum A, Diouf M, Cisse N, Van Damme P. 2012. Screening for drought tolerance in mutant germplasm of sesame (Sesamum indicum) probing by chlorophyll a fluorescence. Environ Exp Bot. 81:37–43.
- Ceusters N, Valcke R, Frans M, Claes JE, Van den Ende W, Ceusters J. 2019. Performance index and PSII connectivity under drought and contrasting light regimes in the CAM orchid Phalaenopsis. Front Plant Sci. 10:1012.
- de Santana T. A d, Silva L. D d, Oliveira P. S d, Benjamin CS, Ramos EP, Júnior J. O d S, Gomes FP, State University of Santa Cruz, Department of Biological Sciences, Ilhéus, Ba 45662900, Brazil 2017. Leaf gas exchange and biomass partitioning in Jatropha curcas L. young plants subjected to flooding and drought stresses. Aust J Crop Sci. 11:792–798.
- Demetriou G, Neonaki C, Navakoudis E, Kotzabasis K. 2007. Salt stress impact on the molecular structure and function of the photosynthetic apparatus-the protective role of polyamines. Biochim Biophys Acta. 1767(4):272–280.
- Domingo R, Pérez-Pastor A, Ruiz-Sánchez MC. 2002. Physiological responses of apricot plants grafted on two different rootstocks to flooding conditions. J Plant Physiol. 159(7):725–732.
- Dudeja SS, Chaudhary P. 2005. Fast chlorophyll fluorescence transient and nitrogen fixing ability of chickpea nodulation variants. Photosynt. 43(2):253–259.
- Evans JR. 1987. The dependence of quantum yield on wavelength and growth irradiance. Functional Plant Biol. 14(1):69–79.
- García‐Sánchez F, Syvertsen JP, Gimeno V, Botía P, Perez‐Perez JG. 2007. Responses to flooding and drought stress by two citrus rootstock seedlings with different water‐use efficiency. Physiol Plant. 130(4):532–542.
- Hiscox JD, Israelstam GF. 1979. A method for the extraction of chlorophyll from leaf tissue without maceration. Can J Bot. 57(12):1332–1334.
- Hopkins WG, Hüner NPA. 2008. Introduction to plant physiology. New York, USA: John Wiley and Sons.
- Jiang H-X, Chen L-S, Zheng J-G, Han S, Tang N, Smith BR. 2008. Aluminum-induced effects on Photosystem II photochemistry in citrus leaves assessed by the chlorophyll a fluorescence transient. Tree Physiol. 28(12):1863–1871.
- Kim GN, Han SH. 2015. Effects on growth, photosynthesis and pigment contents of Liriodendron tulipifera under elevated temperature and drought. Korean J Agr for Meteorol. 17(1):75–84.
- Kim H, Jo H, Kim GJ, Kim HS, Son Y. 2021. Short-term physiological responses of Larix kaempferi seedlings to spring warming and drought manipulation. Forest Sci Technol. 17(4):197–205.
- Korea Meteorological Administration. 2020. Korea climate change assessment report 2020. Seoul, Korea: KMA.
- Kozlowski TT. 1997. Responses of woody plants to flooding and salinity. Tree Physiol. 1:1–29.
- Larré CF, Fernando JA, Marini P, Bacarin MA, Peters JA. 2013. Growth and chlorophyll a fluorescence in Erythrina crista-galli L. plants under flooding conditions. Acta Physiol Plant. 35(5):1463–1471.
- Lee KC. 2018. Change of photosynthesis performance and water relation parameters in seedling of Korean dendropanax under drought stress. KJMCS. 26(2):181–187.
- Lee KC, An J, Hwang JE, Kim PB, Park HB, Kim S, Park HJ, Lee CW, Lee B-D, Kim NY, et al. 2021. Effects of light condition on growth and physiological characteristics of the endangered species Sedirea japonica under RCP 6.0 climate change scenarios. Plants. 10(9):1891.
- Lee SW, Cho MS, Kim GN. 2010. Effect of different irrigation period on photosynthesis and growth performances of containerized seedling of Eucalyptus pellita and Acacia mangium. J Korean Forest Soc. 99(3):414–422.
- Lee ME, Hwang KT, Kim SY, Chung JW. 2018. Adsorption of Pb (II) by cherry (Prunus × yedoensis) leaf-derived biochar. J Korea Org Resour Recycl Assoc. 26(2):33–41.
- Lee KC, Kim SH, Park WG, Kim YS. 2014. Effects of drought stress on photosynthetic capacity and photosystem II activity in Oplopanax elatus. Korean J Medicinal Crop Sci. 22(1):38–45.
- Lichtenthaler HK. 1987. Chlorophylls and carotenoids: pigments of photosynthetic biomembranes. Methods Enzymol. 148:350–382.
- Martinis R, Socco LV, Sambuelli L, Nicolotti G, Schmitt O, Bucur V. 2004. Ultrasonic tomography on standing trees. Ann for Sci. 61(2):157–162.
- Nakai A, Yurugi Y, Kisanuki H. 2010. Stress responses in Salix gracilistyla cuttings subjected to repetitive alternate flooding and drought. Trees. 24(6):1087–1095.
- National Institute of Forest Science. 2020. Survey on the current status of living space tree management in 2019. Research Report of NIFS. Vol. 854. Seoul, Korea: NIFS.
- Nidumolu U, Crimp S, Gobbett D, Laing A, Howden M, Little S. 2014. Spatio-temporal modelling of heat stress and climate change implications for the Murray dairy region, Australia. Int J Biometeorol. 58(6):1095–1108.
- Oukarroum A, El Madidi S, Schansker G, Strasser RJ. 2007. Probing the responses of barley cultivars (Hordeum vulgare L.) by chlorophyll a fluorescence OLKJIP under drought stress and re-watering. Environ Exp Bot. 60(3):438–446.
- Paul K, Pauk J, Deák Z, Sass L, Vass I. 2016. Contrasting response of biomass and grain yield to severe drought in Cappelle Desprez and Plainsman V wheat cultivars. PeerJ. 4:e1708.
- Plamping K, Haigh M, Cullis MJ, Jenkins RE. 2009. Evaluation of cambial electrical resistance for the appraisal of tree vitality on reclaimed coal lands. Int J Min Reclam Environ. 23(1):21–32.
- Ryan MG, Law BE. 2005. Interpreting, measuring, and modeling soil respiration. Biogeochemistry. 73(1):3–27.
- Rybka K, Janaszek-Mańkowska M, Siedlarz P, Mańkowski D. 2019. Machine learning in determination of water saturation deficit in wheat leaves on basis of Chl a fluorescence parameters. Photosynt. 57(1):226–230.
- Saraswathi SG, Paliwal K. 2011. Drought induced changes in growth, leaf gas exchange and biomass production in Albizia lebbeck and Cassia siamea seedlings. J Environ Biol. 32:173–178.
- Seiler JR, Johnson JD. 1988. Physiological and morphological responses of three half-sib families of loblolly pine to water-stress conditioning. For Sci. 34(2):487–495.
- Sharkey TD, Bernacchi CJ, Farquhar GD, Singsaas EL. 2007. Fitting photosynthetic carbon dioxide response curves for C(3) leaves. Plant Cell Environ. 30(9):1035–1040.
- Singh B, Singh G. 2003. Biomass partitioning and gas exchange in Dalbergia sissoo seedlings under water stress. Photosynt. 41(3):407–414.
- Son J, Kim S, Shin J, Lee G, Kim H. 2021. Reliability of non-destructive sonic tomography for detection of defects in old Zelkova serrata (Thunb.) Makino trees. Forest Sci Technol. 17(3):110–118.
- Sousaraei N, Mashayekhi K, Mousavizadeh SJ, Akbarpour V, Medina J, Aliniaeifard S. 2021. Screening of tomato landraces for drought tolerance based on growth and chlorophyll fluorescence analyses. Hortic Environ Biotechnol. 62(4):521–535.
- Strasser RJ, Srivastava A, Tsimilli-Michael M. 2000. The fluorescence transient as a tool to characterize and screen photosynthetic samples. In: Mohanty P, Yunus M, Pathre U, editors. Probing photosynthesis: mechanism, regulation and adaptation. London, UK: Taylor and Francis; p. 445–483.
- Tsonev T, Wahbi S, Sun P, Sorrentino G, Centritto M. 2014. Gas exchange, water relations and their relationships with photochemical reflectance index in Quercus ilex plants during water stress and recovery. Int J Agric Biol. 16:335–341.
- Wang ZX, Chen L, Ai J, Qin HY, Liu YX, Xu PL, Jiao ZQ, Zhao Y, Zhang QT. 2012. Photosynthesis and activity of photosystem II in response to drought stress in amur grape (Vitis amurensis Rupr.). Photosynt. 50(2):189–196.
- Zhang H, Feng P, Yang W, Sui X, Li X, Li W, Zhang R, Gu S, Xu N. 2018. Effects of flooding stress on the photosynthetic apparatus of leaves of two Physocarpus cultivars. J for Res. 29(4):1049–1059.
- Zhao HF, Zhao Y, Zhang C, Tao X, Xu XN. 2014. Growth, leaf gas exchange, and chlorophyll fluorescence responses of two cultivars of Salix integra Thunb. to waterlogging stress. J Agric Sci Technol. 16:137–149.
- Zushi K, Kajiwara S, Matsuzoe N. 2012. Chlorophyll a fluorescence OJIP transient as a tool to characterize and evaluate response to heat and chilling stress in tomato leaf and fruit. Sci Hortic. 148:39–46.