
 ?Mathematical formulae have been encoded as MathML and are displayed in this HTML version using MathJax in order to improve their display. Uncheck the box to turn MathJax off. This feature requires Javascript. Click on a formula to zoom.
Abstract
In Ethiopia, particularly in Southern Oromia and Eastern Halaba, land degradation is a common challenge for the pastoral community and farmers. As a result, the sub-watershed has closed for the past five years. However, little is known about the effects of topography on the rehabilitation of various land uses and land covers (LULCs). This study determined how the main topographic variables affect the rate of rehabilitation. Sentinel-2 images were used to quantify land use and land cover for the years 2017 and 2021. The aspect, altitude, and slope were calculated using the SRTM of 1 Arc-Second Global. The Maximum Likelihood classifier algorithm was used for supervised image classification. Changes in LULCs were analyzed using the post-classification technique. The LULC maps were overlaid with the topographic variabilities. The topographic variability’s influences were clearly observed on the rehabilitation rate of area enclosure. In the slope class of 0 to 5%, agriculture is the dominant cover. The bushland was largely detected in the slope classes of 0 to 10 in 2017. Agriculture and barren land were influenced as altitude and slope increased. Forest and bushland were found to be highly restored at an altitude of 1841 to 1880, an aspect of the south, and slope classes of 0 to 5 percent.
1. Introduction
Land cover is the bio-physical feature cover on the earth's surface. Whereas, land use is related to the human activities on the land cover types to maintain, produce, or change nature. Explanation of land use in this way establishes a direct link between land cover and the actions of people in their environment (FAO Citation2000; Martínez and Mollicone Citation2012). Knowledge about land use and land cover has become increasingly important as the nation plans to overcome the problems of haphazard, uncontrolled development, deteriorating environmental quality, loss of major agricultural lands, degradation of wetlands, and loss of biodiversity habitat in general. Land use data are needed for the analysis of environmental processes and problems t must be understood if living conditions and standards are to be improved or maintained at current levels (James et al., Citation1976; Andreas et al., Citation2012).
In 2000, sub-Saharan Africa was covered by slightly more than 17% of agriculture, almost 20% of forests, 60% of non-forest natural vegetation such as wood and shrublands and savannas, and 2.5% of barren land, excluding permanent deserts. The study from the year 1975–2000 reveals that sub-Saharan Africa has lost about 130 million hectares (Mha) of natural vegetation. The land is a critical resource for supporting the livelihood of Eastern African farmers, and there has been a regular decrease in the magnitude of land ownership per household. Following the demand for land, land use and land cover changes (LULCCs) in this region have resulted in a decline of natural forests to human settlements, urban centers, farmlands, and grazing lands.
In Ethiopia, the dynamism of land use and land cove (LULC) observed in recent decades is principally due to population pressure, resettlement programs, climate change, and other interactions with human nature (Motuma et al. 202; Habte et al. Citation2021). As a result, in Ethiopia land degradation in the form of soil erosion and declining fertility is a serious challenge to agricultural productivity and economic growth (Lemenih Citation2004). Due to the inherent interrelationships that exist between the various physical factors, erosion has effects on the environment that are more extensive than direct damage in the specific area where soils have been lost (Abiy Citation2008). As a result, there are different types of soil and water conservation techniques in practice. Recently, area enclosure is one of the most practised techniques in the country.
A Large-scale effort for implementing natural resource conservation and development programs started in Ethiopia in the 1970s. Before this program, the farmers have developed different traditional soil conservation and land management practices (Dessalew Citation2022). According to Kelbore (Citation2015) the trend of land rehabilitation practice in Ethiopia has increased from time to time. The rehabilitation interventions have resulted in dramatic bio-physical changes within a few years. Tree planting, coupled with the natural regeneration of native woody species from the soil seed bank and seed rain, has resulted in the formation of a young secondary forest (Mulualem et al. Citation2014). According to the majority of the researchers, there is an increasing trend of soil and water conservation practices in Ethiopia, particularly in area enclosure. However, as far as the researcher’s knowledge is concerned, there is a research gap on the influence of topographic variability’s on the rehabilitation rate of degraded land.
Considering topographic factors in relation to an enclosed area with land use and change in land cover is very important to improve the effectiveness of the enclosed area. Therefore, this study was conducted (i) to quantify the change in land use and land cover in the area for the past 5 years; (ii) to analyze the main topographic variables (altitude, slope and aspect) with the land use and land cover change (LULCC); and (iii) to study the relationships of topographic variabilities with land use and land cover (LULC) changes. This study can provide useful information to an expert and public policy maker in order to; ensure effective sub-watershed-based restoration and management of resources.
2. Materials and methods
2.1. Description of study area
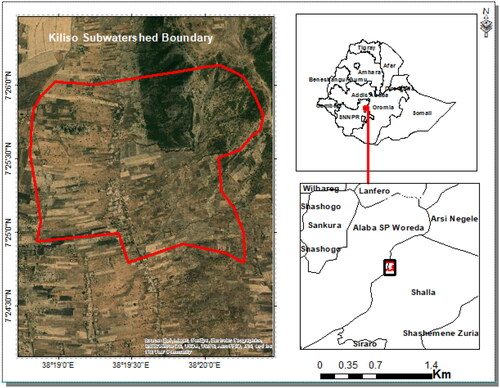
The study sub-watershed is located at the southern end of the Oromia region, the West Arsi zone and the eastern parts of the Halaba zone of the Southern Nationalities and Peoples Regional State (SNNPRs), Ethiopia. The study site is located at a distance of 285 kilometers from Addis Ababa, the Ethiopian capital. Geographically, the sub-watershed is situated between 7°24′30″ to 7°26′00″ N (latitude) and 38°19′00″ to 38°20′00″ E (longitude). The total area of the study site boundary is 545.12 hectares (). The Kiliso sub-watershed has been protected from human and animal intervention since 2017. The Grevillea robusta tree was one of the most planted species during the study periods. The Dichrostrachyscinocera species regenerated dominantly after the area enclosed.
The slopes of the study area range from flat to steep. The study area lies in an elevation range of 1940 m to 2041 m above mean sea level. The rainy season is between May and September, while the remaining months are mostly dry (). The annual minimum and maximum rainfall are 600.6 and 1020.4 mm, respectively. Monthly minimum temperatures ranged from 9.72 °C to 13.32 °C in the months of January and July, and monthly maximum temperatures also ranged from 25.16 °C to 30.36 °C in August and March, respectively (Fick and Hijmans Citation2017).
Figure 1. Monthly maximum and minimum temperature ranges and annual rainfall records 2017–2021.
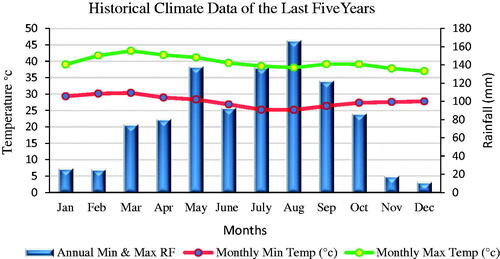
Figure 2. Location of the kiliso sub-watershed.
2.2. Methods
2.2.1. Data types and sources
The Sentinel-2 images and DEM were downloaded free of charge from the United States Geological Survey (USGS) via (http://earthexplorer.usgs.gov/; retrieved on September 24, 2021). The two independent year scenes of images were acquired of January 2017 and 2021. The selection of images from the archive considered the cover of cloud and haze effects. The Sentinel-2 images have 13 spectral bands with different spatial resolutions of 10 meters, 20 meters, and 60 m. From those bands, band 2, 3, 4, 5, 6, 7, 8, 8 A, 11, were selected for the classification. To generate slope, aspect, and altitude, the shuttle radar topography mission (SRTM) of 1 Arc-Second Global of the 30-m spatial resolution was used. In addition to the foregoing, a historical, high-resolution free Google Earth pro with datum of WGS84 was used for image classification and accuracy evaluation.
For the years 2017 and 2021, 200 and 160 respective random samples were generated for classification and accuracy assessment in the ArcGIS environment. Out of 360 random points, 100 and 80 random points from the years 2017 and 2021 were used to develop the area of interest for classification. The random points were overlaid on the corresponding Sentinel-2 image and compared by navigating to Google Earth’s historical image archives for 2017 and 2021. Google Earth is a free, visually appealing, and powerful tool for mapping small geographic areas (Tilahun and Teferie Citation2015; Rwanga and Ndambuki Citation2017). Furthermore, the classification of land use and land cover types had been verified by using Google Earth and field observation with the remaining random sample points. A focus group discussion was conducted in 2021 to identify land cover change types and classification verification.
2.2.2. Digital image processing
Satellite imagery has evidenced human impacts on land cover on a large scale. They showed cities, the pattern of deforestation, international borders, and even land-cover changes (LCC) and their impacts from space (Molders Citation2012). Sentinel-2 images of two different time series data were pre-processed using open-source Semi-Automatic Classification Plugin in QGis 3.18 environment. This plugin provides several tools for the download of free images, the preprocessing, the post processing, and the raster calculation (Congedo Citation2022). The land use classification was defined according to the Anderson (Citation1996) classification scheme. The semi-automatic classification plugin was used to classify the land use land cover of the area. In the pre-processing category, radiometric and geometric calibrations were implemented. The earth reference system of the study datum was WGS 84 UTM Zone 37. Radiometric calibration of the images helped remove haze and noise effects. The nine selected bands were converted to top of atmosphere reflectance with the quantification value provided in the metadata. Simultaneously the dark object subtraction (DOS) was executed with the assumption that, within the image some pixels are in complete shadow and their radiances received at the satellite are due to atmospheric scattering (Wade 2019; Congedo Citation2022). Furthermore, the images were enhanced for better visual interpretation. Firstly, the researcher used unsupervised classification (ISO cluster) to guess the total available land cover in the area. This helps to judge and get a hint of the available physical features on the land (Al-Fares Citation2013). The supervised type of digital image classification was then implemented through a maximum likelihood classification algorithm. According to Canty (Citation2009), maximum likelihood classification is extremely fast as it considers a small number of parameters to estimate. To prepare the map for the years 2017 & 2021, 125 (out of 200) and 100 (out of 160) sample points were used to identify signatures respectively. The prepared land use land cover maps were edited and cleared of wrongly assigned or classified pixels using the tool “Edit Raster”. For the smoothing purpose of classification, the sieve tool was used (Congedo Citation2022).
Thus, decisions about resources require maps, and effective decisions require accurate maps or at least maps of known accuracy (Congalton and Green Citation2009; Owojori and Xie, Citation2005). Accuracy assessment was carried out using the remaining 135 sample points that were not used for signature development. The confusion matrix was retrieved and the accuracies of the producers and users and the Kappa statistics were calculated from the error matrix. Kappa coefficient, which measures the agreement between the classification map and the reference data, was calculated according to Al-Fares (Citation2013) (EquationEq. 1(1)
(1) )
(1)
(1)
Where:
n total number of pixels used for testing the accuracy of a classifier, p number of classes,
∑xii sum of diagonal elements of confusion matrix,
∑xio sum of row i,
∑xoi sum of column i
The percentage share of each LULC type in a study area was computed as:
(2)
(2)
Where xi and Y are the area of the i-th LULC type and the study area.
2.2.3. Land cover land use change analysis
Digital change detection permits the quantification of temporal phenomena from multi-date imagery of multispectral sensors (Molders, Citation2012). There are different types of land use and land cover change detection approaches (Mausel et.al, 2005). But in this specific research the post-classification approach was used. According to Molders (Citation2012) and, Al-Fares, (Citation2013) the post-classification change detection approach concerned the analysis of the differences between two or more independently classified images. The changes in land use and land cover (LULC) in the study area were calculated using the semi-automatic post-processing plugin tool of post-processing. The Semi-Automatic Classification Plugin (SCP) is a free open source plugin for QGIS that allows for the semi-automatic classification (also known as supervised classification) of remote sensing images (Congedo, Citation2022). The changes were implemented by loading the 2017 classification layer as a reference classification and the 2021 classification as a new classification (Fichera et al. Citation2012; Vivekananda et al. Citation2021). Finally, the generated land cover change matrix was used to show the conversion of one land use class to another.
The data of the focus group discussion were narrated side by side with the changing land use/land cover. In the ArcGIS 10.8 environment, the cross-tabulation technique was used to determine the quantitative conversion from a particular land cover category to another land cover. It resulted in new thematic maps. Therefore, new thematic maps were produced from the two independent period maps of the study area, containing different combinations of ‘from - to’ change classes. According to Hassen and Assen (Citation2017), the percentage share of each LULC were calculated as
(3)
(3)
In order to calculate annual growth over multiple (5) years, the following formula’s used. The annual rate of change for each class of LULC is calculated by using the formula proposed by Puyravaud (Citation2003)
(4)
(4)
Where r is the change for each class per year, A2 and A1 are the class areas at the end and the beginning, respectively, for the period being evaluated, and t is the number of years that span that period.
2.2.4. Derivation of topographic attributes
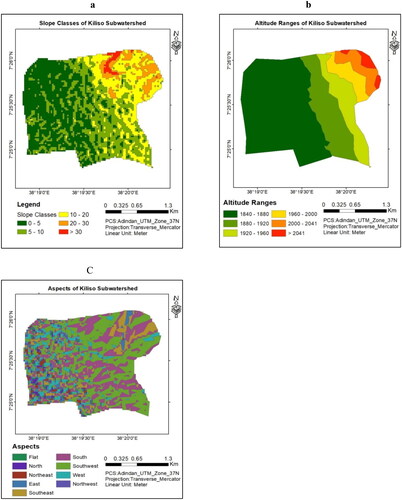
SRTM DEM was used to derive topographic variables such as aspect, slope and elevation. The ArcGIS software was used to derive and categorize pixel values based on the respective aspect, slope and altitude classes. Aspect is one of the topographic attributes classified as Flat areas (-1), North (337.5–22.50), Northeast (22.5–67.50), East (67.5–112.50), Southeast (112.5–157.50), South (157.5–202.50), Southwest (202.5–247.50), West (247.5–292.50), and Northwest (292.5–337.50). The slope was also classified into five different degree classes (Wondie et al. Citation2012). shows the slope classes namely gentle slopes (0–5%), moderate slopes (6–10%), steep slopes (11–20%), very steep slopes (21–30%), and extremely steep slopes (31–43.5%).The elevation data was reclassified into six equal interval classes. Namely the classes ranges are 1840 − 1880, 1880 − 1920, 1920 – 1960, 1960 – 2000, and 2000 – 2041 meters (). To determine the regeneration rate of the last 5 years of LULC in the area, the variables aspect, slope, and altitude were intersected with LULC data from 2017 and 2021. This value was used for further data extraction and calculating the annual change/regeneration rate.
Figure 3. The LULC and change maps of Kiliso sub-watershed.
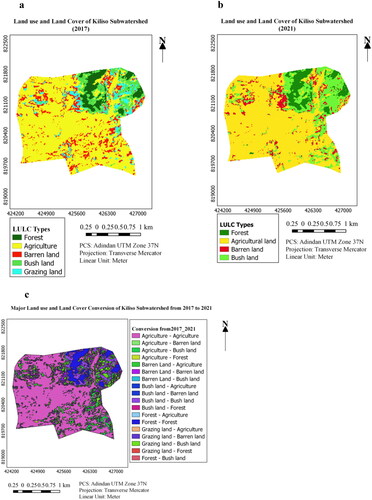
Figure 4. The slope, altitude, and, aspect maps of Kiliso sub-watershed.
3. Results and discussion
The result part deals with the two different time series data classification of the Sentinel-2 images. The year 2017 and 2021 Land use/cover of the area were analyzed and discussed in the following manner.
3.1. The land use and land cover of 2017 and 2021
The 2017 land use and land cover map was prepared from the Sentinel-2 images of January 19, 2017 (). The classification was verified with an accuracy of 85%. As it was shown in , agricultural land is the dominant land use class in the study periods. Its total area share in 2017 and 2021 was 359.44 (66%) and 354.72 (65%) hectares, respectively. In 2017, barren land was the second-largest dominant land cover. It covers 64.66 (12%) of the total area. The bush and grazing land covers had 45.35 (8.31%) and 40.55 (7.43%) respective hectares of area coverage. At year 2021, there are four land use and land cover classes were identified from the image classification (). The classification has verified with an accuracy of 87%. Bush land is the second-largest cover type in the study area. It covers 109.43 hectares of the total study area. Barren land and forest areas cover 40.8 and 40 hectares, respectively.
Table 1. Observed land use land cover types.
Table 2. Land use and land cover of 2017 and 2021.
3.2. Land use and land cover change analysis
In , it was found that agricultural land has decreased by 0.26 ha, while bushland increased at an annual rate of 19.26 ha. Forest land cover was the second most abundant type of land cover in the study area. It increased by 2.87 hectares. The grazing land was completely replaced by bush and forest land cover. The total area of barren land was also reduced by 8.79 hectares. The regeneration of forests and bushlands came at the expense of agricultural and grazing land.
Table 3. The LULC change of period 2017–2021.
According to , in the last five years, the area has exhibited positive and negative change. Significant area changes in hectares were observed in the land use and land cover of bushland and grazing land. The bush land had increased by 64.08 (141.3%) hectares at the end of the comparison year. In contrast to this, the grazing land completely lost its former area cover. The categories of barren and grazing land exhibited a substantially decreased area. The agricultural land decreased by 4.72 ha at the end of the reference year, which was recorded as the minimum change in the study period. On the contrary, the forest category increased by 5.3 (15.2%) hectares.
From the change matrix in , a significant amount of agricultural land was converted to bushland. The area under agricultural land has decreased due to the prohibition of agricultural practice in some steep areas. The second highest conversion observed was from barren land to agriculture. The conversion was observed in the central parts of the study sub-watershed. The grazing land of the reference year was converted to bushland and barren land with an area of 32.60 and 7.02 hectares, respectively. This was observed in the transition area near the top of the mountain.
Table 4. The LULC change-transition matrix of period 2017–2021.
Table 5. The land use/land cover along a slope.
3.3. The classification of major topographic variables with land use/land cover
3.3.1. The land use/land covers along a slope
This was to compare the land cover with the respective slope classes. In the 0–5 slope range in terms of percent rise, the larger amount (168 ha) of land was under agricultural practices (). The second largest observed land type was barren land. It covers an area of 25.8 hectares. Typically, agriculture was observed in the slope range of 0–20 percent rise. Agriculture’s total land area decreased after this point. The same is true about barren land. The majority of the barren land area represents the area under degradation. Bushland was observed in the slope range of 10–20, which accounts for 3.56 hectares of total land cover in the area. The amount of bushland coverage decreased beyond the specified slope percent raise. The forest cover was very high in the slope percent rise range of 10–20, following the slope percent rise of 20–30. This covers 45 and 29% of the total area, respectively.
The forest cover in the slope classes of 10–20 percent was relatively larger (15.63 ha) than the other covers. As the percent rise increased beyond 20, the amount of forest cover decreased with the increased slope value. It had the lowest record in the slope classes of 0–5%. While an agriculture was highly practiced in the slope class of 0–5%. In the same way, the amount of barren land also decreased with the increased slope. In agreement with this study, Habte et al. (Citation2021) reported that the decrease of agricultural land with increasing slop is due to a loss of productivity in the sloppy area. In the slope range of 10–20%, the dominant land cover was bushland. This covers 47 hectares of the area. The bushland was increased by slope rise in percentages of 0-5, 5-10, and 10-20, resulting in 14.47, 25.25, and 47.25 hectares, respectively.
3.3.2. The land use and land covers along with altitude
In the elevation range of 1840–1880 m, barren land (255.8 ha) was the dominant land class. The second dominant land class was agricultural land. The forest cover had the fewest records in this range. The cover of the forest was very high, at an altitude of 1880 to 1920 m. As observed from , the cover of the forest decreased below 1960 m. At an altitude of 1880 m, the dominant land use was agriculture. In 2017 and 2021, it covered 62.66 and 58.8 hectares, respectively. The second-largest cover in this range was bushland. Agriculture is the dominant practice in the elevation range of 1920–1960 m. Forest and bushland were the second and third dominant land cover types at 2017 and 2021, respectively. The least amount of land cover that prevails in this range is barren land. In the altitude range of 1960–2000 m, the bushland covers the largest (9.18 ha) portion relative to others. Following that, agriculture has the second-largest area coverage. In this range, the barren land had the least amount of coverage. In an altitudinal range of 2000–2041 m, bushlands are the dominant land cover, which covers 8.47 ha. The coverage was observed at and near the top of the mountain. Agricultural land in this range was found to be the second-largest land cover. Above 2041 m, all land cover was drastically reduced.
Table 6. The land use/land cover along with altitude.
Table 7. The land use/land cover along aspect.
Table 8. LULC change along the slope from the year 2017 - 2021.
Table 9. The annual change rate of LULC along with altitude from the year 2017 – 2021.
In Similar studies by Malaperdas and Panagiotidi (Citation2018) identified that the radiation of solar intensity increases 5–15% for every 1000 m increase in altitude. Therefore, the increased temperature resulted in limited species regeneration and restoration.
3.3.3. The land use/land covers along aspect
In two independent years of LULC, the agricultural and grazing lands are dominant land use classes in aspects of southwest and west. In a similar study by Ghosh et. al (Citation1996) the agricultural land expansion was found to be maximum in aspect West and Southeast. According to , it was found in incremental order in aspects of north, northeast, east, southeast, south, southwest, and west. In northwest and north aspects, it was decreased successively. In 2017, the cover of forest land was observed in aspects of southwest, west, and northwest. A total of 31.79 ha of forest land 21.49 ha (67%) were located in the western aspect alone. Consistent with this study, Birhane et al. (Citation2018) also identified that forest is the dominant type of land cover in the west aspect. The same was true about forests in the year 2021 LULC. A large amount of barren land was found in aspects of southwest and western parts of the study area. The barren land was insignificant in aspects of flat, north, northeast, and east. The cover of the bushland was found to be in increasing order of south, southwest, and west aspects. It was also very low in aspects of flat, north, northeast, and east. In general, the total area of the study sub-watershed was 447 ha (87%) of land found in aspects of south, southwest, west, and northwest.
3.4. Land rehabilitation along the topographic variabilities
3.4.1. Land rehabilitation rate along the slope
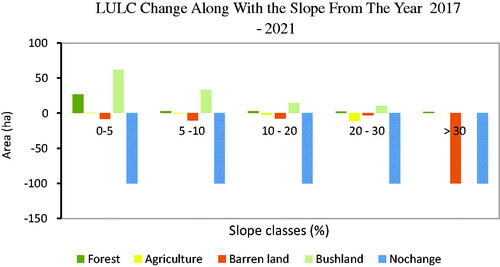
The slope classes have various effects on the rate of rehabilitation of degraded land (). Slope classes ranging from 0 to 30% were identified as very appropriate for bushland and forest restoration. Bushland was highly regenerated in slope classes of 0 – 5%, 5 – 10%, 10 – 20%, and 20 – 30%, with areas of 61.61, 32.96, 14.79, and 10.07 hectares, respectively. In the slope classes of greater than 30% the bushland regeneration rate is less likely influenced (). This holds true, when the area was previously covered by various types of bushlands and forests. A significant amount of rehabilitation rate record of forest cover has been observed in slope classes ranging from 0 – 5%, this is due to its low vulnerability to erosion. However, the influence of slope on the rehabilitation rate of forests is insignificant in slope classes greater than 5%. Agricultural activity was likewise scaled back from the slope class of 0 to 20%. This was due to the steep sub-watershed’s region and bushland to be off to agriculture due to rehabilitation effort. In the studied area, plantation practice has been quite successful for the past five years. As a result, as the slope increased by a unit increment, the area of bare ground reduced substantially.
Figure 5. LULC change along with the slope from the year of 2017–2021.
3.4.2. Land rehabilitation rate along the altitude
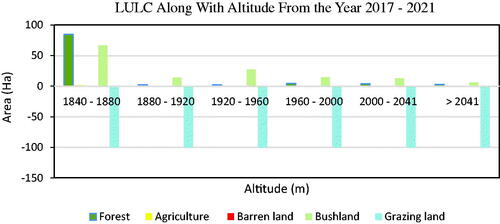
The rate of land use and land cover rehabilitation was significantly impacted by an altitude variation (). The influence of altitude on the rehabilitation rate of bush was found to be less in the range of 1840–2041 m. It was linearly decreased from an altitude of 1840–2041 m. Whereas, the maximum rehabilitation rate of forest land was observed at an altitude of 1840 to 1880 m. The rehabilitation rate of bush has been less influenced in the altitude ranges from 1840 − 1880 m. As a result, the bushland rehabilitation rate was observed to be significant at an altitude of 1840 − 1880 m (). However, beyond the specified altitudinal range (1840–1880 m), the status of influence on the rehabilitation rate of bushland fluctuated. The effect of altitude on agricultural land expansion was explained by increase and decrease rates of change. The largest increment rate of agricultural land was observed at an altitude of 1880 m. Beyond 1880 m elevation, the agricultural land change rate has an up-and down record. It was found to be decreased beyond of the mentioned altitude. The influence of altitude on the rehabilitation rate of barren and agricultural lands was observed in all altitudes with varying amounts. Grazing land was completely replaced with other land use land cover types.
Figure 6. LULC change along with the altitude from the year 2017–2021.
3.4.3. Land rehabilitation rate along the aspect
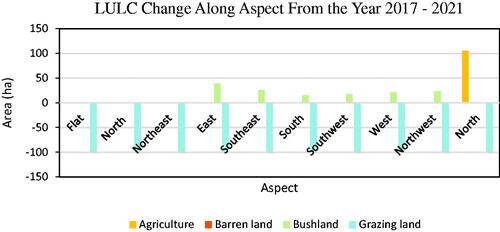
The rehabilitation rate of forest cover was increased in aspects of south and southwest facing direction. According to , the west and northwest aspects had less impact on the recovery rate, with hectares of 1.65 and 1, respectively. As a result, a lower incremental rate was observed in these areas. The remaining factors, which were flat, north, northeast, east, and southeast, had little effect on the rate of rehabilitation. Consequently, there was no evidence of change in the amount of forest cover. The northward direction had a significant impact on agricultural land increment (106 ha). However, no change was detected in the aspects southwest and west. The flat, north, northeast, east, southeast, and northwest aspects changed the least. The barren land was discovered to have a decreased change trend in every aspect (). Barren and bushland were widely spread in the east. The bushland changed significantly in the southeast, northwest, west, southwest, and south in hectares of 25.25, 23.52, 20.87, 17.41, and 15.5 respectively. The only land-use class in the area that had been completely altered was grazing land.
Figure 7. LULC change along with the aspect from the year 2017–2021
3.4.4. Potential topographic variability site to rehabilitate
The ideal location for area closure or rehabilitation is shown in as being suitable. The forest was extensively recovered at an elevation of 1841–1880 m, a South-facing aspect, and a slope class of 0–5%. The bushland was also shown a significant regeneration in altitude of 1841 − 1880 m, aspect of East, and slope class of 0–5%. The second potential location had a slope class of 5 to 10%, an aspect of Southeast, and an altitude range of 1920 to 1960 m. The following topographic variabilities were found to be the second set of possible locations for higher rehabilitation rates. The second-largest record was detected in 1920–1960 m, aspect of Southeast, and slope class of 5–10%. The following suitability rank was determined by taking into account past five years restoration and regeneration rate of forest and bushland in various topographies.
Table 10. The annual change rate of LULC along the aspect from the year 2017 - 2021.
Table 11. The suitability rank to area enclosure.
3.5. Discussion
Farmers and pastoralism in the Kiliso sub-watershed have faced difficulties as a result of land degradation. The majority of the local farmers and pastoral communities in the area rely on natural resources for a living. As a result of increased human pressure on the sub-watershed natural resources over the last few decades, the area has been designated for conservation. Since 2017, the area has been designed to protect the sub-watershed from human and livestock intervention. This is because food supply disruptions will become more frequent and food insecurity will increase if land degradation is not immediately reversed in favor of restoration practices (Welsh Citation2022). The year was chosen due to the severity of the impact of land degradation on the local community. Deforestation, overgrazing, shifting cultivation, and flooding were all prevalent in the study area at the time.
In 2017, five types of land use and land cover were identified. After five years of protection, the land use and land cover of the study area were reduced to four in 2021. For the past two decades, the bottom parts of Kiliso Mountain have been open for intensive grazing and shifting cultivation. After five years of banning open grazing in the area, shrubs and bushes began to rehabilitate. Agricultural land was discovered to have decreased during the study period. This is due to a ban on agricultural land expansion into forest and grazing land. According to a study conducted by Bufebo and Elias (Citation2021), the greatest expansion of agricultural land occurred at the expense of forest land. The clearance of forest for agricultural purpose, the increased population size and livestock in the area pressured nature more than ever. This had made the local farmers and livestock vulnerable to water and fodder scarcity, and decreased productivity of agricultural land.
In the time interval of closure, the study area revealed advanced restoration and regeneration, particularly in the cover of forest and bushland. The forest was increased from the year 2017 to 2021 by 6 hectares. This is due to different soil and water conservation practices, such as the plantation of grevillea robusta, the construction of soil bundles, and the regeneration of acacia. Lands that were under agriculture and barren lands in 2017 decreased substantially in 2021. The agricultural land previously incorporated in shifting cultivation was kept closed from any kind of practice. The barren land was reduced at the end of study year. This is due to the participation of the local community in plantation and soil bund construction.
The dynamics of land use and land cover in the last five years revealed that the majority (34.6 ha) of agricultural land was converted into bushland. At the lower bottom of the Kiliso Mountain, the barren land was converted into agricultural land. The conversion was observed in the western parts of the study area. This could be due to local farmers’ expansion into barren land. The conversion of grazing land to bushland occurred because local farmers and the semi-pastoral community were prohibited from open grazing. This enhanced the regeneration of bushes and shrubs in the area.
The agricultural land was primarily located on a slope rise of 0–20%. This could be attributed to its suitability for agricultural practice and productivity. According to Habte et al. (Citation2021), the decrease in agricultural land with increasing slope is due to a loss of productivity in the sloppy area. The agricultural practice decreased as the slope increased in percentage. Ayele et al. (Citation2022) found that agricultural land was mostly concentrated in lower-altitude regions. The proportion of agricultural land areas decreased as the slope degree increased. Similarly, as the slope increased, so did the amount of barren land. The greatest forest cover was observed in slope classes ranges of 10–20 and 20 - 30 percent.
Variation in slope classes influences the availability of soil moisture near to surface. According to Famiglietti et al. (Citation1998), Because of lower infiltration rates, rapid subsurface drainage, and higher surface runoff, steeper slopes are likely to be drier than flat areas. This has an impact on the diversity and the spatial distribution pattern of species across different slope classes. The greatest forest cover was observed in slope classes of 10–20% and 20–30%, with area covers of 45 and 29 hectares, respectively. However, it had a significant restoration in the 0 to 5 percentage rise slope areas. This is because conservation initiatives increased soil moisture, which encouraged the soil seed banks under the dispersed trees to flourish. More crucially, it cost deforested land to accomplish this (Gebrehiwot et al. Citation2022).
In slope rises ranging from 0% to 30%, the bushland was highly regenerated. This is due to the fact that the area used to be covered with bushland was previously under bushland cover. The region had recovered as a result of the restriction on open grazing, agricultural growth, and firewood collection. Furthermore, this increased moisture of the area may have accelerated its pace of regeneration. The prohibitions of livestock from grazing lands and increased plantation practice in the area were allowed the degraded land to restore and become a source of harvestable grass. Further, the local farmers have terraced the steep slope to reduce erosion.
In the years of the study period the agriculture, barren, and grazing lands were dominantly observed in an altitude range of 1840 to 1880 m. Whereas, the forest cover had a small area share than others. With an altitude range of 1880 to 1960 m, the forest had a dominant cover. And, it was highly restored in an altitude range of 1840 to 1880 m. This might be according to Gebremedihin et al. (Citation2018) in the lower altitude the cover of forest was declined due to different socioeconomic activities. For this reason, in the altitudinal range mentioned above, the cover was substantially regenerated. This implies that, the influence of altitude in the range from 1849 to 1880 m was significant. The areas below 2000 m were subjected to excessive transformation due to annual burning of scrubs and grasses by the locals (Wondie et al. Citation2012). The rehabilitation rate of bush has been less influenced in the altitude ranges from 1840–1880 m. According to the studies by Birhane et al. (Citation2018) found that bushland/shrub was found predominantly in the altitudinal range of 1574–1824 m and1824–2074m.
The variable altitude effect on forest cover rehabilitation rate was noticed above 1880 m altitude. As the altitude increased, the agricultural land decreased linearly. A similar study carried out by Birhanu et al. (Citation2019) revealed that agricultural areas decrease with increasing altitude. This is because an altitude range above the specified was dominantly covered by forest and bushland. The study made by Birhane et al. (Citation2018), also reported that the highest shrubland coverage was located at an elevation of 1824–2074 m. The grazing land was also concentrated at bottom parts of Kiliso Mountain at an altitude of 1840 m. The extended flattened land and open area in the study area was under grazing. The bushland was highly saturated in an altitude range of 1880 to 1920 m. In the rest of the altitudes, the bushland cover has been influenced to fluctuate. However, the bushland regeneration trend decreased linearly from 1840 to 2041 m altitude (Bhardwaj et al. Citation2021).
The topographic aspect significantly affects the vegetation restoration performance (Li et al. Citation2023). The northwestern and south aspect classes were distinguished by the highest rate of rehabilitation of all land use and land cover types during the study period. The forest was extremely rich in the south-facing aspects. In similar studies by Van de Water et al. (Citation2002) and Lu et al. (Citation2020), indicated that increase on south-facing slopes was greater than increase on north-facing slopes. This implies that the return of bushland along with the afforestation of Grevillea robusta species has increased the rate of forest rehabilitation. As a result, the aspects had a larger area share than the other aspects. The flat, north, northeast, and east aspects, on the other hand, had no record of forest cover restoration at all.
The majority of bushland restoration rate was seen in the east, southeast, and west. The regeneration of wilderness seedlings that were growing beneath mature trees helped to complete the restoration and positively influenced the rehabilitation rate. This shows that there is not enough grazing pressure to prevent regeneration. The moderate restoration rate record had identified in aspects such as south, southwest, and northwest. This was in an argument with the study of Birhane et al. (Citation2018).
The agricultural land in the north facing aspect has been extensively expanded and practiced. The increased availability of essential nutrients in the conserved area could explain the expansion. Furthermore, a significant increase in agricultural land was observed in the north aspect due to its suitability for agricultural practice with the highest content of Soil organic matter (Jendoubi et al. Citation2019; Tamene et al. Citation2020). As it also reported in Begum et al. (Citation2010) the north-facing sites are usually cool and moist and contain higher amounts of soil organic carbon, whereas south-facing slopes are usually hot and dry, with less vegetation, prone to erosion, and hence depleted in soil organic carbon. The grazing and barren lands were sharply decreased in every orientation of aspects. The grazing land has mostly been converted to bushland. Meanwhile, the barren land was largely reduced in flat aspect. In fact, the rehabilitation rate was reduced linearly across all aspects. This implies that when the area closure is implemented, the likelihood of it being replaced by another land use type is high.
Conclusion
The topographic influences on rehabilitating degraded land in Southern Ethiopia’s Kiliso sub-watershed had evaluated. Land use and land cover, and change data is the most useful source in natural resource management. Under the area of study, five different land uses, land covers were identified. The bushland increased significantly during the study period of 2017–021. While grazing land, barren land, and agricultural land were shown to show a decreasing trend. A large number of land use land cover types were discovered in the slope classes 0–5%, altitude 1840, and west aspect. The availability of LULC decreased as the slope and altitude increased. Each LULC was reduced above a 30% slope and an altitude of 2041. From the total land area of the study area, greater than 75% of LULC was observed in aspects of the southwest, west, and, northwest. In the years 2017–2021, forest and bushland were found to have a high annual change rate in slope classes of 0–5% and at an altitude of 1841–1880 m. This indicates that, the mentioned slope class is suitable for the recovery of forest, agriculture, and bushes. The ban of cattle from grazing and planting of exotic species in the area enhanced the recovery rate. Consequently, grazing and barren lands were reduced substantially in all aspects and slope classes. Agricultural land had a significant change rate in north aspect, and, an altitude of 1840 m. This implies that, the lower altitude and north facing aspect are relatively productive than others. Generally, forest land had shown significant recovery at an altitude of 1841–1880 m, aspect of south, and a slope class of 0–5%. Depending on the study findings, the potential suitable topographic variabilities were identified for the future effective restoration. Due to the fact that this study was limited to a small geographical area, a detailed study for a large geographical area with varying agro-ecology and topographic factors needs further investigation. As land degradation is a common challenge for subsistence farmers and pastoral communities in Ethiopia, this study plays a vital role for natural resource experts and policymakers in providing direction to identify the best topographic classes for area closure.
Additional information
Funding
References
- Abiy tsetargachew legesse 2008. Area closure as a strategy for land management: a case study at kelala dalacha enclosure in the central rift valley of Ethiopia Addis ababa university.
- Al-Fares W. 2013. Theoretical background and state of the Art. Historical land use/land cover classification using remote sensing. Springer Briefs in Geography. Heidelberg: Springer.
- Anderson JE, Williams J, Kriedemann PE, Austin MP, Farquhar GD. 1996. Correlations between carbon isotope discrimination and climate of native habitats for diverse eucalypt taxa growing in a common garden. Aust J Plant Physiol. 23:311–320.
- Andreas B, Hugh E, Catherine, B. 2012. Is Africa Losing Its Natural Vegetation? Monitoring Trajectories of Land Cover Change Using Landsat Imagery., In: Chandra G (ed.), Taylor and Francis Group, 369, 374.
- Ayele GT, Seka AM, Taddese H, Jemberrie MA, Ndehedehe CE, Demissie SS, Awange JL, Jeong J, Hamilton DP, Melesse AM. 2022. Relationship of attributes of soil and topography with land cover change in the rift valley basin of Ethiopia. Remote Sensing. 14(14):3257.
- Begum F, Bajracharya RM, Sharma S, Sitaula BK. 2010. Influence of slope aspect on soil physico-chemical and biological properties in the mid hills of central Nepal. Int J Sustain Dev World Ecol. 17(5):438–443.
- Bhardwaj DR, Tahiry H, Sharma P, Pala NA, Kumar D, Kumar A, Bharti B. 2021. Influence of aspect and elevational gradient on vegetation pattern, tree characteristics and ecosystem carbon density in northwestern Himalayas. Land. 10(11):1109.
- Birhane E, Teferi HH, Fenta AA, Gebremedhin MA. 2018. Land use land cover changes along topographic gradients in Hugumburda national forest priority area, northern Ethiopia. Remote Sens. Appl.: Soc. Environ. (13):61–68.
- Birhanu L, Hailu BT, Bekele T, Demissew S. 2019, November. Land use/land cover change along elevation and slope gradient in highlands of Ethiopia. J Remote Sens Appl So. Environ. 16:100260. https://doi.org/10.1016/j.rsase.2019.100260
- Bufebo B, Elias E. 2021. Land Use/Land Cover Change and Its Driving Forces in Shenkolla Watershed, South Central Ethiopia. The Scientific World J. 2021:13 pages, Article ID 9470918. https://doi.org/10.1155/2021/9470918
- Canty MJ. 2009. Image analysis, classification, and change detection in remote sensing. CRC Press is an imprint of the. Taylor & Francis Group London; New York.
- Congalton RG, Green K. 2009. Assessing the accuracy of remotely sensed data: principles and practices (2nd ed.). CRC Press.
- Congedo L. 2022. Semi-automatic classification plugin user manual.
- Dessalew S. 2022. Cause of land degradation and rehabilitation practices in case of amba sidist western Ethiopia. Am JChemPharm. 1(1):18–25.
- Famiglietti JS, Rudnicki JW, Rodell M. 1998. Variability insurface moisture content along a hillslope transect: rattlesnake Hill, Texas. J Hydrol. 210(1-4):259–281.
- FAO 2000. Global Forest Resources Assessment 2000 (FRA 2000), Food and Agriculture Organization of United Nations, Rome.
- Fichera CR, Modica G, Pollino M. 2012. Land cover classification and change-detection analysis using multi-temporal remote sensed imagery and landscape metrics. European J Remote Sensing. 45(1):1–18.
- Fick SE, Hijmans RJ. 2017. WorldClim 2: new 1km spatial resolution climate surfaces for global land areas. Int J Climatol. 37(12):4302–4315.
- Gebrehiwot G, Teka K, Welday Y. 2022. Can landscape restoration improve soil carbon stock? a study from Sero watershed, northern Ethiopia. J Glob Ecol Conserv. 39(4):e02274.
- Gebremedihin KM, Birhane E, Tadesse T, Gbrewahid H. 2018. Restoration of degraded drylands through exclosures enhancing woody species diversity and soil nutrients in the highlands of Tigray, Northern Ethiopia. Nat Cons Res. 3(1):1–20.
- Ghosh S, Sen KK, Rana U, Rao KS, Saxena KG. 1996. Application of GIS for land-use/land-cover change analysis in mountainous terrain. J Indian Soc Remote Sens. 24(3):193–202.
- Habte DG, Belliethathan S, Ayenew T. 2021. Evaluation of the status of land use/land cover change using remote sensing and GIS in Jewha watershed, northeastern Ethiopia. SN Appl Sci. 3(4):501.
- Hassen EE, Assen, M. 2018. Land use/cover dynamics and its drivers in Gelda catchment, Lake Tana watershed, Ethiopia. Environ Syst Res. 6, 4:1-13. https://doi.org/10.1186/s40068-017-0081-x
- James A, Ernest H, John R, Richard W. 1976. A Land Use and Land Cover Classification System for Use with Remote Sensor Data, United States Government Printing Office, Washington.
- Jendoubi D, Liniger H, Ifejika Speranza C. 2019. Impacts of land use and topography on soil organic carbon in a Mediterranean landscape (north-western Tunisia). J SOI. 5:239–251.
- Kelbore M. 2015. Harimaya University, Implementation of land rehabilitation practices on livelihood condition, 4/2/2015.
- Lemenih M. 2004. Eflects of landuse change on soil quality and native flora degradation and restoration in the highlands of Ethiopia. Implication for sustainable Land Management Swedish university of Agricultural science Uppsala, Sweden.
- Li Q, Li F, Guo J, Guo L, Wang S, Zhang Y, Li M, Zhang C. 2023. The synergistic effect of topographic factors and vegetation indices on the underground coal mine utilizing unmanned aerial vehicle remote sensing. IJERPH. 20(4):3759.
- Lu L, Yueqing X, An H, Chao L, Raymundo M-M, Ling H. 2020. Influences of Topographic Factors on Outcomes of Forest Programs and Policies in a Mountain Region of China. International Mountain Society. 40(1):48–60. https://doi.org/10.1659/MRD-JOURNAL-D-18-00050.1.
- Lü D, Lü Y, Gao G, Liu S, Wu B, Fu B. 2021. Existent nature reserves not optimal for waterservice provision and conservation on the Qinghai-Tibet plateau of China. Global Ecology and Conservation, 32, e01945. https://doi.org/10.1016/j.gecco.2021.e01945
- Lu D, Mausel P, Batistella M, Moran E. 2005. Land-cover binary change detection methods for use in the moist tropical region of the Amazon: a comparative study. Int J Remote Sens. 26(1):101–114.
- Lu L, Xu Y, Huang A, Liu C, Marcos-Martinez R, Huang L. 2020. Influences of topographic factors on outcomes of forest programs and policies in a mountain region of China. Int Mount Soc. 40:1. 10.2307/27002117.
- Maki Mateso JC, Bielders CL, Monsieurs E, Depicker A, Smets B, Tambala T, Bagalwa Mateso L, Dewitte O. 2023. Characteristics and causes of natural and human-induced landslides in a tropical mountainous region: the rift flank west of Lake Kivu (Democratic Republic of the Congo). Nat Hazards Earth Syst Sci. 23(2):643–666.
- Malaperdas G, Panagiotidi V. 2018. The aspects of Aspect: Understanding land exposure and its part in geographic information systems analysis. Energy Environ. 29(6):1022–1037. https://doi.org/10.1177/0958305X18766322
- Martínez S, Mollicone D. 2012. From land cover to land use: a methodology to assess land use from remote sensing data. Rem Sens. 4(4):1024–1045. 10.3390/rs4041024.
- Mölders N. 2012. Impact of land-cover and land-cover changes. In: Land-Use and Land-Cover Changes. Atmospheric and Oceanographic Sciences Library, vol. 44. Springer, Dordrecht. https://doi.org/10.1007/978-94-007-1527-1_3
- Mulualem T, Lemenih M, Negash M, Teketay D. 2014. Rehabilitation of degraded forest and woodland ecosystems in Ethiopia for sustenance of livelihoods and ecosystem services.
- Owojori A, Xie H. 2005. Landsat image-based LULC changes of San Antonio, Texas using advanced atmospheric correction and object-oriented image analysis approaches. Paper presented at the 5th international symposium on remote sensing of urban areas. Tempe, AZtfst
- Peng H, Jia Y, Zhan C, Xu W. 2020. Topographic controls on ecosystem evapotranspiration and net primary productivity under climate warming in the Taihang Mountains, China. J Hydrol. 581(581):124394.
- Puyravaud JP. 2003. Standardizing the calculation of the annual rate of deforestation. For Ecol Manag. 177(1-3):593–596.
- Rwanga S, Ndambuki J. 2017. Accuracy assessment of land use/land cover classification using remote sensing and GIS. IJG. 08(04):611–622.
- Tamene GM, Adiss HK, Alemu MY. 2020. Effect of slope aspect and land use types on selected soil physicochemical properties in north western Ethiopian highlands. Appl Environ Soil Sci. 2020:1–8.
- Tilahun A, Teferie B. 2015. Accuracy assessment of land use land cover classification using google earth. AJEP. 4(4):193–198.
- Tou JT, Gonzalez RC. 1974. Pattern recognition principles. Addison:Wesley Publishing Company (USA), p. 377.
- Van de Water PK, Leavitt S, Betancourt J. 2002. Leaf?13C variability with elevation, slope aspect, and precipitation in the southwest United States. JOecologia. (132):332–343.
- Vivekananda GN, Swathi R, Sujith AVLN. 2021. Multi-temporal image analysis for LULC classification and change detection. European J Remote Sens. 54(sup2):189–199. .
- Welsh T. 2022. Global food security threatened by land degradation, UN report finds. United Nation.
- Wondie M, Teketay D, Melesse AM, Schneider W. 2012. Relationship between topographic variables and land cover in the Simen mountains national park, a world heritage site in northern Ethiopia. Int J Remote Sens Appl. 2:36–43.