
 ?Mathematical formulae have been encoded as MathML and are displayed in this HTML version using MathJax in order to improve their display. Uncheck the box to turn MathJax off. This feature requires Javascript. Click on a formula to zoom.
Abstract
Over the past three decades, yellow poplar (Liriodendron tulipifera) has been widely employed in reforestation efforts across the country. This study delves into the potential influence of yellow poplar afforestation on the indigenous soil microbial demography within the original native stand. By scrutinizing microbial populations, a comprehensive understanding is sought. Utilizing pyrosequencing, a total of 92,300 sequencing reads were acquired from soil samples collected at seven distinct sites, each with two replicates. The comprehensive analysis unveiled the presence of 15 phyla, 158 families, 307 genera, and 439 distinct species. Notably, proteobacteria dominated at the phylum level, constituting 50% of the microbial presence, succeeded by acidobacteria (18%) and verrucomicrobia (10.7%). Remarkably, no significant disparities were observed in the microbial community composition across the yellow poplar, mixed, and pitch pine stands, spanning the phylum, family, and genus levels. Particularly noteworthy was the challenge of distinguishing between the microbial compositions of the mixed tree stand and the yellow poplar stand. Remarkably high-rank correlation coefficients underscored the striking similarity in microbe abundance between these two stands, indicating minimal variation in their microbial composition. The beta diversity index revealed parity between the microbial communities of the yellow poplar and mixed tree stands. However, a discernable contrast emerged in the soil microorganism composition of the pitch pine stand.
1. Introduction
Yellow poplar, a non-native species originating from the United States, has been extensively employed in reforestation projects since its introduction to Korea. It has exhibited superior growth and performance compared to indigenous and introduced timber species, such as Korean pine, larch, and oak trees (Im et al. Citation2022). Provisional productivity table formulated by the National Institute of Forest Science indicated that yellow poplar has the potential to yield up to 180 m3 per hectare by the age of 25, contingent upon specific site conditions. This success has replaced over 100,000 ha of previously established pine and oak stands with yellow poplar plantations (Son Citation2012). As reforestation efforts have expanded over time, concerns have arisen about the potential of this non-native species to undermine the biodiversity of indigenous ecosystems. While the USDA National Invasive Species Information Center excludes yellow poplar from its invasive species list in North America (https://www.invasivespeciesinfo.gov/species-profiles-list), the broader consequences of introducing these exotic trees remain uncertain. The introduction of exotic tree species into non-native environments may disrupt the existing soil microorganism communities. Reforestation processes typically entail the removal of existing tree stands through clear-cutting, the elimination of undergrowth, and the subsequent planting of seedlings. Research reveals that distinct microbial populations emerge in stands harboring different tree species (Habiyaremye et al. Citation2020). For instance, variations in litter and root exudates among tree species create diverse nutritional habitats for various microorganisms (Prescott and Grayston Citation2013). Considering this concern, the objective of this study is to investigate the impact of planting exotic tree species, such as yellow poplar (Liriodendron tulipifera), on soil microorganisms in Korean forest ecosystems. We hypothesize that the introduction of yellow poplar will lead to changes in the composition and abundance of soil microorganisms, particularly affecting key microbial taxa and their functional roles in nutrient cycling.
Moreover, clear-cutting significantly alters the forest soil environment by modifying light exposure and moisture levels. Studies by Cardenas et al. (Citation2015) indicate that soil microbe abundance in the organic matter and mineral soil layers decreased by 16% and 8% after logging. Clear-cutting leads to increased soil erosion, loss of organic matter, and disruption of soil structure, which can further impact soil microbial communities and nutrient cycling processes. Additionally, the introduction of exotic tree species into non-native environments may further exacerbate these effects. Combined with clear-cutting, this may result in prolonged disturbances to soil ecosystems, affecting microbial community composition and ecosystem functioning. Despite over six decades of reforestation using exotic tree species in Korea, comprehensive investigations into shifts within soil microbial communities remain lacking highlighting the need for further research to understand the long-term impacts of exotic tree planting and clear-cutting on soil environments.
Historically, investigating soil microbial communities posed challenges due to the limited cultivability of many microorganisms in laboratory artificial media. Nevertheless, the emergence of metagenomics techniques, as Daniel (Citation2005) exemplified, has gained popularity for its ability to explore both the taxonomic and functional aspects of microbial communities within diverse environments. This innovative approach involves directly cloning and sequencing the genetic material of soil microbes from their natural habitat. Metagenomics has evolved into a potent tool for scrutinizing the demographic patterns of soil microorganisms within forest ecosystems. In the context of this research, we undertook a meta-analysis to quantify the presence of soil microbes in yellow poplar stands and juxtaposed them with adjacent tree stands. Our primary aim was to unearth the impact of reforestation with exotic tree species on the forest microbiome, thereby identifying variations in microbiome composition between the exotic tree stands and their indigenous counterparts. By elucidating the potential impacts on soil microbial communities, the study aims to guide sustainable practices that balance reforestation goals with preserving native ecosystems and their invaluable microbial inhabitants.
2. Materials and methods
2.1. Experimental sites
Two yellow poplar stands were selected from each of the two regions (Chuncheon and Pocheon) with two replicates per stand, two mixed forests, and pine tree details of the stands are presented in .
Table 1. GPS Coordinates of the stands from which soil samples were taken.
Table 2. Summary of pyrosequencing of 16S rRNA sequence from soil samples of experimental stands.
In 1970, forest stands were established in Chuncheon, situated at coordinates 37.8746 N latitude and 127.8027E longitude, with an elevation of 367 m above sea level. Characterized by a slope of approximately 30%, the stands ensure effective drainage. The study encompassed two specific stands, denoted as LT1-1 and LT1-2. Additionally, adjacent yellow poplar stands, planted in 2002 and exhibiting diverse aspects, were represented by sample numbers LT2-1 and LT2-2. Two samples were procured from a nearby mixed stand to establish control parameters, identified as Mix1-1 and 1-2, comprising Pinus densiflora and Quercus variabilis.
Meanwhile, the Pocheon stands, initiated in 2002, were positioned at coordinates 37.9986 N latitude and 127.2625E longitude, with an elevation of 111 m above sea level. These stands featured a gradient of 25% and demonstrated proficient drainage. The investigation encompassed soil samples from plots exhibiting favorable growth (sample numbers LT3-1 and 3-2) and poor growth (sample numbers LT4-1 and 4-2). Control soil samples were derived from the adjacent mixed stand, labeled as Mix2-1 and 2-2, characterized by P. densiflora and Q. dentata.
An outgroup was included for comparative purposes, entailing soil samples from a 40-year-old pitch pine (Pinus rigida) stand in Hwaseong, designated as sample numbers PR1 and 2. Understory vegetation was minimal across all stands due to light limitations. Soil samples were meticulously collected from five distinct locations within each plot, retrieved from a depth of 5–10 cm subsequent to litter layer removal. After consolidation and careful blending, the samples were stored in an ice box containing dry ice during transportation. The collected samples underwent metagenome analysis and were subjected to assessment of organic matter, total nitrogen, phosphate, magnesium, potassium, calcium, and cation exchange capacity (CEC) content.
2.2. DNA extraction and sequencing
DNA was extracted via the DNeasy PowerSoil Kit (Qiagen, Hilden, Germany), adhering to the manufacturer’s guidelines. The quantification of extracted DNA was achieved utilizing Quant-IT PicoGreen (Invitrogen). Pyrosequencing libraries were crafted based on the Illumina 16S Metagenomic Pyrosequencing Library protocols, specifically amplifying the V3 and V4 regions per the methodology that Klindworth established (Klindworth et al. Citation2013). In the initial step, input genomic DNA (gDNA) underwent PCR amplification using universal primers and Herculase II fusion DNA polymerase. The first PCR cycle included an initial denaturation at 95 °C for 3 min, followed by 25 cycles comprising denaturation at 95 °C for 30 s, annealing at 55 °C for 30 s, extension at 72 °C for 30 s, and a final extension at 72 °C for 5 min. The universal primer pair employed for the first amplification encompassed the Illumina adaptor overhang sequences: V3-F:5′-TCG TCG GCA GCG TCA GAT GTG TAT AAG AGA CAGCCT ACG GGN GGC WGC AG-3′, and V4-R:5′-GTC TCG TGG GCT CGG AGA TGT GTA TAA GAG ACA GGA CTA CHV GGG TAT CTA ATC C-3′ (Fadeev et al. Citation2021).
Following the initial PCR, the first PCR product was subjected to purification employing AMPurebeads (Agencourt Bioscience, Beverly, MA). A subsequent amplification for final library construction was carried out on a 2 µL aliquot of the purified product, utilizing Nextera XT Indexed Primer. The cycle conditions for the second PCR mirrored those of the first, except for a reduced cycle count of 10. The resultant PCR product was further purified using AMPurebeads. The last purified product underwent quantification via qPCR and assessment through the Tapestation D1000 Screen Tape. Eventually, paired-end pyrosequencing (2300 bp) was executed using the MiSeqTM platform.
2.3. Metagenome analysis
Metagenome analysis used the DADA2 pipeline, which is efficient for microbial community analysis. DADA2 can accurately infer the sequence of a sample without organizing it into Operational Taxonomic Units (OTUs) and can resolve even very small differences of one nucleotide (Callahan et al. Citation2016). The Amplicon Sequence Variant (ASV) generation process involved the removal of chimeras from the amplified sequences and retaining sequences exceeding 400 base pairs. The sequences originating from the 16S rRNA pyrosequencing are concisely presented in . These selected sequences underwent scrutiny through BLAST analysis within the Bacteria 16S rRNA NCBI RefSeq database (2022-03-18) to identify sequences displaying over 97% identity. This BLAST-derived data were employed to construct an OTU table. While these OTUs were characterized by distinct IDs, an analysis at the species-level taxonomy amalgamated sequences with identical IDs into the same species designation.
2.4. Diversity analyses
Diversity assessment encompassed various aspects. Species richness was quantified by enumerating the count of unique species present at each site. Species identification hinged on their sequence IDs, where OTUs sharing the same sequence ID were treated as identical species. The relative abundance of each species was computed by dividing the total count of individuals belonging to that species at a given site by the overall number of individuals at that site. Notably, the top 50 species showcasing the highest collective abundance across all sites were singled out. The analysis of diversity aimed to compute both alpha diversity (diversity within a specific group) and beta diversity (disparity between different groups) exhibited by the microbial communities. To gauge alpha diversity, metrics such as the Shannon–Wiener diversity index (H’) (Ortiz-Burgos Citation2016) the Simpson diversity index (D) (Simpson, Citation1949), and the evenness index (E) were employed.
The Shannon–Wiener index was calculated using the following equation:
(1)
(1)
where n1 is the total population of a particular species, and N is the total abundance of all species in the sample.
For evenness, Pielou’s evenness index was used (Pielou, Citation1966)
(2)
(2)
Here, H’ is the Shannon diversity index, and Hmax is the maximum possible value of H’.
Simpson’s index (D) was obtained by the following formula:
(3)
(3)
where n is the total population of a particular species, and N is the total abundance of all species in the sample.
Beta diversity uses the dissimilarity formula of Bray-Curtis (Hao et al. Citation2019).
(4)
(4)
Cij is the total number of less common species found at both sites, Si is the total number of species found at site I, and Sj is the total number of species found at site j.
To cluster the microorganisms, present in seven different stands, the Euclidean distance (D = (x2 + y2)1/2) was computed based on the frequency of the top 40 species within each stand. This Euclidean distance metric was then employed to generate a cluster map. A comprehensive outline of the calculation procedure for the Euclidean distance can be accessed at http://genomes.urv.cat/UPGMA/index.php?entrada=Example2 (Garcia-Vallvé et al. Citation1999)
3. Results and discussion
3.1. Soil chemical characteristics of the stands
The results of a comparative analysis of soil chemical properties among the sampling sites are shown in . LT stands exhibit varying phosphorus levels, with LT4-1 having the highest (22.72) and LT1-1 the lowest (6.05). PR stands generally have lower phosphorus levels compared to LT stands, with PR1 having a moderate concentration (6.18) and PR2 the lowest (3.76). LT stands, on average, have a higher organic matter content compared to mixed and PR stands. PR stands generally have lower pH values, with PR2 being the most acidic (4.0). PR stands generally have lower total nitrogen levels compared to LT stands.
Table 3. Soil chemical properties of the study areas.
3.2. Microbial diversity in the yellow poplar stands
Based on the amplification of the 16S rRNA gene sequence retrieved from the soil sample of the yellow poplar plantation, OTU IDs sharing the same sequence ID were consolidated into individual species. A comprehensive count revealed the presence of 439 distinct bacterial species within the study area, encompassing 308 genera, 168 families, 86 orders, and 15 phyla. Proteobacteria emerged as the predominant group among these diverse phyla, constituting approximately 50% of the overall bacterial population ().
Figure 1. Relative abundance of dominant phyla of bacteria in the subsoil of yellow poplar stands (LT1, 2, 3, and 4), their neighboring mixed tree stands (M1 and 2), and pitch pine stands (PR).
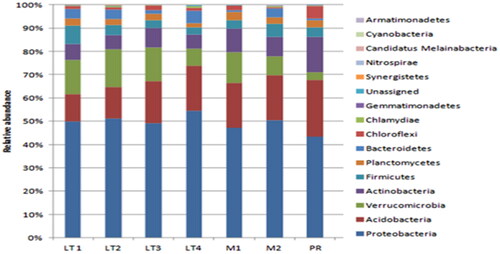
Additionally, other prominent phyla included Acidobacteria, Verrucomicrobia, Actinobacteria, Firmicutes, Planctomycetes, and Bacteroidetes. While the stands varied in terms of their classification into three different types, the microbial composition exhibited limited disparity at the phylum level.
At the family level, a total of 158 distinct bacterial families were identified. Among these, the most prevalent family was Hyphomicrobiaceae, accounting for 11,247. Bradyrhizobiaceae ranked as the second most abundant family, with 11,234, while Chthoniobacteraceae was the third most prevalent family, with 6,603. Bryobacteraceae emerged as the fourth most abundant family, comprising 2,933. Notably, no statistically significant difference was observed between the soil composition of yellow poplar and mixed tree stands. However, the relative frequency of Chthoniobacteraceae was found to be 0.5% within the pitch pine stands.
Moreover, the abundance of Bryobacteraceae and Thermomonosporaceae exhibited considerably lower occurrences in the pitch pine stands. These findings collectively suggest that the introduction of the exotic species, yellow poplar, does not exert a substantial impact on the forest soil dynamics in Korea. Nonetheless, a slight differentiation was noted in the pitch pine stand compared to the other two study areas, which is likely attributed to the distinct tree composition prevailing in this particular region.
A comprehensive spectrum of 307 soil microorganism genera was discerned at the genus taxonomic level. Notably, Rhodoplanes emerged as the most prolific genus, observed a staggering 9,900 times, closely followed by Afipia at 9,258, Chthoniobacter at 6,603, Acidobacterium at 4,209, Paludibaculum at 2,898, and Occallatibacter at 2,702. The proportional representation of these genera exhibited discernable variability among the distinct stands. While the pitch pine stands displayed a distinct compositional distribution in contrast to the other stands, the discernment between the yellow poplar stands and mixed tree stands was less pronounced.
Furthermore, the species-level analysis unveiled the presence of 439 distinct species of soil microorganisms across the seven stands (). Seven species exhibited remarkable predominance, appearing in all 14 plots except 2. These seven species collectively accounted for 37,322 out of the total 92,494 soil microorganisms, constituting a substantial 40.3% of the overall abundance. Predominantly, Rhodoplanes elegans, a constituent of the Hyphomicrobiaceae family, emerged as the most abundant species, contributing to 10.6% of the aggregate population of 92,494 microorganisms identified in yellow poplar stand samples. Following suit, Afipia broomeae, a proteobacteria member, was the second most prolific species, with an occurrence count 9,258, equivalent to 10.0% of the total abundance. Finally, Chthoniobacter flavus Ellin429 secured the third spot, recorded at 6,603.
Table 4. Frequency of occurrence of the top 40 species of microbes in the stands of different tree species.
A total of 65 soil microorganism species were found to be shared across the three distinct tree-type stands (). Further analysis revealed that 100 bacterial species exhibited commonality between yellow poplar and pitch pine stands, 152 between yellow poplar and Mongolian oak stands, and 99 between Mongolian oak and pitch pine stands. This distribution is visually depicted in , which elucidates the prevalence of these shared species. The Index of Union value, indicative of community overlap, was most pronounced between yellow poplar and mixed tree stands. This underscores the heightened similarity in soil microbial compositions between these two categories, transcending the resemblance observed between the soil microbial communities of yellow poplar and pitch pine stands, as well as mixed tree and pitch pine stands. Evidently, the microbial profiles of the hardwood stand, particularly yellow poplar and mixed tree stands, exhibit a more prominent affinity, elucidating an intriguing pattern of microbial community convergence.
Figure 2. Venn diagram showing shared and non-shared bacterial species among the three tree-type stands. Numbers inside circles indicate the number of unique species in one of the subsets based on absence/presence data (top: pitch pine stand, left: yellow poplar stand, right: mixed tree stand).
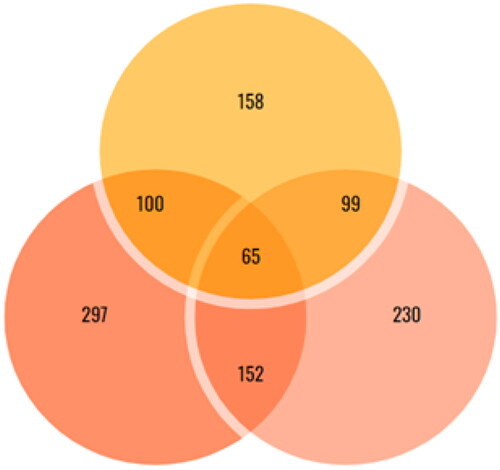
Table 5. Spearman rank correlation coefficients among the microbes of different tree-type stands.
We compared the log values of the top 10 most representative soil bacteria at the phylum and species levels among the soil bacteria of the seven stands ().
Figure 3. Distribution patterns of the top 10 represented microbial phylum (1) and species (2) in the soils of different stands. The scale is the log(abundance) of each species.
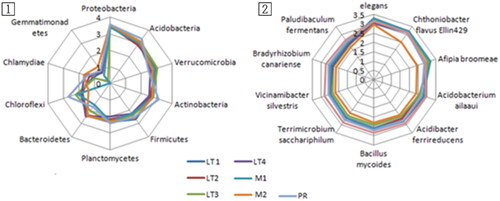
Consistently, all soil microorganisms displayed a uniform pattern at the phylum level, with the exception of a minor presence of Chlamydiae within the mixed tree stands. This prevailing trend was further accentuated when examining the species level, as depicted in (2). This observation strongly implies the absence of noteworthy disparities in the soil microorganism composition between the introduced yellow poplar stands and the mixed tree stands.
It has been reported that proteobacteria and Bacteroidetes preferentially use more carbon materials (Uroz et al. Citation2013). Actinobacter, Proteobacter, Bacteroidota, and Patescibacteria were found in the soil of lodgepole pine forest after wildfires in the United States (Nelson et al. Citation2022). In China, Acidobacteria, Actinobacteria, and Proteobacteria were dominant in both evergreen broad-leaved forests and coniferous forests (Zeng et al. Citation2022). Stand type significantly affected the structure of soil bacterial populations at the phylum level, with specific phyla being dominant in certain forest types (Truu et al. Citation2020). Oak forests in temperate regions were reported to have acidobacteria as a dominant phylum, with actinobacteria, proteobacteria, and bacteroidetes accounting for the rest (Purahong et al. Citation2014). In Korean forests, while these bacteria are observed, the proportion of proteobacteria is exceptionally high (Lim et al. Citation2005).
3.3. Alpha diversity
The diversity indices for soil microorganisms within each stand were calculated based on the number of species derived from the 16S rRNA sequences ().
Table 6. Diversity indices of soil microbes associated with yellow poplar, oak, or pitch pine were calculated based on 16S rRNA sequences.
The assessment of species richness through the Chao1 estimator, which factors in singleton sequences (Chao and Chiu Citation2016) indicated a modest value due to the relatively low prevalence of singletons in our dataset. Singleton sequences are often discarded during sequence data processing, as they are frequently deemed to be errors rather than genuine species entities (Schloss and Handelsman Citation2005). Consequently, species richness was quantified in this study by tallying microbial species based on their unique sequence IDs, as opposed to OTU IDs. While OTU IDs gauge sequence similarity, sequence IDs provide distinct identifiers for each sequence.
Regarding species abundance, no statistically significant differences were evident between the yellow poplar and mixed tree stands. However, a notable significance level of p < 0.1 emerged when comparing the yellow poplar stands with the pitch pine stands. Notably, no significance was observed between the mixed tree stands and the pitch pine stands.
Applying the Shannon diversity index, a metric encompassing species count and distribution evenness, revealed an average index value of 1.91 in this study—a value typically considered modest within the range of 1.5–3.5. This relatively lower Shannon diversity index is attributed to the situation where numerous species exist but are unevenly distributed. This implies that only a limited number of species exhibit high abundance, while the majority of species remain rare. For instance, the cumulative contribution of the top 10 species exceeds 50% of the approximately 100 species per stand. Greater diversity arises from a combination of elevated species richness and a harmoniously distributed population among these species.
In this investigation, the diversity of soil microorganisms exhibited no substantial disparity between the yellow poplar stands and the mixed tree stands. Nevertheless, a modest yet noteworthy distinction emerged between the yellow poplar stands and the pitch pine stands, particularly in terms of abundance and Simpson indices ().
Table 7. Statistical difference of four alpha diversity indices between yellow poplar, mixed tree, and pitch pine stands.
The Simpson diversity index, serving as an indicator of alpha diversity, takes into account the relative abundance of species. A higher Simpson diversity index value signifies greater diversity. Notably, the soil microorganisms within the pitch pine stands exhibited the lowest Simpson diversity index value, implying a reduced diversity of soil microorganisms compared to the other two tree stands.
3.4. Beta diversity of soil microorganisms between stands
The Bray–Curtis dissimilarity indices, a measure of microbial community divergence, have been summarized in .
Table 8. Bray–Curtis dissimilarity indices of the microbes among different stand types.
The yellow poplar stands in Chuncheon and Pocheon exhibited a remarkable similarity, characterized by an index of 0.046. In contrast, the comparison between the yellow poplar and mixed tree stands revealed greater dissimilarity, with indices of 0.1053 and 0.063, respectively. Notably, the disparity between the yellow poplar and pitch pine stands (PR) was more than twofold. Moreover, a notable contrast was observed in the microbial composition between the mixed tree and pitch pine stands. These findings underscore the potential influence of tree species on soil bacterial composition.
Given that yellow poplar and mixed tree stands encompass either fully or partially deciduous broad-leaved trees, their impact on microorganisms differs slightly from that of pine. This variance may be attributed to the distinct leaf litter produced by these trees. Additionally, the results indicate that the introduction of the yellow poplar species has yielded minimal impact on the microbial composition within the soil, even following the duration of 20–50 years.
3.5. Cluster analysis
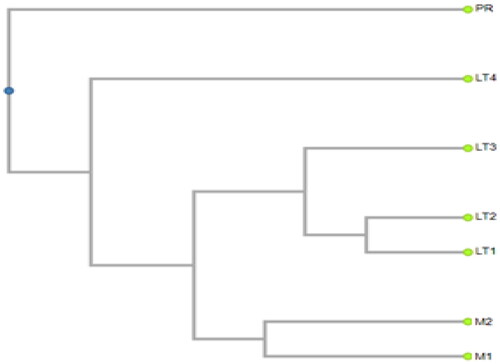
A cluster analysis of the leading 40 microorganisms across the seven stands reveals a distinct separation of LT4 from the other stands (). This distinction arises due to the notably low Simpson diversity index of microorganisms in LT4, second only to the pitch pine stand. Furthermore, among the top 40 species, 10 were conspicuously absent from the LT4 soil. The microbial patterns within the LT4 soil also markedly differ from those observed in the pitch pine stands. Conversely, the soil microbial compositions within the mixed tree stand and yellow poplar stands did not display significant dissimilarity.
Figure 4. The hierarchical cluster of soil microorganisms in each stand is based on the frequencies of the top 40 species in seven stands.
4. Conclusions
We conducted an investigation into the microbial population dynamics within yellow poplar (L. tulipifera) stands to ascertain whether the introduction of this exotic species had instigated alterations in soil microbe composition. A comprehensive analysis, involving 92,300 sequencing reads, facilitated a thorough comparison of microorganisms between yellow poplar stands and their neighboring counterparts.
The findings revealed a lack of substantial disparity in the microbial community constitution across the phylum, family, and genus levels among yellow poplar stands, mixed tree stands, and pitch pine stands. This suggests a fundamental similarity in soil microorganisms among these diverse stand types. Furthermore, a robust rank correlation observed between microbial abundance in yellow poplar and mixed tree stands underscores the minimal divergence in microbial makeup between these two stand categories. This observation further substantiates the notion that the introduction of yellow poplar has not induced significant alterations in soil microorganism composition.
Author contributions
Conceptualization, investigation, resources, K.J., I.H.L., and C.O.; project administration, C.O.; supervision, I.H.L. and C.O.; methodology, funding acquisition, K.J. and C.O.; software, validation, formal analysis, data curation, writing—original draft preparation, K.J.; visualization, K.J. and S.B.; writing—review and editing, I.H.L., C.O., S.B., G.H., and E.J.C. All authors have read and agreed to the published version of the article.
Disclaimer/publisher’s note
The statements, opinions, and data contained in all publications are solely those of the individual author(s) and contributor(s) and not of MDPI and/or the editor(s). MDPI and/or the editor(s) disclaim responsibility for any injury to people or property resulting from any ideas, methods, instructions, or products referred to in the content.
Acknowledgments
We thank E.W. Noh and Y.B. Koo for their critical review of the manuscript.
Disclosure statement
No potential conflict of interest was reported by the author(s).
Data availability statement
The data are available on request from the corresponding author.
Additional information
Funding
References
- Callahan BJ, McMurdie PJ, Rosen MJ, Han AW, Johnson AJA, Holmes SP. 2016. DADA2: high-resolution sample inference from Illumina amplicon data. Nat Methods. 13(7):581–583. doi: 10.1038/nmeth.3869.
- Cardenas E, Kranabetter JM, Hope G, Maas KR, Hallam S, Mohn WW. 2015. Forest harvesting reduces the soil metagenomic potential for biomass decomposition. ISME J. 9(11):2465–2476. doi: 10.1038/ismej.2015.57.
- Chao A, Chiu C-H. 2016. Species richness: estimation and comparison. In: Wiley StatsRef: statistics reference online. p. 1–26.
- Daniel R. 2005. The metagenomics of soil. Nat Rev: Microbiol. 3:470–478.
- Fadeev E, Cardozo-Mino MG, Rapp JZ, Bienhold C, Salter I, Salman-Carvalho V, Molari M, Tegetmeyer HE, Buttigieg PL, Boetius A. 2021. Comparison of Two 16S rRNA Primers (V3–V4 and V4–V5) for Studies of Arctic Microbial Communities. Fornt Microbiol. 12. doi: 10.3389/fmicb.2021.637526
- Garcia-Vallvé S, Palau J, Romeu A. 1999. Horizontal gene transfer in glycosyl hydrolases inferred from codon usage in Escherichia coli and Bacillus subtilis. Mol Biol Evol. 16(9):1125–1134. doi: 10.1093/oxfordjournals.molbev.a026203.
- Habiyaremye JDD, Goldmann K, Reitz T, Herrmann S, Buscot F. 2020. Tree root zone microbiome: exploring the magnitude of environmental conditions and host tree impact. Front Microbiol. 11:749. doi: 10.3389/fmicb.2020.00749.
- Hao M, Corral-Rivas JJ, González-Elizondo MS, Ganeshaiah KN, Nava-Miranda MG, Zhang C, Zhao X, von Gadow K. 2019. Assessing biological dissimilarities between five forest communities. For Ecosyst. 6(1):30. doi: 10.1186/s40663-019-0188-9.
- Im HM, Lee IH, Oh C. Kim IS. 2022. The introduction test of yellow poplar. Korea: National Institute of Forest Science.
- Klindworth A, Pruesse E, Schweer T, Peplies J, Quast C, Horn M, Glöckner FO. 2013. Evaluation of general 16S ribosomal RNA gene PCR primers for classical and next-generation sequencing-based diversity studies. Nucleic Acids Res. 41(1):e1–e1. doi: 10.1093/nar/gks808.
- Lim HK, Chung EJ, Kim J-C, Choi GJ, Jang KS, Chung YR, Cho KY, Lee S-W. 2005. Characterization of a forest soil metagenome clone that confers indirubin and indigo production on Escherichia coli. Appl Environ Microbiol. 71(12):7768–7777. doi: 10.1128/AEM.71.12.7768-7777.2005.
- Nelson AR, Narrowe AB, Rhoades CC, Fegel TS, Daly RA, Roth HK, Chu RK, Amundson KK, Young RB, Steindorff AS, et al. 2022. Wildfire-dependent changes in soil microbiome diversity and function. Nat Microbiol. 7(9):1419–1430. doi: 10.1038/s41564-022-01203-y.
- Ortiz-Burgos S. 2016. Shannon-Weaver diversity index. In: Kennish MJ, editor. Encyclopedia of Estuaries. Encyclopedia of Earth Sciences Series. 572 p. Dordrecht, Netherlands: Springer. doi: 10.1007/978-94-017-8801-4_233.
- Pielou EC. 1966. The measurement of diversity in different types of biological collections. J Theor Biol. 13:131–144.
- Prescott CE, Grayston SJ. 2013. Tree species influence on microbial communities in litter and soil: current knowledge and research needs. For Ecol Manag. 309:19–27.
- Purahong W, Schloter M, Pecyna MJ, Kapturska D, Däumlich V, Mital S, Buscot F, Hofrichter M, Gutknecht JLM, Krüger D. 2014. Uncoupling of microbial community structure and function in decomposing litter across beech forest ecosystems in Central Europe. Sci Rep. 4(1):7014. doi: 10.1038/srep07014.
- Schloss PD, Handelsman J. 2005. Metagenomics for studying unculturable microorganisms: cutting the Gordian knot. Genome Biol. 6(8):229. doi: 10.1186/gb-2005-6-8-229.
- Simpson EH. 1949. Measurement of diversity. Nature. 163(4148):688–688. doi: 10.1038/163688a0.
- Son YM. 2012. Wood biomass and their harvest tables of some important timber species in Korea (in Korean). p. 261. ISBN 978-89-8176-875-1.
- Truu M, Nõlvak H, Ostonen I, Oopkaup K, Maddison M, Ligi T, Espenberg M, Uri V, Mander Ü, Truu J. 2020. Soil bacterial and archaeal communities and their potential to perform N-cycling processes in soils of boreal forests growing on well-drained peat. Front Microbiol. 11:591358. doi: 10.3389/fmicb.2020.591358.
- Uroz S, Ioannidis P, Lengelle J, Cébron A, Morin E, Buée M, Martin F. 2013. Functional assays and metagenomic analyses reveal differences between the microbial communities inhabiting the soil horizons of a Norway spruce plantation. PLoS One. 8(2):e55929. doi: 10.1371/journal.pone.0055929.
- Zeng Q, Lebreton A, Man X, Jia L, Wang G, Gong S, Buée M, Wu G, Dai Y, Yang Z, et al. 2022. Ecological drivers of the soil microbial diversity and composition in primary old-growth forest and secondary woodland in a subtropical evergreen broad-leaved forest biome in the Ailao mountains, China. Front Microbiol. 13:908257. doi: 10.3389/fmicb.2022.908257.