
Abstract
This paper examines the intergenerational mobility trajectory (class) effects on social connection and, through this, on subjective well-being in contemporary UK society. Drawing on data from the United Kingdom Household Longitudinal Study, we measured four types of formal and informal social network (civic engagement, neighbourhood cohesion, diversity and size of social networks) and used three indictors for well-being. We find that social network does play a significant role on well-being but the impact is much smaller than that of class. We also find that class is more closely related to the formal than the informal domains of social network. Demographic attributes show some influences but social network, employment, and prior levels of well-being in particular, have more salient effects on well-being. Over and above all this, class as an indicator of cumulative advantages and disadvantages has a persistent and systematic influence. Overall, the analysis shows that while enriching social connection would contribute to well-being, reducing class-based inequality is of greater importance.
Introduction
Like other developed societies, the UK has witnessed persistent or even growing socio-economic inequalities in the last few decades. Risks of employment insecurity have increased, income disparities have grown, and civic engagement and social cohesion have declined. Underlying these and other aspects of social change are class differences related not only to people’s current position in the labour market but also to the inequality in mobility chances. Class-based inequalities are fed into people’s perception of their quality of life. These developments have attracted the attention of academic, government and third-sector researchers alike. For instance, several initiatives have been launched in recent years by the central government departments in the UK to monitor public well-being, due to the recognition that the government has a responsibility not only to promote people’s material standards of living but also to enhance their subjective experience of well-being (Cameron, Citation2010; Cabinet Office, Citation2013; DCLG, Citation2012).
Much research has shown that people’s well-being is closely related to the socio-economic position they hold in society and to formal and informal networks they have in their social lives, but how these factors are related to one another, what relative importance they have for well-being and, more importantly, how they are related to the social reproduction processes has been under-researched. Social scientists have made numerous efforts in trying to understand how people’s subjective perceptions of life quality are shaped by personal and structural factors, but such efforts tend to focus on different facets, such as on life-course influences by psychologists, financial situations by economists, civic engagement by political scientists, and informal networks by sociologists, making it difficult for us to gain a clear view of the relative impacts of the different factors. This paper seeks to make a contribution to scholarship in this area from a sociological perspective by examining the impacts of intergenerational social mobility trajectory on formal and informal social networks and, through this, on well-being, namely, on respondents’ subjective evaluation of their quality of life. By treating social connection as a linkage between class and well-being, we aim to show the interrelations between these factors in a systematic way.
Social networks are the foundation stones of social capital, a view shared by the leading scholars in the field (Bourdieu, Citation1986; Coleman, Citation1988; Lin, Citation2001; Putnam, Citation2000; for a review of literature in this regard, see Li, Citation2015). Such networks are embedded in the width and depth of formal and informal social settings. In this paper, we use civic engagement, neighbourhood cohesion, network diversity and network size as indicators of social networks. Similarly, well-being can be viewed in a broad way, as people’s subjective evaluation of the overall state of their physical and mental health, happiness, and satisfaction with different aspects of life. Linking people’s socio-demographic circumstances to their social networks and, furthermore, to their subjective well-being (SWB), we wish to address the following questions: How important are different types of social connection to one’s perceived well-being? How are both social connection and well-being conditioned by people’s social positions as indicated in a cumulative form of advantages and disadvantages through their mobility trajectories? By examining the interrelationships between these factors in contemporary UK society, we hope to provide a more systematic analysis than hitherto available in existing literature.
This paper is structured as follows. In the next section, we give a brief review of theoretical accounts and research findings on social connection and well-being. After that, we introduce data and measurement, followed by presentation of findings. We conclude by discussing the wider implications of our findings.
Theoretical context
In the past few decades, social scientists have been increasingly concerned with quality of life. Underlying this concern is the belief that in spite of the advances in economic development and medical sciences which have raised the objective living standards in the developed countries and in many of the developing countries, the quality of life as we perceive it in our everyday life has not increased to a commensurate extent. Frequently, we feel the opposite. Our well-being may be undergoing a process of erosion stemming from increasing job competition, growing employment insecurity and economic inequality, and fragmenting social relations (Atkinson, Citation2015; Li, Savage, & Pickles, Citation2003; Putnam, Citation2000). In the following, we shall give a brief account of the debates by psychologists, economists, sociologists and political scientists on well-being.
To begin with, well-being studies cover many strands, variously called SWB, happiness, life satisfaction, mental health or quality of life. These respects are to a greater or lesser extent interrelated and social scientists tend to focus on one or another aspect as appropriate for their disciplinary interests. For instance, psychological and economic studies are mainly concerned with the stability or change in people’s mental health. Diener, Suh, Lucas, and Smith (Citation1999) reviewed nearly 300 studies in psychology in the previous 30 years and found that demographic attributes do not affect SWB to a notable extent but personality, disposition, goal-orientation, adaptation and coping strategies play an important part. External events, particularly those of a major significance, tend to have considerable impacts on people’s happiness. Yet, most people have the ability to adapt themselves to the new situation. Two main theories have been developed to account for this: the ‘dynamic equilibrium’ theory (Headey & Wearing, Citation1992) and the ‘set-point’ theory (Fujita & Diener, Citation2005; Headey, Citation2008). According to the theories, people may experience an upturn or downturn in their happiness levels in the wake of some sudden, largely unexpected, events such as winning a lottery, entering or terminating a romantic relationship, or suffering bereavement but will, by self-adjustment or goal-reorientation, return to the normal (set-point) level of happiness. Adaptation may be incomplete in the case of highly traumatic events in the wake of which the set-point may not be resumed (Loewenstein & Frederick, Citation1999). This implies that an incessant pursuit of material goods may not lead to enhanced well-being. Yet, given the increasing life pressures, people may have little choice but to keep striving even though their well-being levels may not improve, resulting in a so-called ‘treadmill’ hedonism whereby people just have to keep moving in order to remain where they are (Diener, Lucas, & Scollon, Citation2006; Kahneman, Diener, & Schwarz, Citation1999).
While psychologists are mainly interested in the personality effects on SWB, economists are keen on economic influences. Do people become happier with more money? Are people in rich countries happier than their counterparts in poor countries? Does SWB increase proportionally with increases in the national wealth? Drawing on data from 30 national surveys covering three decades from the 1940s to the 1970s in 19 countries, Easterlin (Citation1974) shows a ‘happiness paradox’. National GDPs and disposable incomes in the USA increased a great deal after the Second World War but the level of happiness rarely changed between 1946 and 1970 (Easterlin, Citation1974, p. 109), a finding reinforced by Putnam (Citation2000, p. 332) for the period extending from 1975 to 1998; nor did people in rich countries such as West Germany show markedly higher levels of happiness than those in poor countries such as Nigeria even though the real GDP per capita in the former was over 10 times as high as in the latter (using the 1960 incomes). It is thus the relative rather than the absolute level of income that seems to matter for people’s well-being. With rising levels of material conditions, people’s norms, expectations and aspirations also rise. ‘Economic growth … engenders ever-growing wants that lend it ever onward’ (Easterlin, Citation1974, p. 121), and this has been confirmed by subsequent studies (Blanchflower & Oswald, Citation2004; Easterlin, Citation1995; Easterlin, McVey, Switek, Sawangfa, & Zweig, Citation2010; Layard, Citation2011), although a positive relationship between economic development and perceived well-being is found in developing countries where basic needs are yet to be met (Veenhoven & Hagerty, Citation2006).
While comparisons between developed and developing countries are interesting, we may note that there are salient differences in the perceived quality of life among the developed countries and even in different parts of the same country. For instance, people in the Scandinavian countries are frequently found to have higher levels of well-being as indicated by better public health and longer life-expectancy than in the USA (Wilkinson, Citation1996, p. 75), and people in different states in the USA have different mortality rates, another indicator of well-being (Putnam, Citation2000, p. 330). Here, there are major differences between epidemiologists and political scientists as to how best to account for such discrepancies.
Wilkinson and Pickett (Citation2009) hold that income inequality and psychosocial mechanisms explain health differences. When national economies reach a certain level, further increases in GDP have diminishing returns but income equality and social justice become the driving force for health and well-being. More equal societies such as the Scandinavian countries and Japan perform better than do more unequal societies such as the USA and the UK in terms of their citizens’ health status. The reason, they argue, is that when poor people in more unequal societies compare themselves with the rich and powerful among their compatriots, they find themselves deprived, and such feelings tend to generate emotions of worry, anxiety, shame, distress or depression, resulting in various forms of health-damaging behaviours such as smoking, over-eating and heavy drinking. Senses of deprivation and status competition not only undermine personal health but also erode interpersonal trust and community building, resulting in a vicious cycle. A more equal society would, on the other hand, entail less status competition and engender higher levels of SWB, which will lead to a higher sense of social justice, stronger interpersonal trust and greater social involvement. Thus, when the economic development of a country has reached a certain level, it is not the richer the better, but the more equal the happier. ‘Inequality gets under the skin’, as Wilkinson and Pickett (Citation2009, p. 31) put it.
National and regional differences in public health, life-expectancy or SWB have also caught the attention of political scientists. Putnam (Citation2000) seeks to explain the observed differences in these respects in terms of social capital or, in other words, how well connected the citizens are in formal and informal social lives. Well-connected people tend to be more trusting and more trustworthy, more generous and helpful, and more informed and relaxed. In the same vein, well-connected communities are less corrupt, more mobilisable, and more capable of finding collective solutions to communal problems, providing a congenial environment which is conducive to enhanced quality of life. Social embeddedness among fellow churchgoers and co-participants in civic organisations has, according to Putnam, powerful protective functions not only in the provision of material or emotional support but also in the cultivation, development and reinforcement of ‘healthy norms’ (Putnam, Citation2000, p. 327). The underlying mechanism in this account is on personal trust and community cooperation rather than status competition as enunciated by Wilkinson and Pickett. After tracing the decline in civic health in the last 50 years in the USA, Putnam (Citation2000) argues that the decline in public health is attributable to Americans’ ‘bowling alone’ in civic life, namely, to the decrease in the nation’s stock of social capital.
While few social scientists would argue against social equality and community development, several criticisms have been raised against the mechanisms proposed in Wilkinson and Pickett’s and Putnam’s psychosocial and social capital theories. For instance, Lynch, Davey Smith, Kaplan, and House (Citation2000) believe that it is under-investment in healthcare facilities in unequal countries that account for the health differences in these countries. This criticism is not at odds with the social capital theory by Putnam but does not explain why there are such marked health disparities between different regions in the same country such as the USA where regional differences in investment in health care can be fairly safely assumed to be rather small relative to the health differences.
The various theories discussed above do not focus on differences in well-being between social groups. Here, social network theory offered by sociologists seems more convincing. According to Lin (Citation2001), social networks have important resources which are manifested not only in instrumental roles such as obtaining information for finding a job or gaining career advancement, but also in the ‘expressive’ functions on one’s emotional life. People tend to find comfort in the company of friends and confidants who provide unique support, especially when one is faced with problems in work life or personal relations. Friends also provide information about health behaviours, health problems and healthcare practices. Social contacts offer a safety net for mutual support, especially when people are sad or depressed or when they have difficulties for which they can hardly hope to find advice or solutions through formal channels. Well-connected individuals can be expected, and are usually found, to be healthier and happier than the socially disconnected (Lin, Ye, & Ensel, Citation1999). It is also worth noting here that as Lin is focused on informal social networks, he does not link both formal and informal connections to explain their impacts on well-being, let alone from a perspective of cumulative social advantages and disadvantages ensuing from intergenerational social mobility trajectories.
Summing up the discussion above, we may say that a more fruitful approach to understanding SWB would be to focus on socio-economic inequality at a micro level, and with such inequality viewed as an outcome of social reproduction processes, that is, as linked with their family and their own class positions. We adopt such an approach and use the UK as a case study. The UK is a highly unequal society with deepening income disparities (Atkinson, Citation2015) and heightened employment insecurity (Standing, Citation2011). As Goldthorpe (Citation2010, p. 737) suggests, class differences define not just current levels of earnings but also income security, stability and future prospects and can be expected to determine people’s objective standard of living and affect their subjective evaluation of work, and personal and social lives. And we may even go further and view differences between people’s current social positions as being rooted in those of their family origin as much of his own and other sociologists’ research has shown. It is well established that family class plays a significant role in their children’s educational, occupational and earnings attainment (Blanden, Goodman, Gregg, & Machin, Citation2004; Goldthorpe, Citation1987; Lambert, Prandy, & Bottero, Citation2007; Li & Devine, Citation2011, Citation2014; Li & Heath, Citation2016). People situated in the lower rungs of the social hierarchy will tend to come from disadvantaged origins, and have precarious jobs, poor working conditions, high risks of unemployment, low and unstable incomes, and overcrowded housing in poor areas. This implies that people’s current class position per se might not be best indicator of their socio-economic position which needs to be extended by including their mobility trajectory profiles. Class as understood this way, together with other forms of social advantages and disadvantage, will have a powerful impact on people’s physical and mental health, happiness and life satisfaction or, on their perceived or SWB in short. Our focus on mobility-based class differences together with other forms of socio-economic-demographic disadvantages will thus enable us to conduct a more fine-grained analysis of the interrelationship between social inequality, social connection and SWB than available in the existing literature.
Data and measurement
The foregoing suggests that people’s class position through intergenerational mobility experience would affect both their social connectedness and their perceived quality of life. In the following analysis, we assess how class (as rooted in mobility trajectories) affects the different domains of social connection and, through them, the subjective evaluation of well-being in contemporary UK society. In so doing, we can also assess whether the upwardly and the downwardly mobile are closer to their peers in the origin and destination classes in the cultivation of social ties and how such ties will in turn affect their well-being. We also take into account the effects of personal factors such as gender, age, marital status and ethnicity, and structural factors such as educational qualifications and employment status.
The data for this paper are drawn from Waves 1–4 of the United Kingdom Household Longitudinal Study (UKHLS) (also known as Understanding Society, or USoc) which were the data available at the time of analysis. All data files, questionnaires and associated documentations are publicly available at http://ukdataservice.ac.uk/get-data/key-data.aspx#/tab-uk-surveys. The data contain a wealth of information on socio-economic position, formal and informal social connection and life experience. We use demographic, cultural and social factors including intergenerational mobility trajectory and prior levels of well-being as determinants, social networks as mediators, and perceived well-being as the outcome of interest. The socio-demographic and prior well-being variables are taken from Waves 1–3 (from Wave 2, respondents from the British Household Panel Survey joined the USoc and their data were included in the analysis), social connection variables from Wave 3 and well-being indicators from Wave 4 of the USoc. The time order thus introduced in the analytical framework is aimed at minimising biases which tend to arise in the use of contemporaneous data.
We now introduce our variables. With regard to social connection, we follow Lin (Citation2001), Putnam (Citation2000), Li, Pickles, and Savage (Citation2005) and Laurence (Citation2011) in constructing four types of formal and informal social network: civic engagement, neighbourhood cohesion, network diversity and network size. Lin (Citation2001) suggests that social resources residing in the intensity and volume of informal social ties are useful for both instrumental and ‘expressive’ purposes. Putnam (Citation2000) argues that those active in social engagement are more likely than the disengaged to have both bonding and bridging connections (ties with similar and dissimilar others, respectively), that formal and informal networks are mutually reinforcing (Lim & Putnam, Citation2010), and that such ties are effective not only for individuals in their everyday life, but also for communities in the implementation of pro-health policies through trusting and collaborative relations. Li et al. (Citation2005) develop a three-tiered measure of social capital consisting of civic engagement, neighbourhood attachment and social support. Laurence (Citation2011) view community cohesion as bridging the macro and the micro social milieu capable of generating tangible benefits for the residents. Combining insights from these and other recent work in this area (Li, Citation2015), we view social capital as resources residing in both formal and informal social networks and, within the latter, as lying at both micro- and meso-levels. It is also noted here that although Portes (Citation1998) and Putnam (Citation2000) both warned about the ‘dark’ sides of social capital such as those exhibited in the downward levelling norms and excess claims among the bonding ties, little evidence is available on negative effects among bridging ties. As bridging ties are with people of dissimilar characteristics, one might suspect that not all such ties will play an equally strong or even an equally positive role on people’s well-being. This, however, is an empirical question awaiting detailed examination, which we shall do in the paper.
Civic engagement is measured as a summary score of 16 types of membership or activity in political party, trade union, environmental group, parents/school association, neighbourhood watch group, religious/church organisation, voluntary services group, pensioners group, scouts/guides organisation, professional organisation, other community or civic group, social club/working men’s club, sports club, women’s institute/townswomen’s guild, women’s group/feminist organisation, other group or organisation. Neighbourhood cohesion is a summary score of seven items, each scaled from 1 (‘strongly disagree’) to 5 (‘strongly agree’), in terms of the extent to which the respondents view theirs as a close-knit neighbourhood in which neighbours tend to help, trust and go along well with one another, whether they worry about crime in their neighbourhood and the extent of worry, and whether they feel safe walking alone at night. Network diversity summarises the scores ranging from ‘all of them’ (score 1) to ‘none of them’ (score 4) on proportions of friends with similar age, race, level of education, being employed, having similar income, living in the local area, and being family members. Finally, the network size variable measures the number of close friends our respondents have, ranging from 0 to 100.Footnote1 The four domains thus purport to measure the depth and width of social embeddedness in both formal and informal networks, offering a comprehensive coverage of social capital. The four summary scores are based on valid responses in the source variables and are significantly interrelated (at the .001 levels) but the coefficients are weak, at around .15 for most of the pairwise correlations.
Most studies on well-being use one or another indicator as outcomes of interest, such as health (Subramanian, Kim, & Kawachi, Citation2002), happiness (Easterlin, Citation1995) and life satisfaction (Schyns, Citation2002), suggesting that these are manifestations of some common underlying property of people’s evaluation of their life experience, otherwise called SWB in the literature. In this paper, we shall treat perceived health status, happiness and overall life satisfaction as indicators of SWB. The general health question has five categories, ranging from ‘poor’ to ‘excellent’; the general happiness question has four categories, ranging from ‘much less than usual’ to ‘much more than usual’, and the question on satisfaction with life overall has seven categories, ranging from ‘completely dissatisfied’ to ‘completely satisfied’. The three questions thus tap the general or overall state of well-being rather than the momentary fluctuations of mood, reflecting the more stable aspects of people’s life experience.
As noted above, scholars seek to understand the change or stability in people’s SWB from different perspectives, ranging from demographic factors among psychologists, financial situations among economists, to structural inequalities among sociologists. With regard to structural inequalities, sociologists have long recognised that not only people’s current positions, but also their mobility trajectories have an important impact on their life experiences. The long-range upwardly mobile tend to enjoy social and material benefits conferred upon them in the current class positions but might find themselves unable to gain full acceptance by those intergenerationally stable in the advantaged positions. Those experiencing long-range downward mobility may regard their current situation as temporary and strive for counter-mobility which many do achieve upon occupational maturity, and they may enjoy advantages ensuing from family origins, making them disinclined to adopt the lifestyles of, or form close ties with, members in the destination class who have been intergenerationally stable in the most disadvantaged positions. Both the upwardly and the downwardly mobile may thus experience estrangement, disruption and disassociation in their social relations. To compensate for this, the upwardly mobile may seek to establish new social ties by joining civic associations (Aiken & Goldberg, Citation1968) or with people who have followed similar mobility trajectories (Goldthorpe, Citation1987). The intergenerationally stable members would also have rather different life experiences pending on the class locations in which they find themselves. Members of the stable (professional–managerial) salariat command the greatest amount of socio-economic-cultural resources while those intergenerationally stable in the manual working class face the greatest disadvantages in employment, earnings, housing and so on. Seen from this perspective, one might well say that one’s social position derived from intergenerational social mobility trajectories is a more powerful and more accurate indicator of accumulated social advantages and disadvantages than current class position per se, a position we take in this paper. Yet, to avoid repetition, we use the two terms interchangeably or ‘class’ as a short-hand. To assess mobility trajectory effects, we follow Goldthorpe (1987, Citation2010) in marking movement into or out of the salariat as the most decisive ‘moment’ in mobility experience. In addition, we retain the stable classes as well as short-range upward and downward mobility trajectories. Altogether, seven mobility classes are constructed from cross-tabulation of the three-way parental and respondent’s classes as shown in .Footnote2
Figure 1. A schema of intergenerational social mobility. Notes: 1: stable salariat, 2: upwardly mobile to the salariat, 3: downwardly mobile from the salariat, 4: stable intermediate, 5: short-range upward mobility, 6: short-range downward mobility, 7: stable working class. The Ns are 7546, 9861, 7270, 6116, 4477, 5870 and 6113 for the 7 mobility classes, respectively (47,253 in total). Source: The USoc Survey.
As most of the demographic attributes are self-explanatory, we give a brief account of other sociocultural indicators. The UK is a multi-ethnic society with over 14% of the population being of ethnic minority heritages according to the 2011 Census of the Population. We code seven ethnic groups as in standard practice: white, black Caribbean, black African, Indian, Pakistani/Bangladeshi, Chinese and Others. Migrants and their children of white European origins from Europe, North America, Australia, New Zealand (‘white Other’) and from the Republic of Ireland (‘white Irish’) are included in the white category. Previous analysis shows no significant differences among the three white groupings (Li & Heath, Citation2008).
A brief note on methodological issues is also in place here. Research on mobility effects is usually conducted by using Sobel’s (Citation1981) diagonal reference model (DRM) or constructing a mobility trajectory variable based on parental and respondent’s classes. Studies using the DRM have been conducted on fertility rates (Sobel, Citation1985), voting behaviours (Clifford & Heath, Citation1993), ethnic attitudes (Tolsman, de Graaf, & Quillian, Citation2009), health perceptions (Houle, Citation2011; Houle & Martin, Citation2011) and happiness (Zhao & Li, Citation2016) while studies using a trajectory variable have been conducted on social trust (Li et al., Citation2005), social capital (Li, Savage, & Warde, Citation2008) and cultural consumption (Li, Savage, & Warde, Citation2015). Whereas the DRM does have the advantage of being able to overcome the multicollinearity issues over position as well as mobility effects on outcomes of interest, our present concerns are somewhat different. As our interest in this paper is in the direction and magnitude of class effects on well-being as mediated by social connection, we shall use the structural equation modelling (SEM) method which can effectively deal with the direct and the mediated (indirect) effects.
Analysis
We begin by giving a summary view of the key variables used in the study: SWB, types of social connection, and employment situation associated with our classes (). As the raw scores of well-being and social connection vary widely, standardised scores are used in the figure and in the subsequent analysis. Data on employment are measured in percentage points and shown on the secondary axis. The inclusion of workless rates aims at capturing the class-lined inequality in the objective domains of life chances which would feed into people’s subjective evaluation of quality of life.
Figure 2. Class differences in social network, well-being and employment. Notes: Data on civic engagement, neighbourhood cohesion, network diversity, network size and well-being are based on standardised measures; data on worklessness are shown on the secondary axis, referring to percentage-point differences of each of the other classes with Class 1 whose rate is set at 0. Source: The USoc Survey.
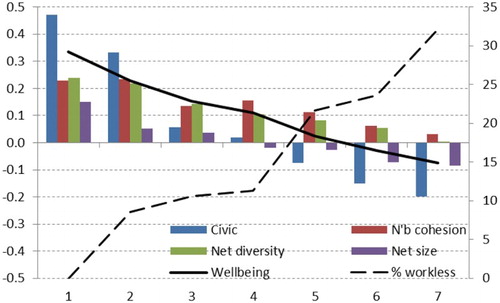
shows marked class differences in both objective and subjective domains. The workless rate for the stable working class is 32 percentage points higher than for the stable salariat (at 54% and 22%, respectively). Differences in social connection are also evident, particularly with regard to civic engagement, at .47 and −.2 in terms of standardised scores, confirming existing studies on social divisions in British civic life (Hall, Citation1999; Li et al., Citation2003, Citation2005). And there is a clear and strong linear relationship in SWB, starting at .34 for the stable salariat and going all the way down to −.08 for the stable working class. Class therefore clearly matters, for employment, social network and well-being.
Having looked at the gross differences, we turn to explore the interrelationship between socio-economic conditions, demographic–cultural attributes, types of social connection and components of well-being, which we do using the structural equal modelling method as noted above where both social connection and well-being are measured as latent variables. The latent score of social connection was abstracted from civic engagement, neighbourhood cohesion, network diversity and network size, and that of well-being from self-rated health, happiness and overall life satisfaction, measured in Waves 3 and 4 of the USoc, respectively. Our main concern is whether social connection is significantly associated with any or all of the four domains as we have conceptualised, whether well-being is significantly associated with the three indicator variables as are frequently used in research in the area, whether mobility trajectory is significantly related to social connection and, through this, to well-being as well, net of the effects of other socio-demographic covariates controlled for in the model. The coefficients on the measurement model (the links between each of the indicator variables and the latent measures of social connection and well-being) and the structural model (the link between social connection and well-being) are shown in , with the direct, indirect and total effects of class on well-being shown in .
Figure 3. SEM on social network and well-being. Note: Standardised coefficients reported, ***p < .001. Source: The USoc Survey.
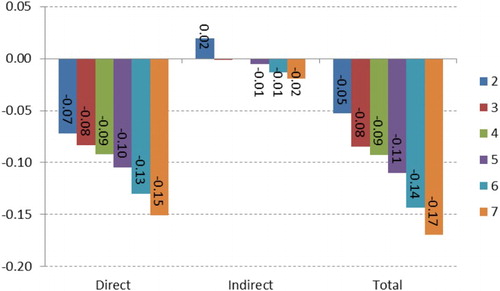
Figure 4. Direct, indirect and total class differences in well-being. Notes: The data are standardised class differences net of all other socio-demographic influences in , and are significant at the .001 level except for Classes 3 and 4 in the indirect effects where the data labels are not shown. Class 1 is the reference group. All coefficients for Classes 2–6 versus Class 7 are significant at the .001 level in the direct, indirect and total effects. Source: The USoc Survey.
With regard firstly to data in , we find that the four types of formal and informal social networks are all significantly associated with the latent construct of social connection which is also significantly related to well-being. Social connection is most strongly associated with neighbourhood cohesion, followed by network diversity but the links with the other two types (civic engagement and network size) are weaker. Well-being is also significantly associated with health, happiness and overall life satisfaction, with the association with health being the strongest.Footnote3 This suggests that having trustworthy and supportive neighbours and friends, and participating in civic activities are all conducive to one’s well-being even when the objective measures of health and other socio-demographic factors are taken into account.
How do people with different class trajectories construct their social networks and use them to enhance their life experience? Do the upwardly mobile have, for instance, greater social resources and higher levels of well-being than do the downwardly mobile? Or do more advantaged origins act as a powerful countervailing force?
As our mobility trajectory class is a categorical variable, we show, in , the discrete effects on well-being as obtained from the SEM modelling. The direct effects refer to the link between class and well-being, the indirect effects to those mediated by social connection, and the total effects to the sum of the direct and the indirect effects, all net of the influences of the covariates. Here, we find that the direct effects assume a much greater role than do the indirect effects in the total effects. Net of all other factors controlled for in the model, people in all other classes are significantly behind the stable salariat in well-being and the data show a very smooth gradient, with the coefficients ranging from −.07 to −.15 from the upwardly mobile into the salariat to the stable working class. With regard to the indirect effects, we find that the three lower classes, namely, the short-range upwardly and downwardly mobile and the stable working class, are significantly less likely than the more advantaged to mobilise their social resources via networks for their well-being but it is noteworthy that the long-range upwardly mobile into the salariat have significantly higher effects (by .02 standardised units) than even the stable salariat classes. Further analysis also revealed that the upwardly mobile have significantly (at the .001 levels) higher scores than do the downwardly mobile in both social connection and well-being, suggesting that destination outweighs origin in these respects.
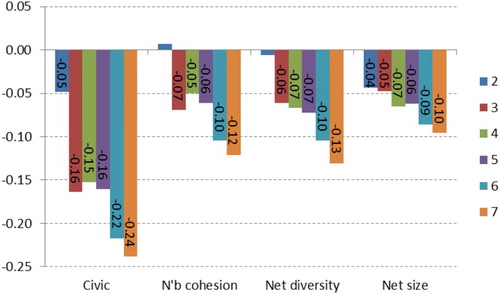
While shows direct and indirect effects at a more abstract level, it would be of interest to see such effects in a more concrete manner, that is, in terms of their constituents. This is shown in . Here, we find that although neighbourhood cohesion and network diversity loaded most strongly with social connection as shown in , the net class differences are shown most strongly in civic engagement where all other classes fall behind the stable salariat, particularly the five lower classes from the long-range downwardly mobile to the stable working class. The class differences in neighbourhood cohesion, network diversity and network size are much smaller by comparison and assume a fairly similar profile. Another feature that emerges from the data concerns the lack of significant difference between the long-range upwardly mobile and the stable salariat in neighbourhood cohesion and network diversity although the former have a significantly smaller number of friends who may be of a more cross-class kind. Thus, insofar as social network is concerned, while destination effects generally outweigh origin effects, origin effects are not negligible, as shown in the differences between the long-range upwardly and the long-range downwardly mobile respondents (classes 2 and 3) in the total effects () and in those on three of the four types of social connection (, the minor exception being the volume of network size).Footnote4
Figure 5. Net class differences in four types of social networks. Note: All coefficients are standardised class differences in each type of social networks net of all other socio-demographic influences, and are significant at the .001 level except for Class 2 in neighbourhood cohesion and network diversity where the data labels are not shown. Class 1 is the reference group. Source: The USoc Survey.
The foregoing has focused on the class effects on social connection and well-being, with the socio-demographic factors treated as ‘auxiliary’ variables in the SEM model. Yet, the literature on well-being from psychological, economic and political science perspectives suggests that these factors would play a significant role themselves. In view of this, we shall, in the remaining part of the analysis, devote our attention to such effects.
The data in show the socio-demographic effects on well-being. The analysis is based on ordinary least squares regressions with four models. Model 1 focuses on the four types of social connection, Model 2 adds demographic factors on age, gender, partnership, limiting long-term illness and ethnicity, model 3 further adds mobility trajectory classes, education, and employment status and, finally, Model 4 includes prior levels of well-being, a standardised measure of the sum of general happiness, health and overall life satisfaction in Wave 3 of the USoc. As our outcome variable is measured in Wave 4, controlling for prior levels of well-being would help to minimise the confounding effects.Footnote5
Table 1. Regression coefficients on well-being by social connection, socio-demographic factors and prior levels of well-being.
The positive effects of civic engagement, neighbourhood cohesion and network size on well-being are as expected but it is surprising to find negative effects associated with network diversity. It is even more surprising that the negative effects increased from models 1 to 3 although they were reduced when prior well-being was taken into consideration. Theorists like Portes (Citation1998) and Putnam (Citation2000) have, as we have seen, warned about the possible dark sides of bonding social capital, yet little evidence has been available on possible negative effects of bridging social capital on well-being. We shall shortly examine this in greater detail.Footnote6
Moving to other models, we find that the social capital effects remain significant when the demographic factors are controlled for. In Model 2, we find that the middle-aged tend to have lower levels of well-being, reflecting their greater responsibilities in their family and work lives. As much evidenced in other research (Diener et al., Citation1999; Easterlin, Citation1974; Putnam, Citation2000), the partnered feel, other things being equal, happier, healthier and more satisfied with life. People with limiting long-term illness have much lower levels of well-being as could be expected. Women tend to be in lower socio-economic positions in terms of class, education, income and employment, as do some ethnic minority groups such as black Caribbean and Pakistani/Bangladeshi respondents but as we see in model 3, the negative gender and ethnic effects were reduced. With the social capital and demographic effects controlled for, the social factors associated with class, education, and employment status retain a predominant role.
The most important feature is shown in model 4 where, in addition to all other factors we have included in model 3, prior levels of well-being are controlled for. Here, we find that prior well-being plays the most important role, at least in terms of the effect size which, at .488, is stronger than any of the other factors under consideration and which lends some support to the dynamic equilibrium theory noted earlier. We also find that the ethnic effects became non-significant, suggesting that for our respondents of Indian, Pakistani/Bangladeshi and Chinese origins who may have had lower levels of well-being in previous waves, which further analysis confirmed, no additional ethnic disadvantages were involved among those with similar levels of prior well-being. Yet, even with all other factors held constant in the model, we find clear class gradients, with the stable working class having much lower levels of well-being than the stable salariat (−.147).
Conclusion
We have, in this paper, sought to make a sociological contribution to the relationship between social capital and SWB in contemporary UK society focusing on mobility trajectory effects. Using data from the USoc Survey, we analysed social network and well-being in the same framework. To our knowledge, this is the first systematic treatment linking all these factors together. The main findings can be summarised as follows.
Firstly, while most studies on social capital and well-being use cross-sectional data, this analysis uses the panel data which allowed us to examine the social capital effects on well-being as mediators and to take account of the prior well-being effects. In so doing, we were able to reduce the bias likely to arise in the use of contemporaneous data and to reaffirm the psychological claims of the general stability of well-being ().
Secondly, through the use of SEM methods, we were able to show that the four domains of social connectedness as we conceptualised and measured were closely associated with the underlying construct of social capital, as were the indicators of happiness, health and overall life satisfaction with SWB (). This offered a systematic treatment of the various factors which are interrelated but usually analysed in isolation. Using the mediation analysis, we were able to show that social capital did have a significant impact on well-being as predicted by social capital theory but its importance was relatively small (). While findings in this regard lend support to claims in Lin et al. (Citation1999), Putnam (Citation2000) and Helliwell and Putnam (Citation2004), we show that focusing on social capital does not really grapple with the root causes of inequality in well-being. Our simultaneous treatment of the different domains of social network also revealed that they did not play an equally important or, indeed, an equally positive, role on people’s well-being, which tempers some of the over-enthusiastic claims on bonding or bridging social capital.
Thirdly, this paper made a useful sociological contribution to social capital and well-being scholarship by linking these to the social reproduction processes. While a great deal of research has been conducted on class differences in life chances and life choices, this research has enabled us to see both direct and indirect class effects on well-being. Our analysis shows a more accurate picture of the relative importance of class on well-being than is available in the existing literature, which has enhanced our understanding of the structural inequalities existing in British society.
It is also important to acknowledge the shortcomings in this paper. Due to data limitation, we were unable to analyse the intergenerational mobility trajectory classes of our respondents’ friends, which would have given us a better grasp of cross-class networks and their effects on social capital and well-being. Future analysis could take this and, furthermore, personality and intragenerational changes in class, employment, income statuses and family composition to address psychologists’ concerns with dynamic equilibrium and economists’ concerns with financial impacts. These and other limitations notwithstanding, we feel that our analysis in this paper has convincingly demonstrated the powerful effects of class as the fundamental aspect of social inequality in both social network and well-being. Seen from this perspective, one may argue that while the current government’s initiative to enhance community cohesion and to monitor material and subjective indicators of quality of life is a step forward, greater social equality is unlikely to be achieved without reducing the deep-rooted class inequality, an issue which successive governments in the UK have been reluctant to address.
Acknowledgements
The author gratefully acknowledges the very helpful suggestions and comments by the two anonymous reviewers, and by attendants at the ‘Social connection and well-being’ conference at Queensland University, Australia on 28 July 2015; the ‘Cambridge social stratification’ conference at Milan University, Italy on 8 September 2015; and the ‘Social inequality, labour markets and well-being’ symposium at the Cathie Marsh Institute for Social Research, Manchester University, Britain on 23 October 2015 where the initial findings were presented. All errors in the paper remain the author’s own.
Disclosure Statement
No potential conflict of interest was reported by the author
Notes on contributor
Yaojun Li is Professor of Sociology, Manchester University, UK. His research interests are in social mobility, social capital and ethnic integration. He has published around 80 papers and research reports and an edited book in these areas, and conducted over 20 projects funded by agencies in Britain, the USA, China, Australia and Qatar.
Additional information
Funding
Notes
1 As over 40 variables were used in the analysis, it is not possible to list the question and item wording for each of them either in the text or in an appendix given the space limit of the paper. Interested readers could visit the web-link in the text where full details are provided.
2 Prior analyses show that people who experienced downward mobility from salariat origins to intermediate and working-class positions do not differ systematically in social connection and well-being.
3 Further analysis showed that the four domains of social connection and the three domains of well-being are, net of the impacts of the other factors included in the model, all significantly different from one another. This suggests that no serious issue of multicollinearity was encountered.
4 Controlling for all other variables included in the SEM model, differences between Classes 2–7 and the stable salariat are significant at the .001 level for each of the indicator variables for perceived well-being.
5 We also carried a robust test limiting all models to non-missing responses and the patterns were little changed. We wish to thank an anonymous reviewer for the insightful suggestions in this regard.
6 Of the seven indicators for network diversity, it is ‘proportion of friends with similar income’ that contributed significantly to the overall negative effect. This suggests that although people may compare themselves with others in both downward and upward manners, it is probably the latter kind of comparison that negatively affects their well-being.
References
- Aiken, M., & Goldberg, D. (1968). Social mobility and kinship: A reexamination of the hypothesis. American Anthropologist, 71, 261–270. doi: 10.1525/aa.1969.71.2.02a00050
- Atkinson, A. B. (2015). Inequality: What can be done? London: Harvard University Press.
- Blanchflower, D. G., & Oswald, A. J. (2004). Well-being over time in Britain and the USA. Journal of Public Economics, 88(7), 1359–1386. doi: 10.1016/S0047-2727(02)00168-8
- Blanden, J., Goodman, A., Gregg, P., & Machin, S. (2004). Changes in intergenerational income mobility in Britain. In M. Corak (Ed.), Generational income mobility in North America and Europe (pp. 122–146). Cambridge: Cambridge University Press.
- Bourdieu, P. (1986). The forms of capital. In H. Lauder, P. Brown, J. Dillabough, & A. H. Halsey (Eds.), Education, globalization & social change (pp. 105–118). Oxford: OUP (2006).
- Cabinet Office. (2013). Collection: National wellbeing. Retrieved September 12, 2015, from https://www.gov.uk/government/collections/national-wellbeing#history
- Cameron, D. (2010, November 25). PM speech on well-being. Retrieved from http://www.number10.gov.uk/news/speeches-and-transcripts/2010/11/pm-speech-on-well-being-57569
- Clifford, P., & Heath, A. (1993). The political consequences of social mobility. Journal of the Royal Statistical Society: Series A, 156(1), 51–61. doi: 10.2307/2982860
- Coleman, J. S. (1988). The creation and destruction of social capital: Implications for the law. Notre Dame Journal of Law, Ethics, Public Policy, 3, 375–404.
- Department for Communities and Local Government. (2012). Creating the conditions for integration. Retrieved 9/4/2012, from http://www.communities.gov.uk/documents/communities/pdf/2092103.pdf
- Diener, E., Lucas, R., & Scollon, C. (2006). Beyond the hedonic treadmill – Revising the adaptation theory of well-being. American Psychologist, 61(4), 305–314. doi: 10.1037/0003-066X.61.4.305
- Diener, E., Suh, E., Lucas, R., & Smith, H. (1999). Subjective well-being: Three decades of progress. Psychological Bulletin, 125(2), 276–302. doi: 10.1037/0033-2909.125.2.276
- Easterlin, R. (1974). Does economic growth improve the human lot? Some empirical evidence. Nations and Households in Economic Growth, 89, 89–125. doi: 10.1016/B978-0-12-205050-3.50008-7
- Easterlin, R. (1995). Will raising the incomes of all increase the happiness of all? Journal of Economic Behavior & Organization, 27(1), 35–47. doi: 10.1016/0167-2681(95)00003-B
- Easterlin, R., McVey, L., Switek, M., Sawangfa, O., & Zweig, J. (2010). The happiness-income paradox revisited. Proceedings of the National Academy of Sciences of the United States of America, 107(52), 22463–22468. doi: 10.1073/pnas.1015962107
- Fujita, F., & Diener, E. (2005). Life satisfaction set-point: Stability and change. Journal of Personality and Social Psychology, 88, 158–164. doi: 10.1037/0022-3514.88.1.158
- Goldthorpe, J. H. (1987). Social mobility and class structure in modern Britain. Oxford: Clarendon Press.
- Goldthorpe, J. H. (2010). Analysing social inequality: A critique of two recent contributions from economics and epidemiology. European Sociological Review, 26(6), 731–744. doi: 10.1093/esr/jcp046
- Hall, P. (1999). Social capital in Britain. British Journal of Political Science, 29, 417–461. doi: 10.1017/S0007123499000204
- Headey, B. (2008). Life goals matter to happiness: A revision of set-point theory. Social Indicators Research, 86(2), 213–231. doi: 10.1007/s11205-007-9138-y
- Headey, B., & Wearing, A. (1992). Understanding happiness: A theory of subjective well-being. Cheshire: Longman.
- Helliwell, J., & Putnam, R. (2004). The social context of well-being. Philosophical Transactions of the Royal Society B: Biological Sciences, 359, 1435–1446. doi: 10.1098/rstb.2004.1522
- Houle, J. (2011). The psychological impact of intragenerational social class mobility. Social Science Research, 40(3), 757–772. doi: 10.1016/j.ssresearch.2010.11.008
- Houle, J., & Martin, M. (2011). Does intergenerational mobility shape psychological distress? Sorokin revisited. Research in Social Stratification and Mobility, 29(2), 193–203. doi: 10.1016/j.rssm.2010.11.001
- Kahneman, D., Diener, E., & Schwarz, N. (Eds.). (1999). Well-being: The foundations of hedonic psychology. New York: Russell Sage Foundation.
- Lambert, P., Prandy, K., & Bottero, W. (2007). By slow degrees: Two centuries of social reproduction and mobility in Britain. Sociological Research Online, 12, 1. http://www.socresonline.org.uk/12/1/prandy.html
- Laurence, J. (2011). The effect of ethnic diversity and community disadvantage on social cohesion: A multi-level analysis of social capital and interethnic relations in UK communities. European Sociological Review, 27(1), 70–89. doi: 10.1093/esr/jcp057
- Layard, R. (2011). Happiness: Lessons for a new science (2nd ed.). London: Penguin.
- Li, Y. (2015). Social capital in sociological research: Conceptual rigour and empirical application. In Y. Li (Ed.), The handbook of research methods and applications on social capital (pp. 1–20). Cheltenham: Edward Elgar Publishing.
- Li, Y., & Devine, F. (2011). Is social mobility really declining? Intergenerational class mobility in Britain in the 1990s and the 2000s. Sociological Research Online. Retrieved from http://www.socresonline.org.uk/16/3/4.html
- Li, Y., & Devine, F. (2014). Social mobility in Britain, 1991–2011. In L. Archer, A. Mann, & J. Stanley (Eds.), Understanding employer engagement in education: Theories and evidence (pp. 79–91). London: Routledge.
- Li, Y., & Heath, A. (2008). Ethnic minority men in British labour market (1972–2005). International Journal of Sociology and Social Policy, 28(5), 231–244. doi: 10.1108/01443330810881277
- Li, Y., & Heath, A. (Forthcoming). Class matters: A study of minority and majority social mobility in Britain (1982–2011). American Journal of Sociology, 122(1).
- Li, Y., Pickles, A., & Savage, M. (2005). Social capital and social trust in Britain. European Sociological Review, 21(2), 109–123. doi: 10.1093/esr/jci007
- Li, Y., Savage, M., & Pickles, A. (2003). Social capital and social exclusion in England and Wales (1972–1999). British Journal of Sociology, 54(4), 497–526. doi: 10.1080/0007131032000143564
- Li, Y., Savage, M., & Warde, A. (2008). Social mobility and social capital in contemporary Britain. British Journal of Sociology, 59(3), 391–411. doi: 10.1111/j.1468-4446.2008.00200.x
- Li, Y., Savage, M., & Warde, A. (2015). Social stratification, social capital and cultural practice in the UK. In Y. Li (Ed.), The handbook of research methods and applications on social capital (pp. 21–39). Cheltenham: Edward Elgar Publishing.
- Lim, C., & Putnam, R. (2010). Religion, social networks, and life satisfaction. American Sociological Review, 75(6), 914–933. doi: 10.1177/0003122410386686
- Lin, N. (2001). Social capital. Cambridge: Cambridge University Press.
- Lin, N., Ye, X., & Ensel, W. (1999). Social support and depressed mood: A structural analysis. Journal of Health and Social Behavior, 40(4), 344–359. doi: 10.2307/2676330
- Loewenstein, G., & Frederick, S. (1999). Hedonic adaptation: From the bright side to the dark side. In D. Kahneman, E. Diener, & N. Schwarz (Eds.), Well-being: The foundations of hedonic psychology (pp. 61–84). New York: Russell Sage Foundation.
- Lynch, J., Davey Smith, G., Kaplan, G., & House, J. (2000). Income inequality and mortality: Importance to health of individual income, pyschosocial environment or material conditions. British Medical Journal, 320, 1200–1204. doi: 10.1136/bmj.320.7243.1200
- Portes, A. (1998). Social capital: Its origins and applications in modern sociology. Annual Review of Sociology, 24, 1–24.
- Putnam, R. (2000). Bowling alone: The collapse and revival of American community. New York: Simon & Schuster.
- Schyns, P. (2002). Wealth of Nations, individual income and life satisfaction in 42 countries: A multilevel approach. Social Indicators Research, 60(1–3), 5–40.
- Sobel, M. (1981). Diagonal mobility models: A substantively motivated class of designs for the analysis of mobility effects. American Sociological Review, 46, 893–906. doi: 10.2307/2095086
- Sobel, M. (1985). Social mobility and fertility revisited: Some new models for the analysis of the mobility effects hypothesis. American Sociological Review, 50(5), 699–712. doi: 10.2307/2095383
- Standing, G. (2011). The precariat: The new dangerous class. London: Bloomsbury Academic.
- Subramanian, S., Kim, D., & Kawachi, I. (2002). Social trust and self-rated health in US communities: A multilevel analysis. Journal of Urban Health: Bulletin of the New York Academy of Medicine, 79(4), S21–S34. doi: 10.1093/jurban/79.suppl_1.S21
- Tolsman, J., de Graaf, N., & Quillian, L. (2009). Does intergenerational social mobility affect antagonistic attitudes towards ethnic minorities? The British Journal of Sociology, 60(2), 257–277. doi: 10.1111/j.1468-4446.2009.01230.x
- Veenhoven, R., & Hagerty, M. (2006). Rising happiness in nations 1946–2004: A reply to Easterlin. Social Indicators Research, 79(3), 421–436. doi: 10.1007/s11205-005-5074-x
- Wilkinson, R. (1996). Unhealthy societies: The afflictions of inequality. London: Routledge.
- Wilkinson, R., & Pickett, C. (2009). The spirit level. London: Allen Lane.
- Zhao, Y., & Li, Y. (2016, April). Happiness in China: Asymmetrical permeability in acculturation. Presentation at BSA, Aston University.