
 ?Mathematical formulae have been encoded as MathML and are displayed in this HTML version using MathJax in order to improve their display. Uncheck the box to turn MathJax off. This feature requires Javascript. Click on a formula to zoom.
ABSTRACT
The increasing pressure within developing countries to focus on other national objectives has led to declining fiscal transfers for conservation. This paper assesses the potential for a typical large African park such as the Kruger National Park to generate additional revenue through an entrance fee hike in order to finance park operations. This is investigated by estimating international tourists’ willingness to pay (WTP) for possible future visits. The estimated WTP is substantial, ranging from $216 to $255 per trip and $79 million to $94 million per year for all international tourists. Using a non-parametric survival function to calculate the consumer surplus that could be extracted from tourists, we show that park authorities can increase total revenue by 57% to 61% ($38 million and $40 million) per year. These findings indicate that unique African parks such as the Kruger National Park can contribute to African economies through revenues from increased entrance fees.
1. Introduction
Although national parks in developing countries could potentially generate more revenue than they currently do, they remain largely reliant on fiscal transfers to fund conservation activities (Alpízar Citation2006; Borie et al. Citation2014; Walpole, Goodwin, and Ward Citation2001). On one hand, governments are increasingly urged to focus on other national objectives, such as poverty reduction, education, and health, and this has intensified competition to secure conservation funds from the State, even though most parks in Africa are not fully government-funded. On the other hand, there is also a heated contestation about the appropriateness of either increasing the land under protected areas or even preventing their conversion to other land uses (Andam et al. Citation2010; Trimble and Van Aarde Citation2014). The result has been a general decrease in funding for conservation, which in turn threatens the existence of national parks and other protected areas (see Child Citation2017; Hwari Citation2017; Nkala Citation2017). Policymakers promoting tourism as a strategy for sustainable development frequently have to justify the benefits of national parks on economic grounds (Lee and Mjelde Citation2007). The ability to generate additional revenue is therefore important for park managers seeking alternative ways to bridge the funding gap.Footnote1
Increasing entrance fees is one possible way in which parks can offset cuts in State subsidies (SANParks Citation2012, Citation2019a). The number of studies giving guidance on setting entrance fees for national parks in developing countries is however, still limited but growing (see, for example, Alpízar Citation2006; Chase et al. Citation1998; Dikgang and Muchapondwa Citation2017; Mukanjari, Muchapondwa, and Demeke Citation2021; Mulwa, Kabubo-Mariara, and Nyangena Citation2018). Laarman and Gregersen (Citation1996) note that pricing is generally underutilized as a park management tool mainly because the professional rewards for park managers are tied rather to programme development than revenue maximization. In addition, conservation is generally viewed as a public good which should be funded through the fiscus (Sable and Kling Citation2001). At the same time, funds generated from wildlife conservation, once deposited in the treasury, are often redirected to other purposes and difficult for the parks to recover (Lindsey et al. Citation2014).
In this paper, we first use the contingent valuation method (CVM) to determine international tourists’ willingness to pay (WTP) for future visits to Kruger National Park (KNP). We then use the estimated WTP as a basis for exploring the potential of the park to generate additional revenue for conservation through setting appropriate entrance fees. Park entrance fees play an important role as a management tool in controlling congestion inside protected areas (ex-ante before negative tourism effects). More importantly, entrance fees help support biodiversity conservation through generating revenues crucial to finance park operations. This can be through directly funding some of the activities from the budget line such as salaries for the rangers, sinking boreholes, general park maintenance or restoration of degraded ecological processes (ex-post after negative tourism effects). However, we acknowledge that the entrance fee does not have to capture the full value of wildlife or biodiversity to international tourists. Although we use a survey of international tourists only, which cannot fully capture the total possible additional revenue, the framework can be used for predicting how visits to the park and total revenues change as the entrance fee for any category of tourists is increased. This information can provide guidance to policymakers on restructuring or formulating better pricing policies.
The focus of the paper is on entrance fees paid by international tourists from overseas because previous studies demonstrated that this category of recreationists enjoy a much bigger consumer surplus compared to regionalFootnote2 or domestic tourists (Alpízar Citation2006; Dikgang and Muchapondwa Citation2017; Moran Citation1994).Footnote3 In addition, although local tourists constitute the largest share of visitors to KNP, increasing the entrance fee for this subgroup of tourists is highly contested due to marginalization or accusations about the unfair dismissal of poor people from the market (Alpízar Citation2006).Footnote4 Furthermore, domestic tourists directly pay taxes to the government which is also used to fund conservation. While the potential of generating additional revenue by increasing entrance fees for regional tourists exists, this is however limited by the fact that the demand for this subgroup could potentially be elastic as they might view the recreational experiences in different regional parks as substitutes (Dikgang and Muchapondwa Citation2017).Footnote5 However, if one considers the different categories of local and regional tourists visiting KNP, there is still scope for price discrimination given that most of the recreation demand in these two groups is driven by high-income earners. However, such a pricing policy may not be politically acceptable in the regional economic bloc.
The current study contributes to the literature in several ways. First, increasing the entrance fee is one way of capturing the money from the tourist’s budget that could be used elsewhere outside KNP given a huge consumer surplus and high propensity to spend. A recent study by Chidakel, Eb, and Child (Citation2020) notes that the KNP is less commercialized compared to the surrounding private game reserves (PGRs) in the Greater KNP region. Chidakel, Eb, and Child (Citation2020) find that the adjacent PGRs account for just 12% of the protected land area but over 60% of the economic contribution. Second, the paper determines the recreational value of the park to international tourists to demonstrate the economic value of the natural asset and put into perspective the necessary investments needed to preserve the park. Third, we use the Turnbull non-parametric method (Turnbull Citation1976), which is robust to distributional misspecification, to obtain an estimate of the WTP. The CVM literature tends to use only parametric regression models, which rely on specific distributional assumptions about the WTP. Fourth, WTP is often used to determine park entrance fees without demonstrating how park revenues will respond, as high entrance fees potentially reduce demand for the park. The current paper addresses this and demonstrates how to estimate corresponding park revenues if the bid response function is identified. Fifth, the paper estimates the potential revenue that the park can earn from recreational activities within the park, through increasing the entrance fees.Footnote6 Finally, the paper uses purposefully collected primary data in the context of a popular African park that is part of a transfrontier conservation area where such case studies are relatively few and the need for information to justify the value and existence of national parks is growing.
2. The study site
South Africa is known for its many national parks, which have a strong international appeal, enhanced by the diversity of wildlife to be seen, the high standard of the parks’ amenities, and the range of recreational activities available in the parks. KNP was established in 1898 to protect the wildlife of the South African lowveld. shows the map of KNP, entrance gates and main camps.
Figure 1. Kruger National Park. Source: https://www.safarinow.com/destinations/kruger-national-park/articles/kruger-national-park-map.aspx
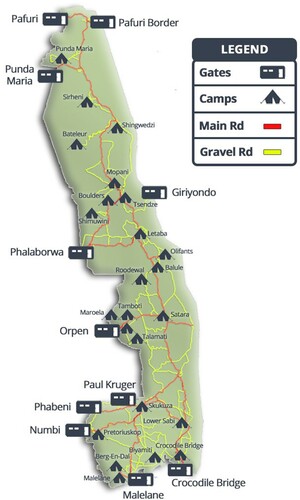
The park is the flagship of the South African National Parks (SANParks) agency, covers nearly 2 million hectares (SANParks Citation2015), and, together with Gonarezhou National Park in Zimbabwe and Limpopo National Park in Mozambique, is part of the Great Limpopo Transfrontier Conservation area. It offers a wildlife experience that can compete with the best parks in southern and eastern Africa and is popular among tourists for its big game sightings and large expanses of wilderness. What gives KNP a comparative advantage over other national parks in the region is that it is accessible even by small cars, has world-class restaurants, gift shops and lodges located at designated points inside the park. These factors, combined with big game sightings (particularly of the big five), make the experience in KNP less substitutable with that in other regional national parks. As a result, this also makes it possible to increase the revenues collected from international tourists at KNP without substantially affecting the park’s visitation rate, i.e. forcing visitors from other countries to visit other parks in Southern Africa rather than KNP.
Furthermore, KNP is significant for conservation as it is part of the Kruger to Canyons Biosphere, designated by the United Nations Educational, Scientific and Cultural Organization (UNESCO) as an International Man and Biosphere Reserve (UNESCO Citation2015). The park has developed a significant tourism profile over time with the number of visitors passing 1.89 million in 2018/19 (SANParks Citation2019b). As the park supports a variety of tourism-related economic activities in the surrounding areas, its value goes beyond conservation. For instance, a significant number of communities rely on KNP for income to fund community developmental projects and jobs since the area is located in an arid region where agricultural potential is limited (Saayman and Saayman Citation2006; Spenceley and Goodwin Citation2007; Tapela and Omara-Ojungu Citation1999). Despite the small size of the international tourist market relative to the domestic market, the international market is important because international tourist receipts account for a disproportionately greater share of total revenue than their share of total tourists (Dikgang and Muchapondwa Citation2017). This is not surprising, given that daily park entrance fees for international tourists are four times those for domestic tourists (SANParks Citation2020).
At present, SANParks receives state transfers equivalent to about 28% of its total expenditures, with the remainder of its income internally generated (SANParks Citation2019b). It is important to note that out of a total of 19 national parks managed by SANParks, KNP is one of only five currently generating a surplus (SANParks Citation2018b).Footnote7 The park is therefore not only important as an income source, given the current cross-subsidization of other financially unviable national parks, but also from a biodiversity conservation perspective. In addition, the recent sharp increase in poaching activities within the park has further increased pressure on the park’s financial resources.Footnote8 The importance of tourism for generating the resources needed for anti-poaching enforcement and conservation, in general, can therefore not be underestimated. Knowledge of potential revenue is crucial as it may help provide some justification for park managers seeking additional funding for conservation to revise park pricing. From an operational perspective, generating additional revenue implies that SANParks is able to finance a larger part, or even all, of its operational budget.
3. Methodology
Access to public recreational sites is usually subject to minimum user fees which are well below the willingness to pay of most site users (Krüger Citation2005; Lindsey et al. Citation2005). Lower user fees for domestic visitors can be partly due to moral concerns or fear that some segments of the society will be unfairly alienated from the market. While international visitors to KNP are already price discriminated and pay a higher fee, there is still an element of subsidization. This is because prices set by park agencies often do not reflect much deliberation at all and are often sub-optimal simply because there is not a strong incentive to adopt better policies, especially if the agency is being subsidized. This, however, makes estimating the true value of recreational sites from user fees inappropriate. Although our focus is on estimating the optimal entrance fees charged to international tourists, we acknowledge that the true value of a national park exceeds the price of a ticket as it fails to capture non-market values such as the option value, existence value and bequest value. It is however important to point out that knowledge of optimal park access fees in itself could provide information necessary to formulate a pricing strategy that might enable protected areas to finance their operations in the face of declining fiscal transfers from the State. The purpose of this analysis is therefore not to capture the comprehensive economic value of a park, but to provide information that park managers can use as guidance for a robust pricing policy.
One common approach taken in the literature to get the true value placed on a park by recreationists is to use CVM to estimate WTP. CVM entails asking respondents hypothetical questions regarding their WTP for a non-market good, or a good on which market forces are not acting optimally.Footnote9 The US National Oceanographic and Atmospheric Administration (NOAA) issued guidelines on the design of CVM studies and the reliability of CVM has been discussed comprehensively in the literature (see, for example, Arrow et al. Citation1993; Diamond and Hausman Citation1994; Hanemann Citation1994; Johnston et al. Citation2017).
Numerous CVM applications have been undertaken to elicit the recreational value of national parks in developing countries (see, for example, Chase et al. Citation1998; Dikgang and Muchapondwa Citation2012; Hadker et al. Citation1997; Lindsey et al. Citation2005; Moran Citation1994; Navrud and Mungatana Citation1994; Navrud and Vondolia Citation2005; Shultz, Pinazzo, and Cifuentes Citation1998). Tourists are typically asked if they would still consider visiting the park if the cost of their trip was US$t higher and the level of t varies across the respondents. This information, along with socio-economic characteristics of the respondents, is then used to calculate the WTP. In our case, we use the single bounded dichotomous choice contingent valuation method, in which recreationists are asked to accept or reject a suggested entrance fee hike under a hypothetical scenario.
The entrance fee is chosen as the appropriate payment vehicle since most users already pay a daily entrance fee to access the park. Given a proposed entrance fee hike, respondents have a choice of visiting or not visiting the park in the future. Individuals are assumed to be aware of the choice that maximizes their utility. The basic model for analyzing dichotomous contingent valuation responses is the random utility model. The utility that individual i receives from alternative j is given as
(1)
(1) where Vij is the deterministic indirect utility derived by individual i from choosing alternative j.
is an additive random error component of the utility function capturing components unobservable to the researcher. We assume that
is independently and identically distributed with mean zero. Let t be a specific entrance fee hike associated with KNP, which varies randomly across individuals. An individual will choose to visit KNP if the utility gain from KNP is at least greater than or equal to that from alternative park j:
(2)
(2) where Y is income and Zi is a vector of socio-economic characteristics affecting individual i’s preferences. If we assume that the deterministic part of the preference function is linear in income and in the covariates, the change in the deterministic utility is
(3)
(3) where
and μ denotes the marginal utility of income which is assumed to be the same for all individuals. With the deterministic part of preferences specified, the probability that an individual will accept a bid t becomes
where
. In order to estimate the parameters of the utility difference, the most common assumption about the nature of the random terms is that they follow either the normal distribution or the logistic distribution. If an individual answers yes to a proposed bid t, then we can infer that
. If they answer no, then
. This, however, limits the amount of information at our disposal.
4. Data collection
The survey makes use of closed-ended questions. Respondents are confronted with a simple yes/no decision as this results in a high participation rate by respondents (Arrow et al. Citation1993; Johnston et al. Citation2017). Given the limited time available, the importance of describing the scenario as concisely as possible cannot be overemphasized.Footnote10 Closed-ended questions also present the participants with a scenario similar to most real-life market transactions involving choices among sets of goods with listed prices offered on a take-it-or-leave-it basis (Freeman III, Herriges, and Kling Citation2014; Haab and McConnell Citation2002). The final version of the instrument used is informed by an earlier pilot held at KNP.
The survey was administered in July 2014. Given the size of the park, it was too costly to sample tourists in all the campsites. The park has eleven access points allowing entrance to the different camps (see ). We surveyed international visitors entering the park through five of these access points, namely Crocodile River, Malelane, Numbi, Paul Kruger, and Phabeni. These access points were carefully chosen, taking into consideration the various aspects of the park to achieve representativeness of the sample. Tourists entering through these access points normally stay at Berg-en-Dal, Crocodile Bridge, Lower Sabie, Pretoriuskop and Skukuza rest camps, all shown in . The Paul Kruger gate is the most popular entrance point for tourists, and those entering through this gate have access to many other nearby campsites and can therefore easily move around. Proximity to Kruger-Mpumalanga International Airport might also be important to some tourists and may affect the choice of entrance point.Footnote11 However, other than these considerations, we have no other reason to believe that tourists using the access points in our sample are any different from tourists entering through other access points. In addition, there is also no reason to believe that the touristic experience, once in the park, is a function of the access point used to the extent that the WTP would be affected in any way.
A team of interviewers trained by the authors randomly approached tourists daily at the different campsites of the park, usually after breakfast or lunch to minimize the disruption of participant’s activities. Visitors interviewed had spent at least a day in the park, and therefore had actual experience of the recreational activities. Potential respondents were briefly interviewed, mainly about their country of residence, and then asked to take the entire interview if they were not local or regional tourists. While the sampling was random, those who stayed longer had a greater chance of being sampled. The respondents were first made aware of the study through the following statement:
You have been randomly picked to complete this survey at Kruger National Park. South Africa is one of several African countries studying how to provide and pay for wildlife parks for the enjoyment of people from around the world. The answers you and others give in the survey will provide empirical information to the protected area managers, stakeholders and the government that will be used to establish better policies and programmes.
Suppose a new daily entrance fee (to cover management and anti-poaching) increases the cost of your trip by US$t per person for each day you spend at the Kruger. Therefore, the cost of your trip would increase by the number of nights you will spend in the Kruger times US$t. Thinking back to when you decided to take the trip, would you still choose the same trip with US$t cost higher per person? Yes/No.
To understand other important factors affecting WTP, we also collect data on socio-economic variables such as gender, age, income and educational level. The survey also included questions on the tourists’ views on wildlife protection (wildlife interest), number of days spent per trip and reported tour satisfaction. The variable gender is a dummy variable defined as 1 for males and zero for females, while age is measured on a continuous scale. The level of educational attainment is a categorical variable denoted by 1 for primary and high school, 2 for college certificate or diploma, 3 for undergraduate qualification and 4 for postgraduate degree. The variable wildlife interest ranks the views of the respondents about wildlife protection on a scale from 1 (not at all interested) to 7 (greatly interested). The tourist’s tour experience, tour satisfaction, is measured on a scale from 1 (much worse than expected) to 7 (much better than expected).Footnote13 The variable tour satisfaction also indirectly captures a number of site-specific characteristics such as wildlife diversity, tourism infrastructure, and accessibility. The variable package is a dummy variable controlling for whether the trip is part of a tour package or self-organized.
4.1. Descriptive statistics
shows the distribution of the bid responses. An important property is that individuals should be sensitive to the bid amount. From , as the bid is raised, the percentage of yes responses is decreasing in the level of the bid with the exception of the first bid. Only 45 percent said they would be willing to pay the highest amount ($90). confirms that our data is consistent with theoretical predictions and other empirical studies.
Table 1. Responses to bids (n = 377).
As can be seen in , the average number of days spent per trip is 3.35 with a standard deviation of 3.17. The descriptive statistics show that respondents expressed very high interest in wildlife conservation and reported very high levels of satisfaction. Theoretically, the very high interest in wildlife conservation and high levels of satisfaction with the tour should translate into a high WTP. About 65% of the respondents were on a tour package. This is expected, since trips of this nature are demanding in terms of planning, especially when the trip is for more than one person. Approximately 49% of the respondents were males, suggesting a gender-balanced sample. The average age in the sample is 40 years, and age ranged from 16 to 81 years. The sample had more respondents who had undergraduate and postgraduate degrees than with only primary, secondary school, or college certificates and diplomas. Respondents with undergraduate and postgraduate degrees tend to have higher incomes, allowing them to save towards expensive items such as an international trip (Vanslembrouck, Van Huylenbroeck, and Verbeke Citation2002). The mid-point of respondent income brackets is $95 557, with a standard deviation of $59 097.
Table 2. Descriptive statistics (n = 377).
Our sample contains respondents from 33 countries, with 20.2% of the respondents coming from the USA, 8% from the UK, 29.2% from Netherlands, 7.2% from Germany, 5% from Belgium, 5% from France and 4.5% from Australia. The rest are from the remaining 26 countries. These statistics are in line with the overall visitor statistics from SANParks.
5. Results
The purpose of this paper is to assess the potential of KNP to generate additional revenue in order to finance park operations. reports the results from the probit-based regression models. We report results from a univariate specification (Model 1) without any covariates except the bid and two multivariate specifications (Model 2 and 3) which includes socio-economic variables listed in . Since we have a private good and individuals can decide whether or not to visit the park, it is reasonable to restrict WTP to be non-negative. The models in are thus estimated using the logarithm of the bid thus restricting WTP to be positive (Haab and McConnell Citation2002). For all specifications, the coefficient of the logarithm of bid is negative and statistically significant indicating that the probability of accepting a bid is negatively correlated with the level of the bid. From our preferred specification which includes all the socio-economic variables (Model 3), we find a mean WTP ($88) that is about 16% higher than the median WTP ($76) an occurrence common in a log-bid model. The median WTP is usually preferable as it is less sensitive to skewed distributions and thus tends to generate conservative estimates of the aggregate WTP. The mean and median WTP are not that different across the three models. We calculate the median WTP for an average trip of 3.35 days to be $255 using estimates from Model 3. To calculate the aggregate WTP for international tourists, we multiply the estimated median WTP per trip by 368,399, the number of international tourists to KNP in 2014 when the survey was administered. This gives us an aggregate WTP of $94 million for Model 3.
Table 3. Estimates of probit regression coefficients and mean and median willingness to pay (WTP) derived from the coefficients.
In addition, as a robustness check, we estimate the same models (see in appendix) using the untransformed bid. As expected, the coefficient of the bid variable is negative and statistically significant at the 1% level in all our models. From our preferred specification which includes all the socio-economic variables (Model 3 in ), we find a mean WTP of $77 which is much lower to that from the models using the logarithm of the bid and very close to median WTP.
As an additional robustness check, we use the Turnbull nonparametric estimator (Turnbull Citation1976), proposed for CVM applications by Kriström (Citation1990) to estimate the mean WTP.Footnote14 While parametric regression models have the advantage that we can include other covariates in the regression model, the main advantage of the nonparametric model is that we do not have to make any assumptions about the distribution of the random component of the utility function or its functional form. The only necessary assumption is that the probability of accepting a $0 bid is 1 and the probability of accepting some high bid is zero. The Turnbull WTP is estimated to be $64 per person per day. The mean WTP from the Turnbull estimator is much lower than that from the probit regression models because the Turnbull estimator gives a lower bound to the WTP.
From , we note that the variables package and tour satisfaction have positive signs, as expected, and are statistically significant. Being on a tour package increases WTP, probably because of the assumed high-quality wildlife experience one receives on a guided compared to an unguided tour. The possibility of having the most enjoyable touristic experience is maximized on tours with a guide who is experienced. A high level of tour satisfaction is also associated with a high WTP. Wildlife interest does not appear to be relevant in explaining WTP, perhaps because many visitors to national parks (85% in our sample) already have high interest in wildlife conservation since the survey was implemented inside the park. The marginal effects give an indication of the magnitude of the various variables on the probability of accepting the proposed entrance fee hike. We also control for a number of socio-economic variables (age, gender, income, and educational level) in Model 3. There is no evidence that these socio-economic variables except income have a role in explaining WTP. However, the inclusion of these variables in the model might be necessary, given that the rest of the explanatory variables do not change their signs and level of significance, except for minor adjustments in the magnitude of the coefficients.
In order to estimate the revenue effects of the proposed entrance fee hikes, we consider a simple non-parametric survival function. The total revenues at different price increases are calculated as follows: where
is the total revenue associated with a particular bid amount t, N is the number of international visitors to the park in 2014, p is the current entrance fee ($23 at the time of the survey), RDAYS is the length of current trip and
is the probability of a yes to a particular bid.
shows estimates of the potential additional revenue from the non-parametric survival function at different entrance fees. We note that the revenue effects are large and the hypothetical entrance fee hikes will result in a revenue increase of between 86% and 120% over the baseline of 2014 entrance fee revenues from international tourists. An increase of $20 from the 2014 entrance fees, for example, would result in additional revenue of as much as $25 million per year. Given increasing park visits, an entrance fee hike will also help to manage congestion without reducing revenue to the park. We compute the additional revenue associated with an entrance fee of $64 (Turnbull estimator) and $76 (Model 3 in ) to be between $38 and $40 million per year, representing an increase of 56.7% to 60.8% of KNP’s 2015/2016 total revenue (17.9% to 19.1% for SANParks).Footnote15 It should however be noted that the actual entrance fee to charge is a policy question likely to depend on the goals of the policy makers. In , we also show the effect of the different entrance fees on the number of international tourists visiting the park. Increasing entrance fees to $63 would lead to a 16% decrease in the number of international tourists while revenue increases by 130% for example. Entrance fees above $83 are associated with larger decreases in tourist numbers and total revenue begins to fall in this price range.
Table 4. Estimated revenue effects.
6. Discussion
Sustainable nature-based tourism should not only help to conserve the natural environment but also provide direct income to residents residing in the vicinity of the park (Dikgang and Muchapondwa Citation2017; Dikgang, Muchapondwa, and Stage Citation2017; Mukanjari, Muchapondwa, and Demeke Citation2021). In Africa, the full market value of quasi-public goods like national parks is often underappreciated (Dikgang and Muchapondwa Citation2012; Muchapondwa, Carlsson, and Köhlin Citation2008). This study quantifies the recreational value of KNP from the perspective of international tourists. This helps demonstrate to authorities the value of the asset as natural capital and put into perspective the investments necessary to preserve the park. Furthermore, the results of this study have several implications for policy and park management, and these are also discussed.
The current estimation shows that the WTP values for future visits to KNP are considerably higher than the 2014 entrance fee of $23. We show that the WTP values for park entrance fees range from $64 for the nonparametric model to $76 for the probit-based models. The lower bound of our WTP for future access to the park is in line with results by Mukanjari, Muchapondwa, and Demeke (Citation2021) who use travel cost models and find the optimal daily entrance fee into KNP to be $60. This is also comparable to fees charged at similar African parks such as Amboseli National Park ($60), Maasai Mara National Park ($70) and Serengeti National Park ($60). Increasing entrance fees to this range could potentially increase annual revenues by $38 million to $40 million (about 56.9% to 60.8% of KNP’s 2015/2016 total revenue and 17.9% to 19.1% of SANParks’ 2015/2016 total revenue). If SANParks total revenues were to increase by 28%, the park agency would be able to cover its entire budget. Recreation demand by international tourists tends to be inelastic (Alpízar Citation2006; Pandit, Dhakal, and Polyakov Citation2015; Simões, Barata, and Cruz Citation2013), giving park agencies some scope to charge entrance fees above the current levels at popular parks.
If optimal entrance fees are adopted at all the popular national parks, SANParks will be able to generate a substantial surplus that could be used to subsidize less profitable projects within the popular parks and other protected areas across the country. The additional revenue could also be channelled towards both economic and social development of local communities around the parks. The debate about how local communities living adjacent to protected areas can benefit from conservation initiatives has been on the regional agenda for a long time given that local communities have been marginalized by policies and legislation meant to protect wildlife in addition to incurring the costs of living with wild animals (Ntuli et al. Citation2019; Swemmer et al. Citation2015). The need to incentivize local communities to participate in the wildlife economy through equitable benefit sharing arrangements and funding community projects is seen by many scholars and development practitioners as one way to address poaching and illegal wildlife trafficking (Duffy et al. Citation2016; Ntuli et al. Citation2021).
There is also increasing concern for the wellbeing of rangers and others working in the conservation space whose wages and salaries are still low compared to their counterparts in other sectors of the economy despite the risk they face on the job (SANParks Citation2018a). This has resulted in rangers accepting bribes to supplement their incomes in exchange for collaborating with poachers with severe negative consequences for the conservation of high-value species such as rhinos and elephants (Milliken, Shaw, and Emslie Citation2012). The surplus income from higher entrance fees can thus be used to increase salaries in addition to creating more employment for local people, which might, in turn, improve their perception of the protected areas. Furthermore, funding from the State in many African countries has been on the decline creating huge funding gaps as the governments focus on other people-oriented programmes and economic development of other sectors.
The high WTP among tourists reveals the extent of the potential surplus that could be captured by the park agency by setting entrance fees at the optimal level. If the park agency does not capture some of this surplus, as is the current case, it is unnecessarily sacrificing potential revenue crucial for funding conservation. However, some of the uncaptured surplus may end up being extracted by the private sector tourism players at the expense of the park agency. For example, restaurants, hotels and tour operators may overprice the complementary services that help enhance a tourist’s experience. Furthermore, since national parks are funded through the national treasury, charging lower entrance fees to foreign tourists also effectively implies directly subsidizing tourists from wealthy nations (Dikgang and Muchapondwa Citation2017).
Entrance fees for both domestic and foreign tourists are often set too low, which in turn translates into a perceived lower economic value for the park (Dikgang and Muchapondwa Citation2017; Naughton-Treves, Holland, and Brandon Citation2005). As most developing countries reduced their budget shares for conservation, the result was what economists refer to as the donor dependence syndrome, where park authorities rely on donor funds because they are unable to finance their own operations (Milne and Niesten Citation2009). This calls for a paradigm shift in the way that policymakers view conservation in general and wildlife in particular. Other studies suggest that price differentiation can be used as a conservation tool, where parks like the KNP, which experience high volumes of visitors, can increase their entrance fees to reduce traffic, thereby forcing visitors to consider other alternatives (Chase et al. Citation1998). It is therefore imperative, from a policy perspective, to understand the behavioural responses of tourists to increases in park entrance fees.
KNP is representative of a limited number of big national parks in southern and eastern Africa that are endowed with highly valuable wildlife and attract a large number of visitors (Van Der Merwe, Saayman, and Rossouw Citation2015). As a result, such parks possess high scarcity value and hence a high WTP among park visitors. The high WTP reported here also reflects the presence of a variety of natural and manmade attractions that jointly interact to determine the level of satisfaction derived by the recreationists. Since this study captures use values only, a full survey of park visitors and non-visitors would be needed to capture optional and existence values that form part of the total economic value. However, only the WTP for use values should be used in designing an appropriate entrance fee, as it includes users of the resource (Alpízar Citation2006; Dikgang and Muchapondwa Citation2017; Mulwa, Kabubo-Mariara, and Nyangena Citation2018). Should self-sufficiency become an appealing goal, the park can seek to charge an entrance fee such that the subsidy from the government eventually goes to zero over time. At present, self-sufficiency is not a stated objective for SANParks. The agency, however, aims to achieve financial sustainability by growing the percentage of revenue that is self-generated from a baseline of 72% in 2018/19 to 80% in 2023/24 (SANParks Citation2019a). Adopting such an objective, supported by an informed pricing policy, could enable the park agency to gain increasing independence given the greater policy autonomy that comes with increased financial autonomy (Laarman and Gregersen Citation1996). In addition, the park agency can have revenue maximization as an objective on its own. This is sensible, since recreational services when provided to a purely international clientele, cease to be a quasi-public good (Alpízar Citation2006; Dikgang and Muchapondwa Citation2017). Revenue maximization is therefore justifiable if KNP is considered to be similar to any other South African firm exporting its services abroad.
It should, however, be noted that charging higher entrance fees does not automatically translate into higher conservation (Dikgang and Muchapondwa Citation2017). There is a possibility that parks may still be underfunded even with higher entrance fees, especially in cases where the revenues are directed towards State coffers and for purposes other than conservation (Kideghesho Citation2016). The type of management structure needed to preserve funds for conservation is outside the scope of the current paper. Also, while restructuring of park entrance fees is one way of expropriating part of the surplus, other measures should not be ruled out by a disproportionate focus on entrance fees. Alternative sources of financing include concession fees, rental of facilities, accommodation, drive and trail fees, and retail activities (Laarman and Gregersen Citation1996; SANParks Citation2018a). A range of product lines should allow the park agency to extract most of the surplus that would otherwise accrue to concession owners, and other players in the tourism sector, or would remain with the tourists themselves. In addition, close cooperation with other players in the tourism sector can help uncover new revenue sources that might not otherwise have been viable.
The widespread underpricing of national park entrance fees for international tourists by park agencies often reflect little deliberation with entrance fees frequently sub-optimal since there are few incentives to adopt better policies. Usually, this is due to the fact that many park agencies receive State subsidies. Recent literature suggests varying degrees of underpricing. Mulwa, Kabubo-Mariara, and Nyangena (Citation2018) calculate a daily entrance fee of $87 for Maasai Mara National Park in Kenya, about 9% higher than the existing entrance fee of $80 at the time. Bruner et al. (Citation2015) found that international tourists in Tanzania are willing to pay significantly higher entrance fees to the Serengeti National Park without any significant impact on the number of visitors. Their study did not recommend fee increases at Kilimanjaro National Park, because visitors perceive the current prices to be too high, but smaller increases were recommended for other parks. Dikgang, Muchapondwa, and Stage (Citation2017) estimate the revenue-maximizing daily fee for Kgalagadi Transfrontier Park (KTP) at $144, compared with $23 at the time. According to Dikgang and Muchapondwa (Citation2017), the underpricing of entrance fees at KTP is not limited to international tourists. They estimate that maximizing revenue requires locals to pay at least twice the current fee. In Nepal and Indonesia, similar patterns have been observed (Baral, Stern, and Bhattarai Citation2008; Walpole, Goodwin, and Ward Citation2001). The available studies suggest that charging higher entrance fees to popular recreational places does not significantly affect visits. Even the much higher fees for Mountain Gorilla tracking in the Virunga National Park (Parc National des Virunga) in the Democratic Republic of Congo (DRC), the Mgahinga Gorilla National Park in Uganda, the Volcanoes National Park (Parc National des Volcans) in Rwanda and the Bwindi Impenetrable National Park (BINP) in south-west Uganda have not reduced visitors.Footnote16 As far as we know, entrance fee hikes have not backfired. The reason for this is usually because authorities are often conservative and do not always adopt the full increments that are recommended. However, we recommend broad consultation with stakeholders before any fee increments are made. In parks managed by SANParks, annual reviews are already the norm when it comes to implementing price increases. Fee increases can be phased in until the full increment is reached.Footnote17 In this way, the authority can immediately notice any negative effects.
7. Conclusion
This paper set out to estimate the WTP for international tourists visiting KNP, as well as the potential revenue that KNP could raise from recreational activities within the park estate through an increase in entrance fees. We find that there is a high WTP among international tourists for future visits to the park. The WTP ranges from $64 to $76 per day. If the park can raise entrance fees to within this range, they would gain additional revenue of $38 million to $40 million per year. These results provide some guidance on the appropriate level of entrance fees needed to raise additional revenue to support conservation and park management. Appropriate pricing will enable KNP to generate a much larger surplus, which is essential for the cross-subsidization of less sustainable but ecologically important parks or to support revenue-sharing schemes with adjacent local communities.
Entrance fees that reflect the scarcity value of the park estate help maximize the benefit from such resources, while at the same time reducing dependence on State transfers. The current regime of low entrance fees only helps to maximize the consumer surplus of international tourists. Park managers should therefore seek to exploit the revenue potential of popular parks within their portfolios fully. Even though many park agencies in developing countries have not demonstrated an appetite to maximize the revenue from entrance fees over the past decades, the recent cuts in fiscal transfers in many countries in Africa require park agencies to consider revenue maximization if conservation is not to suffer.
It is also important to note that there are other aspects that need to be considered further. These include substitution among parks, the effect of higher fees on the length of the visit, and the possibility of unintended negative effects on businesses near the park. In addition, some parks may not generate excess revenue, let alone cover conservation costs, even with a well-crafted pricing policy. For the popular national parks, the focus should therefore be on charging entrance fees that make the surplus from those parks as large as possible to facilitate cross-subsidization of other, less popular, parks that may contain important biodiversity.
Acknowledgements
For helpful comments and discussions, we thank participants at the 26th Annual Conference of the European Association of Environmental and Resource Economists. We also benefited from insights by Gardner Brown, Jr., Fredrik Carlsson and David F. Layton during the initial stages of the project. We thank Gerald Kibira, Stephen Kirama, Amanda Musandiwa, Realeboga Ngwanaeng and Nomsa Nkosi for assistance with the fieldwork and grateful to Joep Stevens of SANParks (South African National Parks) for assistance with data.
Disclosure statement
No potential conflict of interest was reported by the authors.
Additional information
Funding
Notes
1 Knowledge about the revenue potential of national parks is also crucial for ascertaining the value of national parks.
2 Regional tourists are classified as those coming from the 15 Southern African Development Community countries.
3 Whether it is also possible to generate additional revenue from domestic tourists is an empirical question that needs to be investigated.
4 According to KNP gate arrivals data, international tourists from overseas comprised 22.3% of total tourists visiting KNP in 2014, while domestic and regional tourists made up the remaining 75.9% and 1.8%, respectively. Regional tourists pay twice the R70 tariff levied on local residents at the time of the survey, while all other nationalities pay an entrance fee of R248 (equivalent to $23 at the time of the survey).
5 Ordinarily, the activities and experiences offered by the different parks differ with respect to developments inside the parks but not in terms of the variety of wildlife species they offer.
6 In using the mean/median WTP to estimate revenue, we also take into account the fact that revenues depend on the number of people visiting the park.
7 The other parks generating a surplus are Addo Elephant National Park, Augrabies Falls National Park, Kgalagadi Transfrontier Park and Table Mountain National Park (SANParks refers to the following as Table Mountain: Boulders, Cape of Good Hope, Newlands, Ouderkraal, Silvermine and Tokai Picnic & Braai Area. The Cableway and Kirstenbosh are independently operated) (SANParks Citation2018b).
8 The KNP recorded a decrease in rhino poaching by 23.6% (from 502 to 384) and elephant poaching by 35% in 2018/2019 versus the previous year, but poaching activity remained at 2460 (7 poaching activities per day) over the two years. The decline in poached animals has been largely attributed to increased anti-poaching activities, which have led to more arrests (233 poachers were arrested in 2018/2019 versus 190 the previous year). Despite this, the intent to poach remains strong (SANParks Citation2019b).
9 Data for contingent valuation studies is mostly gathered using on-site surveys, as on-site surveys guarantee sampling users of the recreational site in question. This, however, makes it rather difficult to estimate comprehensively the WTP for other important values of the park, such as optional and existence values, which are normally measured from the point of view of both users and non-users of the park (Garrod and Willis Citation1997; Pearse Citation1968).
10 Parsons (Citation2003) recommends sampling visitors when they depart the recreational site. However, it was not possible to implement this since the majority of international visitors are on guided tours and there is therefore little time to interview them when they are leaving the park.
11 The Skukuza camp also has a small airport, making it more accessible than some of the others.
12 The use of electronic gadgets to collect data made it easy to present the fee hikes in the respondents’ own country’s currency, thus helping respondents to relate to the magnitude of the proposed hike easily. The entrance fee hike was presented in eight different major currencies. The currencies were chosen based on KNP historical gate entrance data. This unique feature of the survey enabled us to elicit valid responses and, to the best of our knowledge, is relatively new in this literature.
13 For the purposes of the analysis of this variable and also the variable wildlife interest, we combine the first five categories into a single category as they have fewer observations in them.
14 The Turnbull estimator was proposed much earlier by Ayer et al. (Citation1955). For other earlier applications, see also Carson, Wilks, and Imber (Citation1994).
15 SANParks adopted segment reporting during the 2015/2016 financial year. Revenues for KNP were not published prior to that.
16 Currently, a one-hour permit for tracking Mountain Gorillas costs $400 in Congo, $700 in Uganda, and $1500 in Rwanda.
17 SANParks has adjusted entrance fees by about 9% annually since 2009. However, these changes are in the local currency and barely compensate for inflation and adverse changes in the exchange rate. Thus, international tourists see little impact.
References
- Alpízar, F. 2006. “The Pricing of Protected Areas in Nature-Based Tourism: A Local Perspective.” Ecological Economics 56 (2): 294–307.
- Andam, K. S., P. J. Ferraro, K. R. Sims, A. Healy, and M. B. Holland. 2010. “Protected Areas Reduced Poverty in Costa Rica and Thailand.” Proceedings of the National Academy of Sciences 107 (22): 9996–10001.
- Arrow, K., R. Solow, P. R. Portney, E. E. Leamer, R. Radner, and H. Schuman. 1993. “Report of the NOAA Panel on Contingent Valuation.” Federal Register 58 (10): 4601–4614.
- Ayer, M., H. D. Brunk, G. M. Ewing, W. T. Reid, and E. Silverman. 1955. “An Empirical Distribution Function for Sampling with Incomplete Information.” Annals of Mathematical Statistics 26 (4): 641–647.
- Baral, N., M. J. Stern, and R. Bhattarai. 2008. “Contingent Valuation of Ecotourism in Annapurna Conservation Area, Nepal: Implications for Sustainable Park Finance and Local Development.” Ecological Economics 66 (2): 218–227.
- Borie, M., R. Mathevet, A. Letourneau, I. Ring, J. D. Thompson, and P. Marty. 2014. “Exploring the Contribution of Fiscal Transfers to Protected Area Policy.” Ecology and Society 19 (1): 9. http://doi.org/10.5751/ES-05716-190109.
- Bruner, A., B. Kessey, J. Mnaya, J. Wakibara, and J. Maldonado. 2015. Tourists’ Willingness to pay to Visit Tanzania’s National Parks: A Contingent Valuation Study. Washington, DC: Conservation Strategy Fund.
- Carson, R. T., L. Wilks, and D. Imber. 1994. “Valuing the Preservation of Australia's Kakadu Conservation Zone.” Oxford Economic Papers 46: 727–749.
- Chase, L. C., D. R. Lee, W. D. Schulze, and D. J. Anderson. 1998. “Ecotourism Demand and Differential Pricing of National Park Access in Costa Rica.” Land Economics 74 (4): 466–482.
- Chidakel, A., C. Eb, and B. Child. 2020. “The Comparative Financial and Economic Performance of Protected Areas in the Greater Kruger National Park, South Africa: Functional Diversity and Resilience in the Socio-Economics of a Landscape-Scale Reserve Network.” Journal of Sustainable Tourism 28 (8): 1100–1119.
- Child, K. 2017. “Big Budget Cuts at Game Parks will Badly Hinder Antipoaching Efforts.” Business Day. Accessed 30 October 2017. https://www.businesslive.co.za/bd/national/science-and-environment/2017-04-18-big-budget-cuts-at-game-parks-will-badly-hinder-antipoaching-efforts/.
- Diamond, P. A., and J. A. Hausman. 1994. “Contingent Valuation: Is Some Number Better Than No Number?” Journal of Economic Perspectives 8 (4): 45–64.
- Dikgang, J., and E. Muchapondwa. 2012. “The Valuation of Biodiversity Conservation by the South African Khomani San “Bushmen” Community.” Ecological Economics 84: 7–14.
- Dikgang, J., and E. Muchapondwa. 2017. “The Determination of Park Fees in Support of Benefit Sharing in Southern Africa.” Tourism Economics 23 (6): 1165–1183.
- Dikgang, J., E. Muchapondwa, and J. Stage. 2017. “Securing Benefits for Local Communities from International Visitors to the Kgalagadi Transfrontier Park.” Tourism Economics 23 (8): 1553–1567.
- Duffy, R., F. A. St John, B. Büscher, and D. Brockington. 2016. “Toward a new Understanding of the Links Between Poverty and Illegal Wildlife Hunting.” Conservation Biology 30 (1): 14–22.
- Freeman III, A. M., Herriges, J. A., & Kling, C. L. (2014). The Measurement of Environmental and Resource Values: Theory and Methods. 3rd ed. Abingdon, Oxon: RFF Press.
- Garrod, G. D., and K. G. Willis. 1997. “The Non-Use Benefits of Enhancing Forest Biodiversity: A Contingent Ranking Study.” Ecological Economics 21 (1): 45–61.
- Haab, T. C., and K. E. McConnell. 2002. Valuing Environmental and Natural Resources: The Econometrics of Non-Market Valuation. Northampton, MA: Edward Elgar Publishing.
- Hadker, N., S. Sharma, A. David, and T. Muraleedharan. 1997. “Willingness-to-Pay for Borivli National Park: Evidence from a Contingent Valuation.” Ecological Economics 21 (2): 105–122.
- Hanemann, W. M. 1994. “Valuing the Environment Through Contingent Valuation.” Journal of Economic Perspectives 8 (4): 19–43.
- Herriges, J., C. Kling, C.-C. Liu, and J. Tobias. 2010. “What are the Consequences of Consequentiality?” Journal of Environmental Economics and Management 59 (1): 67–81.
- Hwari, T. 2017. “Govt Stops ZimParks Funding.” Herald. Accessed 30 October 2017. https://www.herald.co.zw/govt-stops-zimparks-funding/.
- Johnston, R. J., K. J. Boyle, W. Adamowicz, J. Bennett, R. Brouwer, T. A. Cameron, W. M. Hanemann, et al. 2017. “Contemporary Guidance for Stated Preference Studies.” Journal of the Association of Environmental and Resource Economists 4 (2): 319–405.
- Kideghesho, J. R. 2016. “The Elephant Poaching Crisis in Tanzania: A Need to Reverse the Trend and the Way Forward.” Tropical Conservation Science 9 (1): 369–388.
- Köhlin, G. 2001. “Contingent Valuation in Project Planning and Evaluation: The Case of Social Forestry in Orissa, India.” Environment and Development Economics 6 (2): 237–258.
- Kriström, B. 1990. “A non-Parametric Approach to the Estimation of Welfare Measures in Discrete Response Valuation Studies.” Land Economics 66 (2): 135–139.
- Krüger, O. 2005. “The Role of Ecotourism in Conservation: Panacea or Pandora’s Box?” Biodiversity & Conservation 14 (3): 579–600.
- Laarman, J. G., and H. M. Gregersen. 1996. “Pricing Policy in Nature-Based Tourism.” Tourism Management 17 (4): 247–254.
- Lee, C. K., and J. W. Mjelde. 2007. “Valuation of Ecotourism Resources Using a Contingent Valuation Method: The Case of the Korean DMZ.” Ecological Economics 63 (2–3): 511–520.
- Lindsey, P. A., R. R. Alexander, J. T. Du Toit, and M. Mills. 2005. “The Potential Contribution of Ecotourism to African Wild dog Lycaon pictus Conservation in South Africa.” Biological Conservation 123 (3): 339–348.
- Lindsey, P. A., V. R. Nyirenda, J. I. Barnes, M. S. Becker, R. McRobb, C. J. Tambling, W. A. Taylor, F. G. Watson, and M. t’Sas-Rolfes. 2014. “Underperformance of African Protected Area Networks and the Case for New Conservation Models: Insights from Zambia.” PLoS ONE 9 (5): e94109.
- Milliken, T., J. Shaw, and R. H. Emslie. 2012. The South Africa-Vietnam Rhino Horn Trade Nexus: A Deadly Combination of Institutional Lapses, Corrupt Wildlife Industry Professionals and Asian Crime Syndicates. Johannesburg: TRAFFIC.
- Milne, S., and E. Niesten. 2009. “Direct Payments for Biodiversity Conservation in Developing Countries: Practical Insights for Design and Implementation.” Oryx 43 (4): 530–541.
- Moran, D. 1994. “Contingent Valuation and Biodiversity: Measuring the User Surplus of Kenyan Protected Areas.” Biodiversity & Conservation 3 (8): 663–684.
- Muchapondwa, E., F. Carlsson, and G. Köhlin. 2008. “Wildlife Management in Zimbabwe: Evidence from a Contingent Valuation Study.” South African Journal of Economics 76 (4): 685–704.
- Mukanjari, S., E. Muchapondwa, and E. Demeke. 2021. “Recreation Demand and Pricing Policy for International Tourists in Developing Countries: Evidence from South Africa.” Journal of Environmental Economics and Policy 10 (3): 243–260.
- Mulwa, R., J. Kabubo-Mariara, and W. Nyangena. 2018. “Recreational Value and Optimal Pricing of National Parks: Lessons from Maasai Mara in Kenya.” Journal of Environmental Economics and Policy 7 (2): 204–222.
- Naughton-Treves, L., M. B. Holland, and K. Brandon. 2005. “The Role of Protected Areas in Conserving Biodiversity and Sustaining Local Livelihoods.” Annual Review of Environment and Resources 30: 219–252.
- Navrud, S., and E. Mungatana. 1994. “Environmental Valuation in Developing Countries: The Recreational Value of Wildlife Viewing.” Ecological Economics 11 (2): 135–151.
- Navrud, S., and G. K. Vondolia. 2005. “Using Contingent Valuation to Price Ecotourism Sites in Developing Countries.” Tourism 53 (2): 115–125.
- Nkala, O. 2017. “Botswana Budget Cuts Imperil Anti-Poaching.” Conservation Action Trust. Accessed 30 October 2017. https://conservationaction.co.za/media-articles/botswana-budget-cuts-imperil-anti-poaching/.
- Ntuli, H., S. C. Jagers, A. Linell, M. Sjöstedt, and E. Muchapondwa. 2019. “Factors Influencing Local Communities’ Perceptions Towards Conservation of Transboundary Wildlife Resources: The Case of the Great Limpopo Trans-Frontier Conservation Area.” Biodiversity and Conservation 28 (11): 2977–3003.
- Ntuli, H., A. Sundström, M. Sjöstedt, E. Muchapondwa, S. C. Jagers, and A. Linell. 2021. “Understanding the Drivers of Subsistence Poaching in the Great Limpopo Transfrontier Conservation Area: What Matters for Community Wildlife Conservation?” Ecology and Society 26 (1): 18. https://doi.org/10.5751/ES-12201-260118.
- Pandit, R., M. Dhakal, and M. Polyakov. 2015. “Valuing Access to Protected Areas in Nepal: The Case of Chitwan National Park.” Tourism Management 50: 1–12.
- Parsons, G. R. 2003. “The Travel Cost Model.” In A Primer on Nonmarket Valuation, edited by Patricia A. Champ, Kevin J. Boyle, and Thomas C. Brown, 269–329. Dordrecht: Springer Netherlands.
- Pearse, P. H. 1968. “A New Approach to the Evaluation of Non-Priced Recreational Resources.” Land Economics 44 (1): 87–99.
- Saayman, M., and A. Saayman. 2006. “Estimating the Economic Contribution of Visitor Spending in the Kruger National Park to the Regional Economy.” Journal of Sustainable Tourism 14 (1): 67–81.
- Sable, K. A., and R. W. Kling. 2001. “The Double Public Good: A Conceptual Framework for “Shared Experience” Values Associated with Heritage Conservation.” Journal of Cultural Economics 25 (2): 77–89.
- Shultz, S., J. Pinazzo, and M. Cifuentes. 1998. “Opportunities and Limitations of Contingent Valuation Surveys to Determine National Park Entrance Fees: Evidence from Costa Rica.” Environment and Development Economics 3 (1): 131–149.
- Simões, P., E. Barata, and L. Cruz. 2013. “Using Count Data and Ordered Models in National Forest Recreation Demand Analysis.” Environmental Management 52 (5): 1249–1261.
- South African National Parks (SANParks). 2012. “South African National Parks Strategic Plan for 2012/13–2016/17.” Accessed 13 August 2020. https://www.sanparks.org/assets/docs/about/5_year_strategic_plan_2012-2013_to_2016-2017.pdf.
- South African National Parks (SANParks). 2015. “Kruger National Park.” Accessed 14 January 2015. http://www.sanparks.org/parks/kruger/default.php.
- South African National Parks (SANParks). 2018a. 2017/2018 Annual Report.” Accessed 9 September 2018. https://www.sanparks.org/assets/docs/general/annual-report-2018.pdf.
- South African National Parks (SANParks). 2018b. “Kruger National Park Management Plan 2018–2028.” Accessed 13 August 2020. https://www.sanparks.org/assets/docs/conservation/park_man/knp/draft-plan.pdf.
- South African National Parks (SANParks). 2019a. “5-Year Strategic Plan 2019/20 - 2023/24 & Annual Performance Plan 2019/20.” Accessed 13 August 2020. https://www.sanparks.org/assets/docs/about/annual_performance_plan_2019-2020.pdf.
- South African National Parks (SANParks). 2019b. “2018/2019 Annual Report.” Accessed 7 November 2020. https://www.sanparks.org/assets/docs/general/annual-report-2019.pdf.
- South African National Parks (SANParks). 2020. “Conservation Fees - 1 November 2020 to 30 October 2021.” Accessed 12 December 2020. https://www.sanparks.org/docs/tourism_tariffs/daily_conservation_fees_2020_21.pdf.
- Spenceley, A., and H. Goodwin. 2007. “Nature-based Tourism and Poverty Alleviation: Impacts of Private Sector and Parastatal Enterprises in and Around Kruger National Park, South Africa.” Current Issues in Tourism 10 (2–3): 255–277.
- Swemmer, L., R. Grant, W. Annecke, and S. Freitag-Ronaldson. 2015. “Toward More Effective Benefit Sharing in South African National Parks.” Society & Natural Resources 28 (1): 4–20.
- Tapela, B. N., and P. H. Omara-Ojungu. 1999. “Towards Bridging the gap Between Wildlife Conservation and Rural Development in Post-Apartheid South Africa: The Case of the Makuleke Community and the Kruger National Park.” South African Geographical Journal 81 (3): 148–155.
- Trimble, M. J., and R. J. Van Aarde. 2014. “Supporting Conservation with Biodiversity Research in Sub-Saharan Africa’s Human-Modified Landscapes.” Biodiversity and Conservation 23 (9): 2345–2369.
- Turnbull, B. W. 1976. “The Empirical Distribution Function with Arbitrarily Grouped, Censored and Truncated Data.” Journal of the Royal Statistical Society. Series B (Methodological) 38 (3): 290–295.
- United Nations Educational Scientific and Cultural Organization (UNESCO). 2015. “Kruger to Canyon Biosphere Reserve, South Africa.” Accessed 14 January 2016. https://en.unesco.org/biosphere/africa/kruger-to-canyon.
- Van Der Merwe, P., M. Saayman, and R. Rossouw. 2015. “The Economic Impact of Hunting in the Limpopo Province.” Journal of Economic Financial Sciences 8 (1): 223–242.
- Vanslembrouck, I., G. Van Huylenbroeck, and W. Verbeke. 2002. “Determinants of the Willingness of Belgian Farmers to Participate in Agri-Environmental Measures.” Journal of Agricultural Economics 53 (3): 489–511.
- Vossler, C. A., and S. B. Watson. 2013. “Understanding the Consequences of Consequentiality: Testing the Validity of Stated Preferences in the Field.” Journal of Economic Behavior & Organization 86: 137–147.
- Walpole, M. J., H. J. Goodwin, and K. G. Ward. 2001. “Pricing Policy for Tourism in Protected Areas: Lessons from Komodo National Park, Indonesia.” Conservation Biology 15 (1): 218–227.
Appendix
Table A1. Estimates of probit regression coefficients and mean willingness to pay (WTP) derived from the coefficients.
Note: For models with untransformed bid as a covariate, the mean and median WTP are given as where
is the regression coefficient of the bid variable. The standard errors of the WTP estimates are calculated using the delta method and given in parentheses.
* p < 0.10, ** p < 0.05, *** p < 0.01.