Abstract
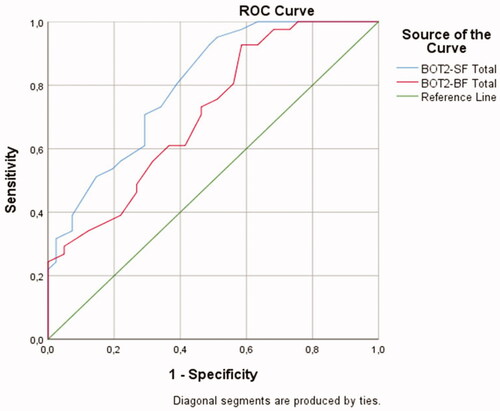
The aim of our study was to determine the sensitivity and specificity levels of BOT2-BF and BOT2-SF tests applied to children with developmental dyslexia and to examine their clinical usability. This study was designed as a case-controlled study. 82 (study group 41, control group 41) 7–12 year children were included. The study occurred three stages. In the first place, the similarities and differences of BOT2-BF and BOT2-SF tests observed in clinical practices were examined by taking the feedback of experts and test correlations. In the second step, BOT2-BF and BOT2-SF tests were examined with reference to the Core Outcome Set (COS) evaluation criteria. In the last step, in order to examine the sensitivity and specificity levels of the tests, assessments were performed in two groups with 1-week intervals. According to the COS results, the BOT2-BF test was examined better than the BOT2-SF test under cross-cultural validity title. The sensitivity and specificity of BOT2-SF were 0.92 and 0.51, and for BOT2-BF were 0.92 and 0.41, respectively. This study will help clinicians working on children with developmental dyslexia to decide the type of test they will use to evaluate and easy access to materials motor proficiency.
Acknowledgments
Prior to the study, special allowance of the Ethics Committee of Health Sciences University board number 2020-106 was initially taken and every child and his/her legal guardian were requested to grant their written informed consent within the framework of Helsinki Declaration.
We would like to thank Ege Temizkan OT., MSc. for the language editing and proof reading of our study.
Disclosure statement
No potential conflict of interest was reported by the author(s).
Figure 1. ROC curve graphic.