
Abstract
Aims/hypothesis: Regional deposition of adipose tissue and adipocyte morphology may contribute to increased risk for insulin resistance. The aim of this study was to compare adipocyte cell size and size distribution from multiple fat depots and to determine the association with type 2 diabetes mellitus, anthropomorphic data, and subjects' metabolic profile.
Methods: Clinical data and adipose tissue from subcutaneous fat, omentum, and mesentery were collected from 30 subjects with morbid obesity. Adipocytes were isolated by collagenase digestion and sized by microscopic measurement of cell diameter.
Results: Overall, adipocytes from subcutaneous fat were larger than those from omentum or mesentery. For the subcutaneous and omental fat depots, there was a significant increase in % small cells (14.9% vs 31.4%, p = 0 .006 and 14.0% vs 30.5%, p = 0 .015, respectively) and corresponding decrease in % large cells for nondiabetic vs diabetic patients. There was a similar trend for mesentery but it did not reach statistical significance (p = 0 .090). For omentum and mesentery, there was also a significant decrease in the diameter of the small cells. Fasting glucose was positively correlated with fraction of small cells in omentum and mesentery, and HbA1C was positively correlated with fraction of small cells in the omental fat depot. There was no correlation between large cell diameter with clinical parameters in any of the fat depots.
Conclusions/interpretation: These results indicate size distribution of adipocytes, specifically an increase in the fraction of small cells, is associated with the presence of type 2 diabetes mellitus.
Abbreviations
| BMI | = | body mass index |
| DMEM | = | Dulbecco's Modified Eagle Medium |
| HbA1c | = | hemoglobin A1c |
| HOMA-IR | = | homeostasis model assessment-estimated insulin resistance |
Introduction
Obesity is an epidemic having tremendous medical and socioeconomic impact.Citation1 It is associated with an increased risk of type 2 diabetes mellitus, metabolic syndrome, cardiovascular disease, and cancer.Citation2-6 The mechanism by which obesity promotes dysmetabolism is not fully understood, but the literature implicates adipose tissue itself in the pathophysiology. No longer regarded simply as a storage depot, fat is now appreciated as a dynamic organ secreting adipocytokines that act both locally and systemically to modulate energy homeostasis, insulin resistance, and the inflammatory state.Citation7-8 The contribution of adipose tissue to insulin resistance may involve adipocyte dysfunction in morphology, adipocytokine secretion, or metabolism. Previous studies have indicated that increased size of subcutaneous adipocytes predicts the development of insulin resistance and type 2 diabetes mellitus, and that their size is negatively correlated with insulin sensitivity and positively correlated with proinflammatory adipocytokine secretion.Citation9-13 Further, enlarged fat cells have increased glucose metabolism but insulin-stimulated glucose metabolism is negatively correlated with adipocyte size.Citation14-15 Large adipose cells have increased lipolysis.Citation16 Recent reports have demonstrated that insulin resistance and the expression of adipogenesis and inflammatory genes are associated with the size distribution of subcutaneous adipocytes, specifically an increase in the fraction of small cells and not with the mean diameter of large cells. Citation17-18
Although subcutaneous fat is the most well-studied adipose tissue depot in humans, visceral adiposity is highly associated with increased insulin resistance and metabolic syndrome.Citation19-24 Visceral fat is more metabolically active than the subcutaneous fat depot, and the association of visceral fat to metabolic syndrome is thought to be mediated by its proinflammatory activity and drainage into the portal vein.Citation22,25-28 Omentum and mesentery are 2 components of visceral fat. Omentum is the fatty apron attached to the greater curvature of the stomach and mesentery is the fat containing the arteries and veins supplying the small and large intestine. Although there is emerging data that mesentery has a distinct role in insulin resistance separate from omentum, there is a relative paucity of published data due to the difficulty in obtaining this tissue.Citation29-30 Indeed most studies of visceral adipose tissue are comprised solely of omentum.Citation27,28,31-33
Given the above, we studied adipocytes isolated from 3 different fat depots: subcutaneous fat, omentum, and mesentery. We investigated, 1) adipocyte cell size and distribution, 2) differences in adipocyte cell size and distribution in the 3 fat depots in nondiabetic vs diabetic subjects, and 3) the relationship between adipocyte cell size and distribution and subjects' anthropomorphic data and metabolic profile. To our knowledge, this is the first study of adipocyte cell size and distribution in these 3 fat depots as well as the first study of these 3 fat depots in subset analysis based on diabetes status.
Results
Thirty patients consented to the study and underwent adipose tissue biopsies. Of these 30 patients, 15 patients had type 2 diabetes mellitus while 15 did not (). As expected since the subjects were stratified based on diabetes status, there was a significant difference between the 2 groups in fasting glucose and HbA1C (p = 0 .005 and p = 0 .001, respectively). There were no other statistically significant differences between the 2 groups in demographics or clinical characteristics.
Table 1. Demographic and clinical characteristicsa
The distribution of all cells was essentially bimodal, with 2 separate populations of smaller and larger cells (). When data were stratified based on the diabetic status of the subject, there was no statistical difference in the mean diameter of the large cells (p = 0 .681). However, there was a significant decrease in the mean diameter of the small cells (42.1 μm vs 35.4 μm, p = 0 .013) and a significant increase in the fraction of small cells (14.4% vs 28.5%, p = 0 .001, respectively) with a corresponding decrease in the fraction of large cells in the nondiabetic vs diabetic patients. This was true in the unadjusted analyses as well as when the data were adjusted for age, sex, race, and BMI ().
Table 2. Adipocyte size of different fat depots in nondiabetic and diabetic subjectsa
Figure 1. Adipocyte cell size distribution from the total population of cells (A, B) and analyzed by the 3 different fat depots (C-H) in nondiabetic (dashed line) and diabetic (solid line) patients (B, D, F, H). Sc, subcutaneous fat (C, D); Om, omentum (E, F); and Mes, mesentery (G, H).
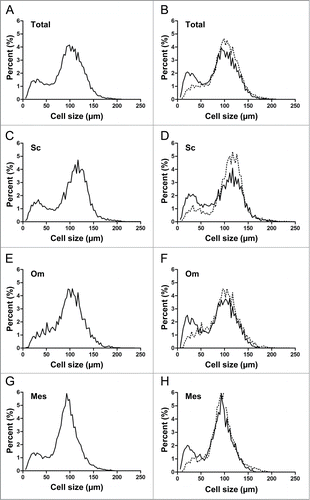
When data were stratified based on fat depot, adipocytes from subcutaneous fat tended to be larger than those from omentum and were significantly larger than from mesentery (98.5 μm vs 88.8 μm, p = 0 .100 and 86.7 μm, p = 0 .036, respectively). The large cell diameter was significantly greater in subcutaneous fat than for both omentum and mesentery (115.7 μm vs 103.8 μm, p = 0 .004 and 98.6 μm, P < 0.001, respectively). There was no significant difference among the 3 fat depots for small cell diameter or % small or large cells.
The cell size and distribution of each fat depot was also analyzed based on diabetic status of the patient ( and ). For subcutaneous fat, there was a significant difference in mean cell size in nondiabetic vs diabetic subjects (105.7 mm vs 91.2 mm, p = 0 .015). There was no significant difference in large or small cell diameter. For omentum and mesentery, there was a trend toward larger adipocytes in nondiabetic vs diabetic subjects in both unadjusted (p = 0 .093 and 0.086, respectively) and adjusted analyses (p = 0 .100 and p = 0 .060, respectively). For both of these fat depots, there was a significant decrease in the diameter of the small cells in the diabetic patients (43.1 μm vs 33.9 μm, p = 0 .024 and 41.6 μm vs 32.9 μm, p = 0 .002, respectively). For the subcutaneous and omental fat depots, there was a significant increase in % small cells (14.9% vs 31.4%, p = 0 .006 and 14% vs 30.5%, p = 0 .015, respectively) and corresponding decrease in % large cells for diabetic vs nondiabetic patients. This remained significant in adjusted analysis for both subcutaneous fat and omentum (p = 0 .021 and p = 0 .043, respectively). There was a similar trend for mesentery but it did not reach statistical significance in unadjusted or adjusted analysis (p = 0 .090 and p = 0 .058, respectively).
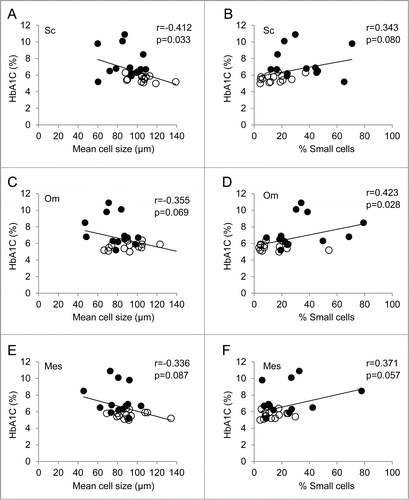
The data were next analyzed by anthropomorphic measurements. There was no significant correlation in any of the measurements of fat depot cell size and distribution with BMI, waist circumference, or waist-hip ratio. There was no correlation between any of these with mean cell diameter of small or large cells in any of the fat depots. Regarding clinical parameters, there was no significant correlation between fasting glucose with any of the measurements of adipocyte cell size and distribution for subcutaneous fat (). There was a significant negative correlation of HbA1c with the mean size of adipocytes from the subcutaneous depot (r = −0.412, p = 0 .033), and there was a trend toward significance in the % of small cells (p = 0 .080) (). There was no significant correlation in the mean size of small or large adipocytes. In contrast, for both depots of visceral fat, omentum and mesentery, there was a significant positive correlation between fasting glucose and the fraction of small cells (r=0 .409, p=0 .028 and r = 0 .523, p = 0 .004) (). Although there was a trend in both subcutaneous fat and mesentery, HbA1C was significantly positively correlated with fraction of small cells in the omental fat depot alone (r = 0.423, p = 0.028) (). There was no significant correlation between fasting blood glucose or HbA1C with large or small cell diameter for any of the fat depots. Of lipid levels, only HDL cholesterol showed a significant negative correlation with small cell diameter in the omental fat depot (r = −0.390, p=0 .040).
Figure 2. Correlation between fasting glucose and mean cell size and % small cells in the 3 different fat depots from diabetic (solid circles) and nondiabetic (open circles) subjects. Sc, subcutaneous fat (A, B); Om, omentum (C, D); and Mes, mesentery (E, F). n = 29 .
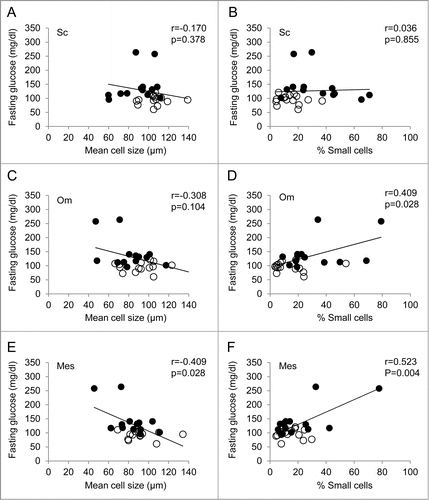
Figure 3. Correlation between HbA1c and mean cell size and % small cells in the 3 different fat depots from diabetic (solid circles) and nondiabetic (open circles) subjects. Sc, subcutaneous fat (A, B); Om, omentum (C, D); and Mes, mesentery (E, F). n = 27 .
Discussion
Our results are consistent with recent reports that it is an increase in the fraction of small cells that is associated with insulin resistance and type 2 diabetes mellitus in subcutaneous fat.Citation17,18 In contrast to most studies investigating adipose tissue that include only subcutaneous fat, our study includes subcutaneous fat as well as 2 depots of visceral fat, the omentum and mesentery. Here, we show that the size distribution of adipocytes isolated from all 3 fat depots is essentially bimodal and that it is the small cells that have a greater association with type 2 diabetes mellitus, fasting glucose, and HbA1c. To our knowledge, this is the first report of the association of adipocyte cell size and distribution based on diabetic status that includes subcutaneous fat as well as omentum and mesentery as visceral fat depots.
It has been hypothesized that adipocyte hypertrophy and hyperplasia represent a continuum of changes in adipocyte cell size and distribution in response to excess energy, with hypertrophy being associated with relative insulin sensitivity or early insulin resistance and hyperplasia with greater insulin resistance and type 2 diabetes mellitus.Citation13,17,18,22,33,35 Our results support that adipocyte hypertrophy and hyperplasia may also be important in the omentum and mesentery of diabetic patients. All fat depots, then, may initially respond to energy excess by storing more lipid, until a "threshold" in hypertrophy is reached.Citation22 This threshold would be specific to fat depot, with subcutaneous fat having a greater capacity for storage than visceral adipose tissue. Once the threshold is reached or in overlapping manner, hyperplasia or expansion of the small cell population would occur to increase storage capacity. The patient may be "protected" from energy excess if these newly recruited small cells can accumulate lipid to become large cells or fully mature into functional adipocytes.Citation22 However, patients who have an expanded population of small cells that cannot hypertrophy or differentiate into mature adipocytes would be at higher risk for developing insulin resistance and type 2 diabetes mellitus.Citation22,26,36
Like previous studies, our data do not establish whether the association between adipocyte cell size and distribution and type 2 diabetes mellitus is causative.
It has been proposed that impaired maturation of small cells into fully functional adipocytes results in the accumulation of lipid in peripheral tissues such as liver and muscle.Citation15,22,25,26,37-39 This ectopic deposition of fat in the liver manifests as impaired suppression of gluconeogenesis and in the muscle as defective insulin signaling to decrease glucose transport and glycogen synthesis.Citation37-39 Together, these promote insulin resistance and the development of type 2 diabetes mellitus. An alternative possibility is based on the endocrine function of adipose tissue.Citation22 Numerous studies have demonstrated increased secretion of proinflammatory cytokines such as IL-6, IL-8, TNF-α, MCP-1 vs decreased secretion of the insulin-sensitizing hormone adiponectin from adipocytes based on size or insulin resistance.Citation11,18,33,40 These adipocytokines would then contribute to an overall proinflammatory state effecting decreased insulin sensitivity in targeted peripheral tissues such as liver and muscle. These two possibilities are not mutually exclusive and both may play a role in each fat depot or differentially dependent on location of the depot. Subcutaneous fat may be relatively “protective” then because these cells can accumulate more lipid and these larger cells contribute to reducing ectopic lipid accumulation and/or decreased proinflammatory cytokine secretion; conversely, omental and mesenteric adipocytes would be unable to accumulate as much lipid leading to increased ectopic fat deposition and/or an increase in the inflammatory profile.
Our study is limited by our patient population, patients who are undergoing bariatric surgery. We selected this patient population because bariatric patients are unique among surgical patients in that all 3 fat depots (subcutaneous fat, omentum, and mesentery) can be obtained at an elective operation, for reasons other than cancer or acute inflammatory surgical process, with minimal added risk to the patient than the intended procedure itself. At our institution, bariatric patients are comprised primarily of white females, including only 33% blacks and 10% males, so results may not be generalizable to other populations. Additionally, by definition in qualifying for bariatric surgery, all of our patients have morbid obesity. Thus, our results do not provide insight into differences in adipocyte cell size or distribution in diabetic vs nondiabetic lean patients. Further, although there were no significant differences between the 2 groups in clinical parameters except for fasting glucose and HbA1c, it is possible that some other unmeasured difference between the 2 groups is associated with adipocyte cell size and distribution and that it is not the presence of type 2 diabetes mellitus. However, we are encouraged that our results in 3 different fat depots are consistent with 2 previous studies of subcutaneous fat alone.Citation17,34 McLaughlin et al reported an increased fraction of small adipocytes in insulin-resistant (mean BMI 30.6 ± 4 .1) vs insulin-sensitive (mean BMI 29.4 ± 2 .7) subjects, and Pasarica et al found an increase in the fraction of small adipocytes in diabetic (mean BMI 31.5 ± 3 .2) vs nondiabetic (mean BMI 32.1 ± 5 .0) patients.Citation17,34 Another limitation of our study includes the small sample size with 30 patients total and 15 patients in each arm. However, this is comparable to other published studies investigating only the subcutaneous fat depot.Citation13,17,18
In conclusion, our data supports that adipocyte cell size and distribution are associated with the development of type 2 diabetes mellitus. Specifically, we demonstrate that it is the expansion of a population of small cells in all 3 fat depots examined, subcutaneous fat, omentum, and mesentery. Further studies are needed to elucidate the signaling mechanisms involved in adipogenesis, adipocyte maturation, and adipocyte function. Understanding how derangements in adipocyte morphology contribute to the development of diabetes could lead to novel therapeutic targets.
Patients/Methods/Materials
Patients. The study was approved by the Institutional Review Board at the University of Alabama at Birmingham. Written informed consent was obtained from all participants. Thirty patients with morbid obesity undergoing evaluation for bariatric surgery were recruited into the study from April 20, 2011 to October 2, 2013. There were 15 nondiabetic and 15 diabetic patients. All patients underwent routine medical screening for preoperative evaluation and had been approved for bariatric surgery. Data collected included patient demographics (age, sex, race), obesity-associated medical problems, anthropomorphic measurements (weight, BMI, waist circumference, waist-hip ratio, basal metabolic rate and % fat), and fasting laboratory evaluation (fasting glucose, HbA1c, and lipid levels). HOMA-IR was calculated in the non-diabetic patients using the formula HOMA-IR = [fasting insulin (microunits/mmol/l) x fasting plasma glucose (mmol/l)]/22.5. Adipose tissue was collected at the time of bariatric surgery, specifically Roux-en-Y gastric bypass, from 3 sites: abdominal subcutaneous fat, omentum, and mesentery. Samples were immediately placed in DMEM (Gibco, Carlsbad, CA) and transported to the laboratory.
Adipocyte isolation. Adipocytes were isolated by collagenase digestion using previously published protocols [34]. Briefly, approximately 5 g of minced adipose tissue from each depot were digested with digestive medium [DMEM, 25 mmol/l HEPES, 4.2 mmol/l NaHCO3, 4% BSA, 5 mmol/l glucose, 10 mg/l phenol red, and 1 mg/ml type II collagenase (Worthington Biochemical Corporation, Lakewood, NJ ), pH 7.5] at 37oC for 30 minutes with gentle orbital shaking. Cells were filtered through nylon mesh (400 μm), washed 3 times with GTB (117 mmol/l NaCl, 0.8 mmol/l MgSO4, 5.3 mmol/l KCl, 1 mmol/l NaH2PO4, 1.8 mmol/l CaCl2, 25 mmol/l HEPES, 2 mmol/l sodium pyruvate, and 2% BSA, pH 7.5) and resuspended to a final 5% (volume/volume) cell concentration. Adipocyte viability was determined by trypan blue exclusion as described and cell size was determined by microscopic measurement of cell diameter (Nikon Eclipse TE 2000-U and Q-Capture Suite 2.66.4.0, Quantitative Imaging Corp).Citation41 Cell diameter was measured using Image J version 1.47 (National Institutes of Health, USA). A total number of 350 adipocytes were measured for each fat depot for each patient. Cells <10 μm were excluded from analysis. The distribution of cell size from each depot from each patient was determined and was bimodal. The nadir for each patient was identified, defined as the low point or mid-point of a plateau between the 2 populations of cells. Small and large adipocytes were defined as those below and those above the nadir, respectively. Mean cell size diameter, mean small cell diameter, mean large cell diameter, % small cells and % large cells were determined for each patient based on the nadir.
Statistical analysis. SAS for Windows version 9.3 (SAS Institute, Cary, NC) was used for statistical analysis. Results are given as means ± standard error. Statistical significance was determined as a 2-sided p < 0.05. One-way analysis of variance (ANOVA) was used to determine the differences between different fat depots, followed by Tukey–Kramer's multiple comparisons test. General linear regression models were used to compare the differences of characteristics in different fat depots between diabetes and non-diabetes groups. We performed additional analysis by further adjusting the models for age, sex, race, and BMI. Relationships between clinical and metabolic parameters and adipocyte size information in all 3 different fat depots were visualized by scatter plots and assessed by Pearson correlation analysis.
Disclosure of Potential Conflicts of Interest
No potential conflicts of interest were disclosed.
Funding
This work was supported by grants from the Society of University Surgeons, Society for Surgery of the Alimentary Tract, and UAB Department of Surgery to JG. FG was supported by grants from the National Institutes of Health (DK-038765, DK-083562). We also acknowledge core facility support from the UAB Diabetes Research Center (P60 DK079626).
References
- Flegal KM, Carroll MD, Kit BK, Ogden CL. Prevalence of obesity and trends in the distribution of body mass index among US adults, 1990-2010. JAMA 2012; 307:491-497; PMID:22253363; http://dx.doi.org/10.1001/jama.2012.39
- Kopelman PG. Obesity as a medical problem. Nature 2000; 404:635-643; PMID:10766250
- Kenchaiah S, Evans JC, Levy D, Wilson PWF, Benjamin EJ, Larson MG, Kannel WB, Vasan RS. Obesity and the risk of heart failure. N Engl J Med 2002; 347:305-313; PMID:12151467; http://dx.doi.org/10.1056/NEJMoa020245
- Després J-P, Lemieux I. Abdominal obesity and metabolic syndrome. Nature 2006; 444:881-887; PMID:17167477; http://dx.doi.org/10.1038/nature05488
- Van Gaal LF, Mertens IL, DeBlock CE. Mechanisms linking obesity with cardiovascular disease. Nature 2006; 444:875-880; PMID:17167476; http://dx.doi.org/10.1038/nature05487
- Ärnlöv J, Ingelsson E, Sundström J, Lind L. Impact of body mass index and the metabolic syndrome on the risk of cardiovascular disease and death in middle-aged men. Circulation 2010; 121:230-236; http://dx.doi.org/10.1161/CIRCULATIONAHA.109.887521
- Rosen ED, Spiegelman BM. Adipocytes as regulators of energy balance and glucose homeostasis. Nature 2006; 444:847-853; PMID:17167472; http://dx.doi.org/10.1038/nature05483
- Gil A, Aguilera CM, Gil-Campos M, Cañete R. Altered signaling and gene expression associated with the immune system and the inflammatory response in obesity. Br J Nutr 2007; 98 (Suppl 1):S121-S126; PMID:17922949
- Weyer C, Foley JE, Bogardus C, Tataranni PA, Pratley RE. Enlarged subcutaneous abdominal adipocyte size, but not obesity itself, predicts Type II diabetes independent of insulin resistance. Diabetologia 2000; 43:1498-1506; PMID:11151758; http://dx.doi.org/10.1007/s001250051560
- Lundgren M, Svensson M, Lindmark S, Renström F, Ruge T, Eriksson JW. Fat cell enlargement is an independent marker of insulin resistance and 'hyperleptinaemia'. Diabetologia 2007; 50:625-633; PMID:17216279; http://dx.doi.org/10.1007/s00125-006-0572-1
- Skurk T, Alberti-Huber C, Herder C, Hauner H. Relationship between adipocyte size and adipokine expression and secretion. J Clin Endocrinol Metab 2007; 92:1023-1033; PMID:17164304; http://dx.doi.org/10.1210/jc.2006-1055
- Lönn M, Mehlig K, Bengtsson C, Lissner L. Adipocyte size predicts incidence of type 2 diabetes in women. FASEB J 2010; 24:326-331; PMID:19741173; http://dx.doi.org/10.1096/fj.09-133058
- Yang J, Eliasson B, Smith U, Cushman SW, Sherman AS. The size of large adipose cells is a predictor of insulin resistance in first-degree relatives of type 2 diabetic patients. Obesity 2012; 20:932-938; PMID:22240722; http://dx.doi.org/10.1038/oby.2011.371
- Salans L, Knittle JL, Hirsch J. The role of adipose cell size and adipose tissue insulin sensitivity in the carbohydrate intolerance of human obesity. J Clin Invest 1968; 47:153-165; PMID:16695937; http://dx.doi.org/10.1172/JCI105705
- Salans LB, Dougherty JW. The effect of insulin upon glucose metabolism by adipose cells of different size. J Clin Invest 1971; 50:1399-1410; PMID:5090056; http://dx.doi.org/10.1172/JCI106623
- Jacobsson B, Smith U. Effect of cell size on lipolysis and antilipolytic action of insulin in human fat cells. J Lipids Res 1972; 13:651-656
- McLaughlin T, Sherman A, Tsao P, Gonzalez O, Yee G, Lamendola C, Reaven GM, Cushman SW. Enhanced proportion of small adipose cells in insulin-resistant vs insulin-sensitive obese individuals implicates impaired adipogenesis. Diabetologia 2007; 50:1707-1715; PMID:17549449; http://dx.doi.org/10.1007/s00125-007-0708-y
- McLaughlin T, Deng A, Yee G, Lamendola C, Reaven G, Tsao PS, Cushman SW, Sherman A. Inflammation in subcutaneous adipose tissue: relationship to adipose cell size. Diabetologia 2010; 53:369-377; PMID:19816674; http://dx.doi.org/10.1007/s00125-009-1496-3
- Kannel WB, Cupples LA, Ramaswami R, Stokes J, Kreger BE, Higgins M. Regional obesity and risk of cardiovascular disease; the Framingham study. J Clin Epidemiol 1991; 44:183-190; PMID:1995775; http://dx.doi.org/10.1016/0895-4356(91)90265-B
- Wajchenberg BL. Subcutaneous and visceral adipose tissue: their relation to the metabolic syndrome. Endocr Rev 2000; 21:697-738; PMID:11133069; http://dx.doi.org/10.1210/edrv.21.6.0415
- Gastaldelli A, Miyazaki Y, Pettiti M, Matsuda M, Mahankali S, Santini E, DeFronzo RA, Ferrannini E. Metabolic effects of visceral fat accumulation in type 2 diabetes. J Clin Endocrinol Metab 2002; 87:5098-2103; PMID:12414878; http://dx.doi.org/10.1210/jc.2002-020696
- Heilbronn L, Smith SR, Ravussin E. Failure of fat cell proliferation, mitochondrial function and fat oxidation results in ectopic fat storage, insulin resistance, and type II diabetes mellitus. Int J Obes 2004; 28:S12-S21; http://dx.doi.org/10.1038/sj.ijo.0802853
- Fox CS, Massaro JM, Hoffmann U, Pou KM, Maurovich-Horvat P, Liu C-Y, Vasan RS, Murabito JM, Meigs JB, Cupples A, D'Agostino RB, O'Donnell CJ. Abdominal visceral and subcutaneous adipose tissue compartments: association with metabolic risk factors in the Framingham Heart Study. Circulation 2007; 116:39-48; PMID:17576866; http://dx.doi.org/10.1161/CIRCULATIONAHA.106.675355
- Tchernof A, Deprés J-P. Pathophysiology of human visceral obesity: an update. Physiol Rev 2011; 93:359-404; http://dx.doi.org/10.1152/physrev.00033.2011
- Björntorp P. "Portal" adipose tissue as a generator of risk factors for cardiovascular disease and diabetes. Arteriosclerosis 1990; 10:493-496; PMID:2196039; http://dx.doi.org/10.1161/01.ATV.10.4.493
- DeFronzo RA. Dysfunctional fat cells, lipotoxicity and type 2 diabetes. Int J Clin Pract 2004; 58:9-21; http://dx.doi.org/10.1111/j.1368-504X.2004.00389.x
- Liu A, McLaughlin T, Liu T, Sherman A, Yee G, Abbasi F, Lamendola C, Morton J, Cushman SW, Reaven GM, et al. Differential intra-abdominal adipose tissue profiling in obese, insulin-resistant women. Obes Surg 2009; 19:1564-1573; PMID:19711137; http://dx.doi.org/10.1007/s11695-009-9949-9
- Pérez-Pérez R, Ortega-Delgado FJ, García-Santos E, López JA, Camafeita E, Ricart W, Fernández-Real J-M, Peral B. Differential proteomics of omental and subcutaneous adipose tissue reflects their unalike biochemical and metabolic properties. J Proteome Res 2009; 8:1682-1693; http://dx.doi.org/10.1021/pr800942k
- Tchkonia T, Giorgadze N, Pirtskhalava T, Thomou T, DePonte M, Koo A, Forse RA, Chinnappan D, Martin-Ruiz C, Zglinicki T, Kirkland JL. Fat depot-specific characteristics are retained in strains derived from single human preadipocytes. Diabetes 2006; 55:2571-2578; PMID:16936206; http://dx.doi.org/10.2337/db06-0540
- Catalano KJ, Stefanovski D, Bergman R. Critical role of the mesenteric depot versus other intra-abdominal adipose depots in the development of insulin resistance in young rats. Diabetes 2010; 59:1416-1423; PMID:20299478; http://dx.doi.org/10.2337/db08-0675
- Tchkonia T, Tchoukalova YD, Giorgadze N, Pirtskhalava T, Karagiannides I, Forse RA, Koo A, Stevenson M, Chinnappan D, Cartwright A, et al. Abundance of two human preadipocyte subtypes with distinct capacities for replication, adipogenesis, and apoptosis varies among fat depots. Am J Physiol Endocrinol Metab 2005; 288:E267-E277; PMID:15383371; http://dx.doi.org/10.1152/ajpendo.00265.2004
- Yang Y-K, Chen M, Clements RH, Abrams GA, Aprahamian CJ, Harmon CM. Human mesenteric adipose tissue plays unique role versus subcutaneous and omental fat in obesity related diseases. Cell Physiol Biochem 2008; 22:531-538; PMID:19088435; http://dx.doi.org/10.1159/000185527
- Meyer LK, Ciaraldi TP, Henry RR, Wittgrove AC, Phillips SA. Adipose tissue depot and cell size dependency of adiponectin synthesis and secretion in human obesity. Adipocyte 2013; 2:217-226; PMID:24052897; http://dx.doi.org/10.4161/adip.24953
- Pasarica M, Xie H, Hymel D, Bray G, Greenway F, Ravussin E, Smith SR. Lower total adipocyte number but no evidence for small adipocyte depletion in patients with type 2 diabetes. Diabetes Care 2009; 32:900-902; PMID:19228873; http://dx.doi.org/10.2337/dc08-2240
- Danforth E. Failure of adipocyte differentiation causes type II diabetes mellitus? Nat Genet 2000; 26:13; PMID:10973236; http://dx.doi.org/10.1038/79111
- Yang X, Jansson P-A, Nagaev I, Jack MM, Carvalho E, Sunnerhagen KS, Cam MC, Cushman SW, Smith U. Evidence of impaired adipogenesis in insulin resistance. Biochem Biophys Res Comm 2004; 317:1045-1051; PMID:15094374; http://dx.doi.org/10.1016/j.bbrc.2004.03.152
- Goodpaster BH, Kelley DE. Role of muscle in triglyceride metabolism. Curr Opin Lipidol 1998; 9:231-236; PMID:9645506; http://dx.doi.org/10.1097/00041433-199806000-00008
- Shulman GI. Cellular mechanisms of insulin resistance. J Clin Invest 2000; 106:509-515; http://dx.doi.org/10.1172/JCI10583
- Seppala-Lindroos A, Vehkavaara S, Hakkinen AM, Goto T, Westerbacka J, Sovijarvi A, Halavaara J, Yki-Jarvinen H. Fat accumulation in the liver is associated with defects in insulin suppression of glucose production and serum free fatty acids independent of obesity in normal men. J Clin Endocrinol Metab 2002; 87:3023-3028; PMID:12107194; http://dx.doi.org/10.1210/jcem.87.7.8638
- Weller KE, Hotamisligil GS. Obesity-induced inflammatory changes in adipose tissue. J Clin Invest 2003; 112:1785-1788; PMID:14679172; http://dx.doi.org/10.1172/JCI20514
- Digirolamo M, Medlinger S, Fertig JW. A simple method to determine fat cell size and number in four mammalian species. Am J Physiol 1971; 221:850-858; PMID:5570342