 ?Mathematical formulae have been encoded as MathML and are displayed in this HTML version using MathJax in order to improve their display. Uncheck the box to turn MathJax off. This feature requires Javascript. Click on a formula to zoom.
ABSTRACT
Adipose tissue is the energy buffer in mammals. The cellularity of adipose tissue has a major role in determining the response of adipose tissue to insulin action. A reduction in the ability of adipose tissue to store ingested caloric excess can lead to dyslipidemia and lipotoxicity, impacting insulin action systemically. The dynamic response of adipose tissue to changes in diet is therefore a crucial aspect of metabolism, and has attracted attention in the context of the ongoing worldwide increase in overweight and obesity and resulting metabolic syndrome dysfunctions. We investigated in a mouse model if there is a specific delay between an increase in caloric intake and the recruitment of new adipocytes, and if there are other changes in adipose tissue dynamics concomitant with such a diet change. By developing a dynamic mathematical model, we found that there is a delay of 3 days between the start of a high fat diet and the recruitment of new adipocytes, and that the rate of fat mass increase modulates lipid turnover and adipose cell hypertrophy.
Introduction
Dyslipidemia may be an important contributor to insulin resistance and hyperglycemia associated with overweight and obesity.Citation1 Hypertrophy of mature adipose cells and recruitment of new pre-adipose cells is crucial for lipid storage.Citation2 If adipose tissue cannot store ingested caloric excess, insulin action and normal metabolic flexibility of energy homeostasis is impacted negatively.Citation3 Thus, understanding the dynamic response of adipose tissue to changes in diet has attracted attention,Citation4 especially in the context of the ongoing worldwide increase in obesity and resulting public health issues. Short-term overfeeding has been associated with reduced locomotor activity which contributes to net weight gain,Citation5 adipose tissue lipid overload,Citation6 and adipose cell specific effects including impaired insulin signaling at the IRS-17 level but maintained lipolytic rate.Citation8 Mathematical modeling has proven powerful to quantitatively resolve adipose tissue dynamic at the cellular level, illustrating expansion of adipose tissue and precursor recruitment.Citation9-11 Here, we investigate in a mouse model if there is a specific delay between an increase in caloric intake and the recruitment of new adipocytes, and if there are other dynamic changes in adipose tissue lipolysis and lipid uptake concomitant with such an increase. The ability to define the timing of cell recruitment and lipid turnover is essential for our overall understanding of the immediate changes in adipose cell function in response to altered/increased energy intake which influences whole body homeostasis (manuscript in preparation).
Materials and methods
Dataset
We used a data set consisting of adipose cell-size distributions that has been described elsewhere (manuscript in preparation). Briefly, 30 male C57BL/6 mice (Taconic, Ry, Denmark) were used at 9 weeks of age. Animals were on a 12 h light cycle with non-restricted food and water. Animals were fed a high-fat diet (HFD) (D12492, 60% fat content; ResearchDiets, New Brunswick, NJ, USA) for a specific number of days, as described below. All animal procedures were approved by the Malmö/Lund Committee for Animal Experiment Ethics, Lund, Sweden. Each group (6 animals/group) was on chow diet (CD) for τCD days and then HFD for τHFD days, with τCD + τHFD totaling 14 days. There were 5 sets of animals: 1) only chow diet for the entire period, τCD = 14 days; 2) 12 days CD followed by 2 days HFD; 3) 10 days CD followed by 4 days HFD; 4) 8 days CD followed by 6 days HFD; 5) only HFD, τHFD =14 days. The CD only group served as a baseline to deduce the initial adipocyte cell-size distribution.
Adipose tissue samples were obtained from epididymal fat tissue. The adipose cell-size distributions were obtained using a Beckman-Coulter counter after osmium fixation as described previously.Citation12 Fat mass changes were measured (shown in Fig. S1). The mean adipose cell distributions for each group are shown in Fig. S2.
Model description
We have previously developed dynamic models of adipose tissue cellularity in different contexts. Compared to our previous models,Citation9,10,13 the data in this study presents the challenge of uncovering the downstream effect on adipose tissue cellularity of a discontinuous change in diet. The general form of the equation governing adipocyte kinetics is(1)
(1) in which n is a normalized adipose cell-size probability distribution, s is the cell diameter (μm); b is the new adipose cell recruitment rate; v(s) is a cell size-dependent hypertrophy rate
(2)
(2) and D is a lipid turnover rate, modeling the stochastic changes in adipose cell size due to lipid uptake and lipolysis. We have to determine the parameters (b, D, Vm) in CD and HFD contexts from the data. We fixed the other parameters from our previous studies in mouse.Citation9
The three parameters (b, D, Vm) can be constants that are different depending on diet, CD or HFD. However, from the fat mass measured at different diet combination conditions (Fig. S1), the fat mass is not simply proportional to the length of HFD, but has a maximal increase after about 6 days of HFD. This phenomenon suggests that the modulation of adipocyte growth kinetics by HFD is complex, and therefore, the 3 essential parameters in HFD may not be constant but could possibly vary depending on the rate of fat mass change indirectly.
Models
There are 2 mathematical models that we developed to address these questions. In one model, denoted MOD 1, we let all rate constants be dependent on diet alone. In the other model, denoted MOD 2, we let the 3 rate parameters (b, D, Vm) be diet dependent, and D and Vm are assumed to be functions of the rate of fat mass change, which means that factors associated with fat mass play a role in the modulation of adipocyte kinetics.(3)
(3) in which θ is either D or Vm in HFD, dFM/dt is the fat mass change rate, calculated based on the measured epididymal fat mass in each diet group. KFM is a free parameter that sets the scale for sigmoidal dependence of D and Vm on the rate of fat mass change, and we assume here that this parameter is the same for both D and Vm. This does not have to be so but the experimental data is not detailed enough to justify including a separate parameter for the modulation of each parameter. The new adipose cell recruitment parameter is only changed from the chow to HFD diet value after the time delay period from the start of the HFD.
The models were implemented in Matlab (http://www.mathworks.com). A least-squares cost function comparing model predictions obtained by integrating EquationEq. 1(1)
(1) and the measured adipose cell-size probability distribution obtained from the Beckman-Coulter counter was minimized for parameter determination using the Optimization Toolkit. The uncertainties in cell-size counts in each bin needed for the cost function were estimated as the squared deviation between the measured final cell size distribution and a smoothed distribution. The Bayes Information Criterion (BIC) was used to balance goodness of fit and model complexity in comparing models, calculated as
(4)
(4) in which n is the number of data points (here the number of adipose cell-size bins), p is the number of parameters in each model and SSE is the total sum of squared errors normalized by the variance of data.
Results
There are 2 questions that we investigated:
Does HFD induce immediate new adipose cell recruitment or is there a specific time delay? Here we assume that after HFD initiation, b, the hyperplasia rate, is unchanged from its CD value until the time delay has elapsed, whereupon it changes to a (possibly different) value in the HFD diet.
Are the kinetic rates D and
diet dependent and constant, or are they modulated by physiological changes, such as the rate of fat mass increase?
Delay in onset of hyperplasia
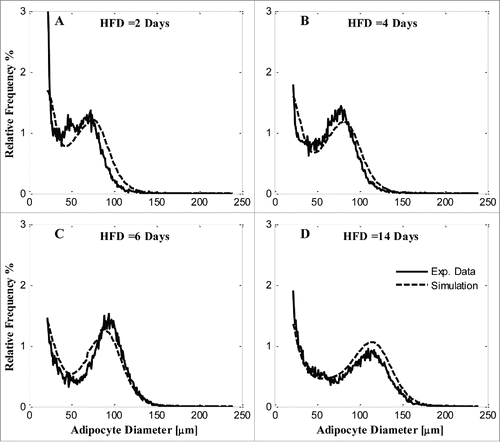
Model predictions with parameters minimizing the cost function are compared with experimental adipocyte cell-size probability distributions in each group in . While model simulations approximately fit the data, the simulated distributions do not match the data well in some ranges of adipose cell diameters, e.g., ~50 μm and ~100 μm ().
Figure 1. Model simulation and comparison with experimental data of each diet condition by MOD 1. A) 2 days of HFD; B) 4 days of HFD; C) 6 days of HFD; D) 14 days HFD. Solid line, experimental data; dashed line, model simulation.

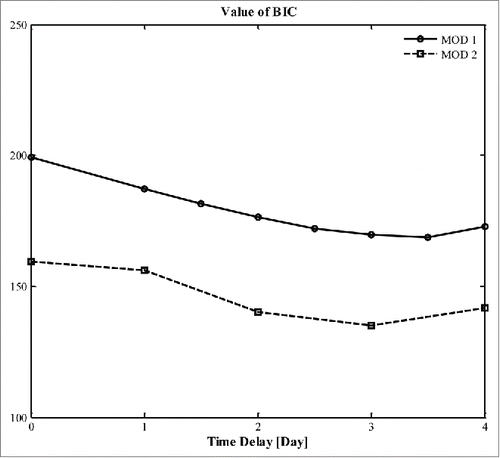
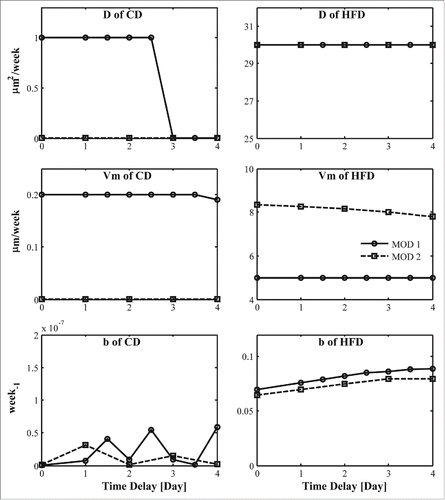
The values of the BIC for different values of time delay to the onset of hyperplasia associated with new adipose cell recruitment due to HFD are shown in for both models, and corresponding model parameters are shown in . The BIC reaches a minimum at approximately 3 days for both models, which suggests that HFD induced hyperplasia has a time delay of about 3 days. Most parameters have minor differences between our 2 models assuming different time delays, except for D in CD and in both CD and HFD.
Modulation of lipid turnover and adipose cell hypertrophy by rate of fat mass increase
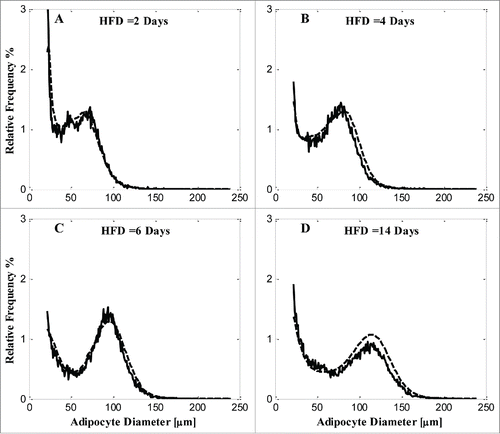
The simulated cell distributions predicted from MOD 2 are compared with experimental data in . KFM is 0.022. By assuming that both the lipid turnover (D) and growth rate (Vm) coefficients are functions of the rate of fat mass change, the goodness of fit improves considerably. BIC(MOD 2) is lower than BIC(MOD 1)(), suggesting that MOD 2, incorporating fat mass change as a modulator of lipolysis and hypertrophy, is a better model of adipose cell-size dynamics than MOD 1 which does not include such a modulation.
Discussion
We investigated the effect of a change in diet on adipose tissue in C57BL/6 mice, by measuring dynamic changes in the adipose cell-size probability distribution. Obviously, an increase in energy intake will be stored mostly as triglycerides leading to increased mass of fat depots. We were interested in changes both in size and number of adipose cells, specifically the appearance of new cells in adipose tissue and the impact of fat mass gain on hypertrophy and lipid turnover.
We found that hypertrophy and lipid turnover increase immediately with onset of HFD but their rate constants are modulated by the rate of change of overall fat mass in the epididymal fat pad. Indeed, mathematical modeling suggests that the appearance of new adipose cells is delayed by about 3 days. It could be that this time-delay in appearance of new adipose cells is further dependent on initial body weights and the duration of the high-fat diet. These are interesting avenues for future experimental and modeling efforts.
Is this appearance of new cells really hyperplasia or merely the maturation and hypertrophy of existing adipocyte precursors? Our study only measured cells with sizes larger than 20 microns due to the limitations of the Beckman-Coulter counter method for obtaining adipose cell-size distributions. Thus, it could be that adipocyte precursor cells are present but do not reach 20 microns until 3 days after the increase in caloric intake. Evidence from the AdipoChaser mouse would suggest that this appearance of new cells is not due to the formation of new cells during a short period of HFD but rather due to hypertrophy of existing precursors.Citation14,15 Nevertheless, if precursors are present at all sizes below the Beckman-Coulter counter’s lower limit, one would expect an immediate appearance of such precursors after HFD diet initiation Citation16 if it is the increased influx of lipid needing storage alone that is responsible for new adipocyte recruitment. Rather, new adipocytes reach the lower size limit after 3 days, suggesting either a longer maturation process indicating either some signaling or priming process connecting additional calories ingested and new adipocyte appearance, or a lack of demand due to the existing capacity of mature adipocytes to absorb the excess caloric intake for a certain period.Citation15 These are concrete hypotheses that may be testable with diet changes in an appropriate experimental design.
Further, the results direct our on-going experimental design exploring mature adipose cell function, where we are characterizing insulin sensitivity and adipokine secretion pattern that together influence the capacity of precursor recruitment and excess energy storage (manuscript in preparation). One of the major challenges is to understand why equally obese subjects display a huge variation of insulin sensitivity in the insulin target tissues. A larger number of small cells in insulin resistant compared with insulin sensitive subjects, suggests the insulin resistant state is due to an impaired capacity of newly recruited adipose cells to store surplus energy.Citation12 In contrast, impaired recruitment and differentiation of precursors into mature adipose cells through WNT1-inducible-signaling pathway protein 2 (WISP2) has emerged as a limitation for adipogenesis, rather than mature adipose cell malfunction.Citation17 There is a definite need for establishing methods to quantitatively describe adipose tissue cellularity, and the mathematical study presented herein of adipose cell adaptions in a short-term HFD mouse model may serve as a useful framework to validate different hypotheses of adipose cell function and energy storage capacity.
Disclosure of Potential Conflicts of Interest
No potential conflicts of interest were disclosed
KADI_A_1128588_Supplemental_Material.docx
Download MS Word (66.7 KB)Funding
This work was financially supported by the Novo Nordisk Foundation, Diabetes Foundation, Magnus Bergvall Foundation, Craaford Foundation, Albert Påhlsson Foundation, and the Royal Physiographic Society in Lund. YL, SWC and VP were supported by the Intramural Research Program of the National Institutes of Health, NIDDK.
References
- Kloting N, Fasshauer M, Dietrich A, Kovacs P, Schon MR, Kern M, Stumvoll M, Blüher M. Insulin-sensitive obesity. Am J Physiol Endocrinol Metab 2010; 299:E506–15; PMID:20570822; http://dx.doi.org/10.1152/ajpendo.00586.2009
- Paar M, Jungst C, Steiner NA, Magnes C, Sinner F, Kolb D, Lass A, Zimmermann R, Zumbusch A, Kohlwein SD, et al. Remodeling of lipid droplets during lipolysis and growth in adipocytes. J Biol Chem 2012; 287:11164–73; PMID:22311986; http://dx.doi.org/10.1074/jbc.M111.316794
- Friedman JM. Obesity: Causes and control of excess body fat. Nature 2009; 459:340–2; PMID:19458707; http://dx.doi.org/10.1038/459340a
- Cummins TD, Holden CR, Sansbury BE, Gibb AA, Shah J, Zafar N, Tang Y, Hellmann J, Rai SN, Spite M, et al. Metabolic remodeling of white adipose tissue in obesity. Am J Physiol Endocrinol Metab 2014; 307:E262–77; PMID:24918202; http://dx.doi.org/10.1152/ajpendo.00271.2013
- Bjursell M, Gerdin AK, Lelliott CJ, Egecioglu E, Elmgren A, Tornell J, Oscarsson J, Bohlooly-Y M. Acutely reduced locomotor activity is a major contributor to Western diet-induced obesity in mice. Am J Physiol Endocrinol Metab 2008; 294:E251–60; PMID:18029443; http://dx.doi.org/10.1152/ajpendo.00401.2007
- Lee YS, Li P, Huh JY, Hwang IJ, Lu M, Kim JI, Ham M, Talukdar S, Chen A, Lu WJ, et al. Inflammation is necessary for long-term but not short-term high-fat diet-induced insulin resistance. Diabetes 2011; 60:2474–83; PMID:21911747; http://dx.doi.org/10.2337/db11-0194
- Danielsson A, Fagerholm S, Ost A, Franck N, Kjolhede P, Nystrom FH, Strålfors P. Short-term overeating induces insulin resistance in fat cells in lean human subjects. Mol Med 2009; 15:228–34; PMID:19593406; http://dx.doi.org/10.2119/molmed.2009.00037
- Wiedemann MS, Wueest S, Grob A, Item F, Schoenle EJ, Konrad D. Short-term HFD does not alter lipolytic function of adipocytes. Adipocyte 2014; 3:115–20; PMID:24719784; http://dx.doi.org/10.4161/adip.27575
- Jo J, Guo J, Liu T, Mullen S, Hall KD, Cushman SW, Periwal V. Hypertrophy-driven adipocyte death overwhelms recruitment under prolonged weight gain. Biophys J 2010; 99:3535–44; PMID:21112277; http://dx.doi.org/10.1016/j.bpj.2010.10.009
- Jo J, Gavrilova O, Pack S, Jou W, Mullen S, Sumner AE, Cushman SW, Periwal V. Hypertrophy and/or Hyperplasia: Dynamics of Adipose Tissue Growth. PLoS Comput Biol 2009; 5:e1000324; PMID:19325873; http://dx.doi.org/10.1371/journal.pcbi.1000324
- MacKellar J, Cushman SW, Periwal V. Waves of adipose tissue growth in the genetically obese Zucker fatty rat. PloS one 2010; 5:e8197; PMID:20107501; http://dx.doi.org/10.1371/journal.pone.0008197
- McLaughlin T, Sherman A, Tsao P, Gonzalez O, Yee G, Lamendola C, Reaven GM, Cushman SW. Enhanced proportion of small adipose cells in insulin-resistant vs insulin-sensitive obese individuals implicates impaired adipogenesis. Diabetologia 2007; 50:1707–15; PMID:17549449; http://dx.doi.org/10.1007/s00125-007-0708-y
- Li YG, Jonathan R, McLaughlin T, Sørensen TIA, Periwal V. Macro fat and micro fat: insulin sensitivity and gender dependent response of adipose tissue to isocaloric diet change. Adipocyte 2015; 4:256–63; PMID: 26167397
- Wang QA, Scherer PE. The AdipoChaser mouse: A model tracking adipogenesis in vivo. Adipocyte 2014; 3:146–50; PMID:24719789; http://dx.doi.org/10.4161/adip.27656
- Wang QA, Tao C, Gupta RK, Scherer PE. Tracking adipogenesis during white adipose tissue development, expansion and regeneration. Nat Med 2013; 19:1338–44; PMID:23995282; http://dx.doi.org/10.1038/nm.3324
- Jeffery E, Church CD, Holtrup B, Colman L, Rodeheffer MS. Rapid depot-specific activation of adipocyte precursor cells at the onset of obesity. Nat Cell Biol 2015; 17:376–85; PMID:25730471; http://dx.doi.org/10.1038/ncb3122
- Grunberg JR, Hammarstedt A, Hedjazifar S, Smith U. The Novel Secreted Adipokine WNT1-inducible Signaling Pathway Protein 2 (WISP2) Is a Mesenchymal Cell Activator of Canonical WNT. J Biol Chem 2014; 289:6899–907; PMID:24451367; http://dx.doi.org/10.1074/jbc.M113.511964


