
ABSTRACT
The incidence of obesity has increased dramatically over the past two decades with a prevalence of approximately 40% of the adult population within the United States. The current study examines the potential for transgenerational adipocyte (fat cell) epigenetic alterations. Adipocytes were isolated from the gonadal fat pad of the great-grand offspring F3 generation 1-year old rats ancestrally exposed to DDT (dichlorodiphenyltrichloroethane), atrazine, or vehicle control in order to obtain adipocytes for DNA methylation analysis. Observations indicate that there were differential DNA methylated regions (DMRs) in the adipocytes with the lean or obese phenotypes compared to control normal (non-obese or lean) populations. The comparison of epigenetic alterations indicated that there were substantial overlaps between the different treatment lineage groups for both the lean and obese phenotypes. Novel correlated genes and gene pathways associated with DNA methylation were identified, and may aid in the discovery of potential therapeutic targets for metabolic diseases such as obesity. Observations indicate that ancestral exposures during critical windows of development can induce the epigenetic transgenerational inheritance of DNA methylation changes in adipocytes that ultimately may contribute to an altered metabolic phenotype.
Introduction
Obesity is rapidly increasing in prevalence and has reached a pandemic state with more than 650 million adults affected worldwide [Citation1]. Sixty five percent of the world population lives in a country where obesity is responsible for more deaths than undernutrition [Citation2]. Within in the United States, the prevalence of obesity in adults has reached over 40% of the population [Citation3]. Obesity dramatically increases the risk for non-communicable diseases like cardiovascular disease, type II diabetes, non-alcoholic fatty liver disease, certain cancers, stroke, and kidney disease [Citation4–Citation7]. Obesity is often associated with overnutrition and a sedentary lifestyle, however, this does not fully account for the dramatic changes in prevalence. Even after controlling for exercise levels and caloric intake, body mass index (BMI) increased by 2.3 kg/m2 between 1998–2006 within the United States population, suggesting an increased disease susceptibility and other factors should be considered [Citation8]. Human epidemiological studies have suggested that obesity may have early life developmental origins [Citation9,Citation10]. Early life exposures to environmental insults such as poor nutrition in utero that results in reduced birth weight have been shown to increase the susceptibility to obesity and metabolic dysregulation [Citation9]. Environmental insults in early development can influence cellular plasticity that is associated with increasing the risk of chronic diseases later in life [Citation10–Citation12]. Therefore, other causes such as environmental exposures should also be considered in the pathogenesis of obesity. The current study was designed to investigate the impacts of ancestral environmental exposures on the epigenetic transgenerational inheritance of obese or lean susceptibility through epigenetic reprogramming of adipocytes.
One environmental exposure in particular that has garnered attention is a class of compounds called endocrine disruptors, which can interfere with the action of hormones even at low doses [Citation13]. Several classes of endocrine disruptors have been found to promote obesity including plasticizers, flame retardants, pesticides, organotins, and persistent organic pollutants [Citation14]. Environmental toxicants including endocrine disruptors that increase the susceptibility to obesity are called obesogens [Citation15,Citation16]. Some obesogens act directly on adipose tissue, an active endocrine organ with influences on food intake, blood sugar levels, triglyceride storage, hormonal metabolism, and local immune function [Citation15,Citation17,Citation18]. Obesogens can modulate adipose tissue activity by altering adipocyte number, adipocyte size, metabolic function, and regulation of appetite [Citation15]. As many obesogens are persistent in the environment, it is imperative to consider obesogens in the etiology of the obesity pandemic.
In addition to direct exposure effects, many environmental compounds can increase the susceptibility to obesity across generations through epigenetic transgenerational inheritance. Epigenetics involves molecular factors and processes around the DNA that regulate genomic activity independent of DNA sequence, and are mitotically stable [Citation19]. One of the epigenetic marks associated with transgenerational inherence is DNA methylation of CpG dinucleotide residues [Citation19]. DNA methylation is one of the most well characterized forms of epigenetic regulation and is often associated with altered transcriptional activity of the associated genes [Citation20]. DNA methylation is generally stable and enduring in somatic cells. However, during development, the epigenome goes through a cascade of methylation changes [Citation21]. Changes to the environmental conditions during development can disrupt these processes and cause aberrant methylation patterns of the epigenome [Citation21,Citation22]. If the altered methylation patterns are heritable to the subsequent F3 generations (great-grand offspring), the transmission of these epimutations is called epigenetic transgenerational inheritance [Citation23,Citation24].
Epigenetic transgenerational inheritance of obesity has been observed following ancestral exposure to dioxins [Citation25], jet fuel hydrocarbons [Citation26], the pesticide dichlorodiphenyltrichloroethane (DDT) [Citation27], the pesticide methoxychlor [Citation28], plastics derived endocrine disruptors (bisphenol-A (BPA), bis(2-ethylhexyl)phthalate (DEHP) and dibutyl phthalate (DBP)) [Citation29], and the biocide tributyltin [Citation30,Citation31]. However, few studies have investigated the epigenetic molecular mechanisms behind the transgenerational increase in obesity. Chamorro-Garcia et al. found that ancestral exposure to tributyltin promotes obesity in the F3 generation of rats through reprogramming of mesenchymal stem cells to favor the adipocyte differentiation pathway [Citation31]. The F4 generation of the tributyltin lineage male rats exhibited an increased susceptibility to weight gain with a high fat diet and resistance to weight loss under fasting conditions [Citation30]. This phenotype was also associated with DNA methylation changes in white adipose tissue [Citation30]. Epigenetic modifications such as DNA methylation are important regulators of cell specific gene expression [Citation32], and differential patterns can be seen among individual cell types [Citation33,Citation34]. However, adipose tissue is highly plastic in its cell composition with many varying cell types [Citation35]. Mature adipocytes make up approximately one third of the cells in adipose tissue while the other cell types include mesenchymal stem cells, preadipocytes, endothelial precursor cells, and immune cells [Citation17]. It is possible that the epigenetic profiles of other cell types without metabolic function may be more prominently featured in these data than metabolically relevant cells like the adipocyte. Therefore, the current study utilizes purified adipocytes isolated from gonadal fat tissue in order to provide information on the epigenetic etiology of obesity.
A recent study investigated an obesity phenotype in the F3 generation of rats following ancestral exposure to the pesticide DDT [Citation27,Citation36]. In contrast, a lean phenotype was observed transgenerationally following ancestral exposure to the herbicide atrazine [Citation37]. Transgenerational epigenetic changes in the germline can promote an altered epigenome and transcriptome in embryonic stem cells, precursor cells, and eventually in all derived somatic cells [Citation19,Citation38,Citation39], including adipocytes. The current study was designed to investigate the potential transgenerational epigenetic alterations in the adipocyte epigenome.
Materials and methods
Animal studies and breeding
Female and male rats from an outbred strain of Harlan Sprague Dawley (Indianapolis, IN) were acquired at about 70 to 100 days of age and maintained in ventilated isolator cages with a 14 hour light: 10 hour dark regimen. The rats were fed ad lib. with a standard diet (8640 Teklad 22/5 Rodent Diet; Harlan) and ad lib. tap water for drinking. The females were mated and vaginally smeared to determine sperm positive status and to monitor for diestrus. Upon confirmed pregnancy, F0 generation females were administered a daily intraperitoneal injection of DDT, atrazine, or vehicle control on days 8 through 14 of gestation. The gestating females treated were designated as either control, atrazine, or DDT lineages of the F0 generation. The F1, F2, and F3 generations were not given any subsequent treatment or vehicle control. The offspring of the F0 gestating females were the F1 generation. The F2 generation rats were bred to create the F3 generation. No sibling or cousin breeding were used in either generation in order to avoid inbreeding depression of epigenetics or artifacts. The F3 generations were not exposed directly to DDT or atrazine in order to see transgenerational effects as previously described [Citation36,Citation37]. All generations of the control, atrazine, and DDT rats were given the same lighting, food, and water conditions. All experimental protocols for the rat procedures were pre-approved by the Washington State University Animal Care and Use Committee (IACUC approval #6252).
Histopathology and obesity classification
The F3 generation rats at 12 months of age were euthanized via CO2 inhalation and cervical dislocation in order to harvest tissues. Body weight and length was measured at dissection. The gonadal fat pad was fixed in Bouin’s solution (Sigma) for 24 hours followed by 70% ethanol and processed by paraffin embedding for adipocyte area examination. Tissue sections (5 µm) were made and stained with hematoxylin and eosin staining using standard protocols.
Obese and lean phenotypes were assessed by an increase or decrease in adipocyte size (area) within the gonadal fat pad, body mass index (BMI), and observed abdominal adiposity of visceral fat pads at dissection. Animals were initially assessed for an obese or lean phenotype at dissection based on observed excess or lack of abdominal adiposity of the visceral fat pads, gonadal fat pad weight, and body mass index (BMI). BMI was calculated with weight (g)/length (cm)2. Gonadal fat pad slides were imaged using a Nikon Eclipse E800 microscope (10x) with an AVT Prosilica GE1050C Color GigE camera. Five field of view image captures were taken per slide in varying parts of the fat pad. The gonadal fat pad was utilized as it is the most easily accessible visceral fat pad and visceral fat depot size is the most relevant fat deposition site to metabolic pathology in obesity [Citation40]. Adipocyte size was measured by converting pixels into microns utilizing Adiposoft [Citation41]. Measurements of the 20 largest cells from each image for a total of 100 cells per animal were averaged as hypertrophic cells are an indicator of a pro-apoptotic phenotype strongly associated with metabolic pathology [Citation42]. A cut-off was established to declare an individual rat ‘obese’ or ‘lean’ based on the mean adipocyte area plus 1.5 standard deviations from the mean of the control group adipose tissue. Males and females were assessed for this cut-off separately. Adipocyte area was prioritized to make obese and lean calls for the purpose of phenotypic consistency as adipocyte hypertrophic and hyperplastic obesity have differential epigenomic profiles [Citation43]. Rats with adipocyte areas above 1.5 standard deviation from the mean were considered to have an obesity (adipocyte hypertrophy) phenotype. Rats with adipocyte areas below 1.5 standard deviation from the mean were considered to have a lean (adipocyte hypotrophy) phenotype.
Adipocyte isolation
Gonadal fat pads (epididymal and periovarian) from a total of 218 animals were dissected, weighed, and placed into 1X PBS on ice. The fat pads were dissected free of large pieces of vascular tissue or vas deferens and minced. The minced tissue was placed into a 1mg/ml collagenase solution in 1X PBS (Sigma-Aldrich Collagenase from Clostridium histolyticum #C2139; St. Louis, MO) with 3 ml of collagenase solution per 1g of adipose tissue. The samples were shaken at 100 rpm at 37C for 45 minutes using New Brunswick Innova 4000 (Edison, NJ), and then immediately placed on ice. The adipocytes were allowed to settle for 10 minutes on ice. The supernatant adipocyte layer was pipetted off and placed into microcentrifuge tubes. A portion of the isolated adipocyte sample was stored in 1 ml of RoboZol reagent at −20C.
DNA isolation
To isolate DNA, 200 µl of adipocytes in PBS were added to 820 µl of DNA extraction buffer (1M tris HCl, 0.5M EDTA, 10% sodium dodecyl sulfate) and 50 µl of proteinase K (20mg/ml). The samples were incubated at 55C for 2–3 hours under constant rotation. After incubation, 300 µl of protein precipitation solution (Promega Genomic DNA Purification Kit, A795A) was added to each sample, sample vortexed thoroughly, and incubated for 20 minutes on ice. The samples were centrifuged at 13,500 g for 30 minutes at 4C. Two 500 µl aliquots of the supernatant from each sample were transferred into two centrifuge tubes, ensuring the white protein pellet was not disturbed. 500 µl of phenol-chloroform-isoamyl alcohol was added to each tube and vortexed thoroughly. The samples were centrifuged at 16,250 g at room temperature for 5 minutes. Then, 500 µl of chloroform was added to each tube, vortexed thoroughly, then centrifuged for 5 minutes at 16,250 g. The supernatant was transferred to new tubes and then 2 µl of GlycoBlue (Invitrogen AM9516), 50 µl of 3M NaOAc pH 5.2, and 1 ml 100% ethanol was added to each tube. The samples were vortexed thoroughly and then incubated overnight at −20C. The samples were centrifuged at 13,500g for 20 minutes at 4C. The supernatant was discarded and 500 µl of 70% cold ethanol was added to each pellet and placed at −20C for 20 minutes. The samples were centrifuged for 10 minutes at 4C at 18,000 g, and the supernatant was discarded. The samples were centrifuged again in order to collect and discard the residual ethanol at the bottom of the tube. The samples were dried for 5 minutes, and then resuspended in 50 µl of nuclease free water in each tube.
MeDIP
The adipocyte DNA from the control, F3 generation atrazine, and F3 generation DDT lineage rats were processed for MeDIP. Adipocyte DNA from 2–5 individuals were pooled into 5 pools per group: control obese male (COM), n = 11; control normal male (CNM), n = 17; control lean male (CLM), n = 10; control obese female (COF), n = 15; control normal female (CNF), n = 17; control lean female (CLF), n = 16; DDT obese male (DOM), n = 14; DDT normal male (DNM), n = 13; DDT obese female (DOF), n = 14; DDT normal female (DNF), n = 18; atrazine lean male (ALM), n = 11; atrazine normal male (ANM), n = 17; atrazine lean female (ALF), n = 23; and atrazine normal female (ANF), n = 10. Six µg of DNA from each pool was diluted with 130 µl TE buffer (10mM TrisHCl, pH7.5; 1mM EDTA) and sonicated to 300bp fragment size using the Covaris M220. 10 µl of each sample was run on a 1.5% agarose gel in order to verify fragment size. The volume of sonicated DNA was measured and diluted with TE buffer to 400 µl. The DNA was then denatured at 95C and immediately cooled in ice for 5 minutes. 100 µl of cold 5X IP buffer and 5 µg of antibody (monoclonal mouse anti 5-methyl cytidine; Diagenode #C15200006) was added. The samples were incubated overnight on a rotator at 4C. After incubation, magnetic beads (Dynabeads M-280 Sheep anti-Mouse IgG; Life Technologies 11201D) were prewashed by resuspending and placing 50 µl per sample into a tube on a magnetic rack in order to discard the supernatant. The beads were resuspended again in 1 ml of washing buffer and incubated for 1 minute. The beads were placed on the magnet again in order to discard the supernatant, and the beads were resuspended using 50 µl of 1x IP buffer per sample. 50 µl of beads were added to each sample of the DNA-antibody mixture. The samples were incubated on a rotating platform for 2 hours at 4C. Following incubation, the beads were washed three times with 1x IP buffer. The samples were placed on a magnet and the supernatant was discarded. The samples were washed with 1ml of cold 1x IP buffer, and mixed gently by inverting the tubes. The samples were placed on the magnet again and the supernatant was discarded. After the third wash, the beads were resuspended in 250 µl digestion buffer. 3.5 µl Proteinase K Mix (20mg/ml) were added to the resuspended beads. The beads were incubated for 2–3 hours on a rotating platform at 55C. After incubation, 250 µl of Phenol-Chloroform-Isoamylalcohol was added to each sample. The tubes were vortexed for 30 seconds and centrifuged at 18,000 g for 5 minutes at room temperature. The supernatant was removed, placed into new tubes, and 250 µl of chloroform was added. The tubes were vortexed again for 30 seconds and centrifuged at 18,000 g for 5 minutes at room temperature. The supernatant was removed and placed into a new tube. Then 2 µl of GlycoBlue (20 mg/ml) was added and tubes vortexed. The DNA was precipitated overnight at −20C. The following day, the samples were centrifuged for 18,000 g for 20 minutes at 4C. The supernatant was discarded and 500 µl cold 75% ethanol was added. The samples were placed at −20C for 15 minutes. The samples were centrifuged for 18,000 g for 5 minutes at 4C, and the supernatant was removed. The samples were allowed to dry for 5 minutes, and were then resuspended in 25 µl DNAse-free water. The DNA concentration were measured using the Qubit ssDNA kit (Life Technologies Molecular Probes Q10212).
The MeDIP DNA was used to create libraries for next generation sequencing (NGS) using the NEBNext Ultra RNA Library Prep Kit for Illumina (San Diego, CA) starting at the second strand cDNA synthesis step of the manufacturer’s protocol in order to generate double stranded DNA from the single-stranded MeDIP DNA. Each individual sample received a separate index primer. Next Generation Sequencing was performed at WSU Spokane Genomics Core using the Illumina HiSeq 2500 with a PE50 application.
Statistics and bioinformatics
Previous studies have shown that differential DNA methylated regions can be exposure specific [Citation44]. Therefore, in order to remove the background effects of the specific exposure in each group, the DMR from each treatment group and each sex were first compared between each phenotype vs non-phenotype. The control (C), DDT (D), or atrazine (A) exposure lineage for male (M) or female (F) from obese (O), lean (L), or normal non-obese or non-lean (N) was used to categorize exposure and phenotype groups, as listed in . COF DMR were identified by comparing CNF vs COF. COM DMR were identified by comparing CNM vs COM. CLF DMR were identified by comparing CNF vs CLF. CLM DMR were identified by comparing CNM vs CLM. DOF DMR were identified by comparing DNF vs DOF. DOM DMR were identified by comparing DNM vs DOM. ALF DMR were identified by comparing ANF vs ALF. ALM DMR were identified by comparing ANM vs ALM.
Figure 1. DMR identification. The number of DMRs found using different p-value cut-off thresholds. The all window column shows all DMRs. The multiple window column shows the number of DMRs containing at least two significant 1000 bp windows. The lower table of each set shows the number of DMR having each specific number of significant windows at a p-value <1e-05. (a) Control obese female DMR. (b) Control lean female DMR. (c) Control obese male DMR. (d) Control lean male DMRs. (e) DDT obese female DMRs. (f) DDT obese male DMRs. (g) Atrazine lean female DMRs. (h) Atrazine lean male DMR.
The basic read quality was verified using summaries produced by the FastQC programhttp://www.bioinformatics.babraham.ac.uk/projects/fastqc/. The raw reads were trimmed and filtered using Trimmomatic (10.1093/bioinformatics/btu170). The reads for each MeDIP sample were mapped to the Rnor 6.0 rat genome using Bowtie2 [Citation45] with default parameter options. The mapped read files were then converted to sorted BAM files using SAMtools [Citation46]. To identify DMRs, the reference genome was broken into 1000 bp windows. The MEDIPS [Citation47] and edgeR [Citation48] R packages were used to calculate differential coverage between control and exposure sample groups. The edgeR p-value was used to determine the relative difference between the two groups for each genomic window. Windows with an edgeR p-value less than an arbitrarily selected threshold were considered DMRs. The DMR edges were extended until no genomic window with a p-value < 0.1 remained within 1000 bp of the DMR. CpG density. Other information was then calculated for the DMR based on the reference genome. DMRs from a set of analyses were considered overlapping if they shared any genomic coordinate in common. An additional expanded overlap analysis was performed. For this analysis, each DMR in the first analysis was considered to be present in the second analysis if any genomic window at the DMR location in the second analysis had an edgeR p-value ≤ 0.05. DMRs were annotated using the biomaRt R package [Citation49] to access the Ensembl database [Citation50].
The genes that fell within 10kbp of the DMR edges were then inputted into the KEGG pathway search [Citation51,Citation52] to identify associated pathways. The associated genes were sorted into functional groups by consulting information provided by the DAVID [Citation53], and Panther [Citation54] databases, then incorporated into an internal curated database (www.skinner.wsu.edu under genomic data). All molecular data has been deposited into the public database at NCBI (GEO # GSE137536).
The DMR sets with the highest amount of DMR at p ≤ 1e-05 were compared to other sets at a lower stringency of p ≤ 0.05. The DMR compared were COF, CLF, COM, DOM, and ALM. Each set of DMR at p ≤ 1e-05 was compared to the other sets of DMR at p ≤ 0.05. For example, COF at p ≤ 1e-05 was compared in a Venn diagram to CLF, COM, DOM, and ALM at p ≤ 0.05 to determine any overlapping DMR at a lower stringency. These overlapping DMR were then assessed for common pathways between each set utilizing the KEGG pathway search and DAVID for functional groups. Additionally, a literature search was performed on the genes utilizing the NCBI Gene database [Citation55] and PubMed search with the query ‘([gene name]) AND (Obesity or Adipocyte or Adipose)’ in order to find the gene functions most relevant to this study, if available.
Results
Obese and lean phenotype analysis
Gestating F0 generation rats were exposed to atrazine, DDT, or control vehicle from days 8–14 of gestation, as described in the Methods. The F1 generation offspring exposed in utero were bred within the exposure lineage colony to produce the intercross F2 generation and subsequent F3 generation. Adipocytes were isolated from the gonadal fat pad of the one-year old F3 generation of rats ancestrally exposed to DDT, atrazine, or vehicle control. A small portion of the fat pad was also fixed in Bouin’s solution in order to assess adipocyte area. The dramatic change in adipocyte area correlated to the disease with a cell area of 2040–2787 micron2 for lean, 3638–3371 micron2 for normal, and 4686–4294 micron2 for obese which was independent of sex or exposure lineage. Obese and lean phenotypes were defined as an increase or decrease in adipocyte area, body mass index (BMI), and observed abdominal adiposity at dissection, as previously described [Citation27,Citation36,Citation37]. The lean, obese and normal (non-obese or non-lean) animals were separated for analysis. Adipocyte DNA was isolated from individuals and then pooled into 5 pools of 2–5 different individuals per phenotypic group.
DNA methylation analysis
Differential DNA methylated regions (DMRs) between the lean, obese, and control lineage adipocytes were characterized for DDT and atrazine groups with MeDIP-Seq, as described in the Methods. A number of p-value thresholds were assessed, and a more stringent p-value was used for subsequent data analysis. At a p-value threshold of p ≤ 1x1e-05, there were 1591 DMRs in the control obese females (COF), 1171 DMRs in the control lean females (CLF), 1782 DMRs in the control obese males (COM), 69 DMRs in the control lean males (CLM), 75 DMRs in the DDT obese females (DOF), 679 DMRs in the DDT obese males (DOM), 35 DMRs in the atrazine lean females (ALF), and 726 DMRs in the atrazine lean males (ALM) (). The DMR locations, genomic features, statistics, log-fold change (max LFC) for increase (+) or decrease (-) in DNA methylation, CpG density, and gene associations are presented in lists of these DMR in Tables S1-S8.
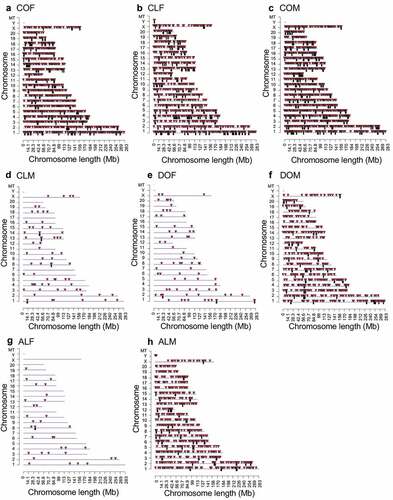
Chromosomal locations of the DMRs were examined for each data set (). The red arrowheads indicate the locations of the DMRs, and black boxes indicate clusters of DMRs. The biological significance of DMR clusters may be to potentially act with non-coding RNA within the epigenetic control regions [Citation56]. Most comparison groups have DMR dispersed on the majority of chromosomes (). Most DMRs identified are present in low density CpG genomic areas with 1 or 2 CpGs per 100 base pairs (Figure S1A-S1H) and the majority of the DMR have a length of 1-2kb (Figure S2A-S2H). This indicates that the majority of the DMRs occur genome wide in areas of low CpG density called CpG deserts [Citation57].
Figure 2. DMR chromosomal locations. The DMR locations on the individual chromosomes for all DMRs at a p-value threshold of <1e-05. (a) Control obese female DMRs. (b) Control lean female DMRs. (c) Control obese male DMRs. (d) Control lean male DMRs. (e) DDT obese female DMRs. (f) DDT obese male DMRs. (g) Atrazine lean female DMRs. (h) Atrazine lean male DMRs. Red arrowheads indicate positions of DMRs and black boxes indicate clusters of DMRs.
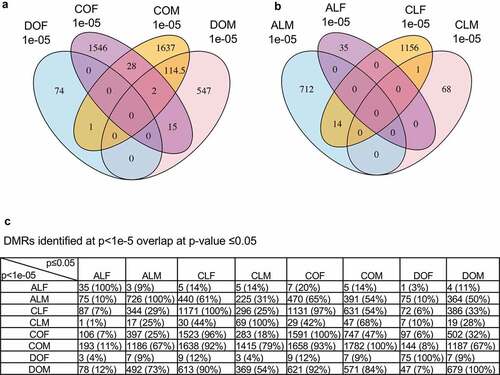
A comparison of the obese and lean adipocyte DMR was performed to identify DMR overlaps (). At a p ≤ 1e-05 there are 30 overlapping DMR when comparing control obese male and female DMR. At the same p-value there are 116 overlapping DMR when comparing control and DDT obese male DMR. There are also 17 overlapping DMR between the control obese female and DDT obese male DMR ()). At this p-value there was minimal or no overlap in the other groups (). A more extensive overlap is observed when the DMRs identified at p < 1e-05 are compared with a p < 0.05 for all other DMR sets, ). This shows a much higher overlap between the different DMRs when the statistical threshold for the comparison is lowered. Examining overlaps along the horizontal line provides the best comparisons. Interestingly, the obese male DMRs had strong overlap between the control male or female lean or obese DMR data sets, as well as with the DDT obese male DMRs. Good correlation between the control female lean or obese DMRs is also observed. Surprisingly, there was a large overlap (73%) between the DDT obese male DMR and Atrazine lean male DMR. These DMRs were associated with genes within 10 kb, so the promoter can be considered to identify associated genes. Overlapping DMR gene associations between the different comparisons were made.
Figure 3. DMR overlap. (a) DMR overlap for the obese and normal phenotypes within the control and DDT lineage colonies. (b) DMR overlap for the normal and lean phenotypes within the control and atrazine lineage colonies. (c) DMRs identified at p < 1e-5 overlap with other DMR sets at p-value ≤0.05. Overlap should be examined on the horizontal rows and show DMR numbers and percentages.
Gene and pathway DMR associations
The genes associated with the DMR were functionally categorized, as described in the Methods. The most predominant functional categories for DMR associated genes are signaling, metabolism, and transcription which are displayed in . Many DMRs occurred in the vicinity (within 10kb) of known genes, Tables S1-S8. Gene categories are presented for the obese associated DMRs in ) and for the gene categories for the lean associated DMRs in ). In addition, the DMR associated gene pathways were evaluated utilizing the KEGG database. The pathways having most DMR associated genes are presented in ). The top DMR associated gene pathways for COF, COM, and DOM were metabolic pathways. This was not an enrichment analysis, so no statistics are reported, only the pathway with the highest number of DMR associated genes. The top functional categories were PI3K-Akt signaling for DOF, viral carcinogenesis for ALF, pathways in cancer for ALM, metabolic pathways for CLF, and the insulin signaling pathways for CLM. Metabolic-related pathways did appear to be featured prominently, however further investigation of the significance was needed as KEGG features hundreds of genes in metabolic pathways. Literature searches of many of the genes revealed several genes associated with adipogenesis, adipocyte beiging/browning, insulin resistance, and lipolysis (Tables S1-S8).
Figure 4. DMR gene association categories and pathways. All DMRs at a p-value threshold of <1e-05 are shown. (a) Obese versus normal DMR associated gene categories. (b) Lean versus normal DMR associated gene categories. (c) DMR associated gene pathways from KEGG.
Common DMR associated genes affected between the control, DDT, and atrazine lineage males and female adipocytes were investigated in order to identify potential novel genes modulated by DNA methylation. Specific overlapping DMR were identified between the pathologies with the more stringent threshold of p ≤ 1e-05 (COF, CLF, COM, DOM, and ALM), . The negligible overlap was observed with the exception of the COM and DOM, ). The DMR sets were also compared with other DMR sets using a less stringent p-value of p ≤ 0.05 in order to assess a potential increased overlap between the groups. All DMR sets at p < 1e-05 were compared with DMR sets at p < 0.05, ). For example, COF DMRs at p ≤ 1e-05 were compared with CLF, COM, DOM, and ALM DMRs at p ≤ 0.05 to determine any overlapping DMR at a lower stringency, ). The percentage overlapping DMRs are also presented in ). These DMR were assessed for associated genes and the genes Caln1, Ikzf1, Iqsec3, Kcnma1, Ksr2, Mycbp2, Myo16, Negr1, Nr1h5, Rbms3, and Tmem236 were identified as being the most common (appeared in at least 3 out of 5 analyses) in all groups, . An extended list of all common DMR using 2 DMR sets in common are presented in Table S9. A literature search of these overlapping genes found a high correlation to obesity, type 2 diabetes, and metabolic syndrome [Citation58–Citation62], . Therefore, a number of adipocyte and metabolic disease related genes previously identified were associated with differentially methylated DMRs within the obese and lean phenotypes of the control and ancestrally exposed animals.
Figure 5. Common overlap adipocyte DMR associated genes and function. DMR with ≥3 overlaps with other DMR sets/phenotypes presented. The gene name and number of phenotypic associations (DMR sets overlap comparisons) are listed. The description of gene function category and general function presented.
Figure 6. DMR gene associations with metabolic disorders. DMR associated gene symbol correlations to metabolic diseases. An arrowhead indicates positive activation and line a negative effect.
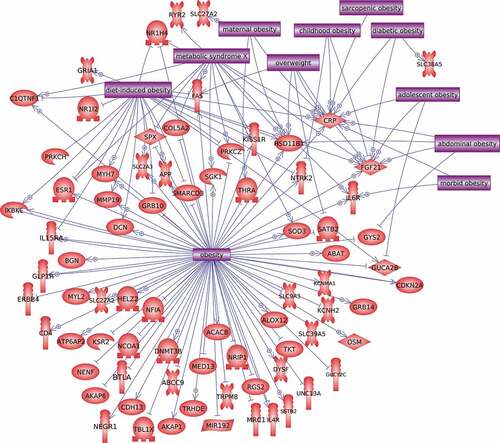
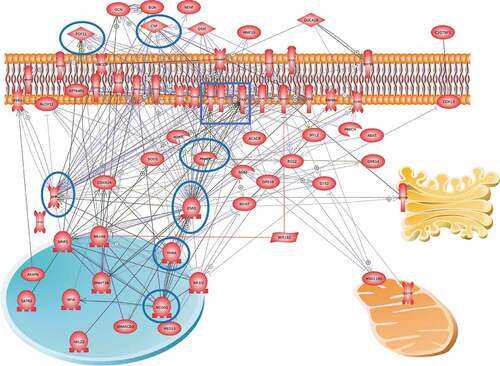
A further analysis correlated the common DMR associated genes with metabolic disease, obesity, diabetes and other related pathologies using the data mining tool Pathway Studio (Elsevier), as described in the Methods, . Those DMR associated genes known to be associated with these pathologies are presented in . In addition, a network of the most common overlapping associated genes () is presented in Figure S3. The full set of overlapping DMR associated genes in common with ≥ two different DMR sets were used in a gene network analysis, . Highly integrated genes are identified with circles. These associated genes, pathways, and networks are further discussed below as potential future novel therapeutic considerations for metabolic disease associated adipocytes.
Figure 7. Gene network of DMR associated gene correlations with obesity. Potential therapeutic targets are suggested, and highly integrated genes indicated with blue circle around the gene(s).
Discussion
Previous studies found an increased susceptibility to obesity in F3 generation rats ancestrally exposed to the pesticide DDT, and an increase in a lean phenotype in the F3 generation rats ancestrally exposed to the herbicide atrazine [Citation36,Citation37]. The present study investigated whether there were common DMR and associated genes between the control, DDT, and atrazine lineage male and female adipocytes in order to identify potential novel gene pathways modulated by DNA methylation. There was minimal overlap between the DMR comparisons at p ≤ 1e-05 due to the high stringency used to identify specific DMR in each group for gene associations (). An additional analysis with a p < 1e-03 threshold identified 241 DMR in common between the control obese females, control lean females, control obese males, DDT obese males, and atrazine lean males, despite their different treatment groups and phenotypes. Therefore, both these relaxed p-value threshold comparisons identified a substantial overlap between the DMR sets. Although the identification of DMR was based within the treatment group and sex of the animals to identify specific DMRs for the phenotype to prevent the confounding factors of sex and ancestral treatment, overlap was observed. The pathways unique to each treatment group may be relevant to the specific phenotype’s etiology.
The genes associated with the DMR were functionally categorized and evaluated for gene pathway association utilizing the KEGG database, as described in the Methods. Several metabolic related pathways were identified, and literature searches of many of the genes revealed several genes associated with adipogenesis [Citation63,Citation64] adipocyte beiging/browning [Citation65,Citation66], insulin resistance [Citation67–Citation69], and lipolysis [Citation70,Citation71]. Changes in these functions in the adipocyte and adipocyte precursors may promote obesity and metabolic dysregulation [Citation72]. Interestingly, there were substantial overlaps in the DMRs identified in the lean and obese animals between the different ancestral exposure lineage groups. The common genes and pathways affected were then investigated in order to elucidate potential novel genes and pathways modulated by DNA methylation.
The overlapping DMR identified with reduced stringency included several genes previously correlated with obesity, type 2 diabetes, and metabolic syndrome (). The methylation patterns in these regions identify common genes affected in both the lean and obese phenotypes. The most common genes identified were Caln1, Ikzf1, Iqsec3, Kcnma1, Ksr2, Mycbp2, Myo16, Negr1, Nr1h5, Rbms3, and Tmem236. The Kcnma1 gene is inhibited in obese animals being fed a high fat diet and modulates the insulin signaling pathway with a phenotype of increased fat tissue mass and decreased muscle mass [Citation59]. Ksr2 is a gene that is highly relevant to obesity and type 2 diabetes. Changes in expression can lead to increased energy intake and insulin resistance in addition to decreased energy expenditure [Citation60]. Mycbp2 is also known as Pam or Protein Associated with MYC [Citation55]. MYCBP2 is essential for the function of MYC, a regulator of adipogenesis [Citation73,Citation74]. No previous studies have investigated the relevance of MYCBP2 to adipogenesis. Similarly, Nr1h5, also known as FXRβ has no known relation to adipogenesis in the literature. However, FXRβ heterodimerizes with Retinoic acid receptor-alpha (RXR-α), increasing transcription of the gene [Citation75]. RXR-α is highly relevant to adipogenesis and lipolysis [Citation76]. Therefore, Mycbp2 and Nr1h5 should be investigated as potential novel genes modulating adipogenesis. It is important to note that Nr1h5 is considered a pseudogene that appears to have lost functional capacity in humans [Citation55], however, it is still functional in rats so the results for this gene are relevant to this study, but may not be translatable to human medicine. Tmem236 has few mentions in the literature, however, it is highly expressed in pancreatic α cells that secrete glucagon, elevating blood glucose [Citation55]. A recent study hypothesizes that up-regulation of Tmem236 may be linked to insulin resistance, however, this has not been demonstrated [Citation77]. SNPs in areas of the genome surrounding Myo16 have been implicated in increased risk for metabolic syndrome, but the functional link has not been identified [Citation61]. IKZF1 is a DNA-binding protein associated with chromatin remodelling and mutation or deletion of the gene is associated with various cancers [Citation55]. Ikzf1 is primarily expressed in leukocytes, but there is evidence of increased expression in adipocyte nuclei, and may therefore be relevant to adipocyte function [Citation58]. Caln1 is primarily expressed in the brain, and there is no known link to adiposity or adipocyte function [Citation55]. Both Iqsec3 and Rbms3 have increased expression in adipose tissue, however, neither of these genes have been investigated for relevance to adipose or adipocyte function [Citation55]. Despite the unknown significance of Mycbp2, Myo16, Ikzf1, Caln1, Iqsec3, and Rbms3 to obesity, metabolic disorders, adipose tissue, or adipocyte function, these genes should be explored as potential novel modulators of adipocyte and metabolic function due to the findings of this analysis. The regulatory impacts of DNA methylation on these genes should be further investigated with transcriptome analysis to identify potential obesity therapeutic development and treatments.
The final analysis identified a gene network involving all the DMR associated genes that had overlap with ≥ two DMR sets. This gene network () identified a number of cellular signaling pathways and transcriptional regulatory factors that were highly integrated. These genes and pathways also suggest potential therapeutic targets for adipocytes. A highly integrated gene is the estrogen receptor (ESR1) that is known to be associated with obesity and metabolic disease [Citation78]. A pharmaceutical that regulates the ESR1 developed for breast cancer therapy is tamoxifen [Citation78–Citation80]. Some links with tamoxifen and protective effects against obesity and metabolic syndrome have been observed including retained insulin sensitivity and adipocyte browning [Citation81,Citation82]. The PRKCG gene is highly integrated in the network, and has been shown to be linked to obesity [Citation83]. The thyroid hormone receptor activator THRA gene is integrated and linked to obesity [Citation84–Citation86]. The NCOA1 gene in adipocytes has also been shown to be associated with metabolic disease [Citation87–Citation89]. The KSR2 gene [Citation60,Citation90,Citation91] and FGF21 [Citation92–Citation94] are also integrated genes in the network associated with obesity, and S3. Therefore, a number of the genes and pathways identified in and S3 provide potential therapeutic targets for adipocytes associated with obesity and metabolic disease. Further investigation of these potential therapeutic targets needs to be considered in future studies and therapy development for metabolic syndrome.
While there were several common DMR associated with a change in adipocyte phenotype, there were a multitude of DMR that were unique within each phenotype, sex, and treatment group. These results are consistent with the previous studies that identified unique sperm DNA methylation pattern biomarkers associated with the lean phenotype from ancestral exposure to atrazine [Citation37] and the obese phenotype following ancestral exposure to DDT [Citation36]. Additionally, there were epigenomic changes in the obese and lean phenotypes within the control population. This supports the concept that obesity is a multi-faceted disease with likely multiple etiologies involved including direct and ancestral exposure to environmental toxicants.
DDT has potential to be a contributor to obesity as it was one of the most common insecticides used to combat insect disease vectors [Citation95]. While DDT was banned in 1973 in the USA, it is highly persistent in the environment, and measurable quantities of DDT are still detected in food commodities [Citation96]. A number of epidemiological studies have suggested that direct exposure to DDT and its metabolites is associated with an increase in obesity and insulin resistance [Citation97,Citation98]. The recent evidence of transgenerational susceptibility to obesity in rats ancestrally exposed to DDT [Citation27,Citation36] suggests there may be substantial effects on public health and the environment [Citation99]. Given that the first widespread exposures to gestating human females started in the 1950s, the majority of the subsequent F3 generation are adults today. Therefore, ancestral exposures to environmental toxicants like DDT may have had a role in the dramatic rise in obesity rates worldwide. Further studies identifying adipocyte epigenomic changes within the human population will be valuable for assessing obesogenic impacts of environmental toxicants.
Atrazine (1-Chloro-3-ethylamino-5-isopropylamino-2,4,6-triazine) has been one of the most widely used herbicides worldwide and has been shown to persist in groundwater for over a year after application [Citation100,Citation101]. A lean phenotype in the F1 generation of rats exposed to atrazine in utero is observed and this lean phenotype is transgenerationally inherited in the F3 generation [Citation37]. A lean phenotype may then be just as significant as an obese phenotype in investigating the etiology of metabolic disease and adipocyte abnormalities. Animals that have had a lipectomy, lipotoxicity, or lipodystrophy have exacerbated metabolic disease with low BMI and weight. Adipocyte cell size abnormalities also can indicate a metabolic syndrome even in a non-obese or lean animal [Citation102–Citation104]. More recently, some studies have found that gaining more adipose tissue actually has a protective action against metabolic syndrome suggesting that fat storage capacity in the adipocytes is an important factor in insulin resistance [Citation105]. When the amount of adipocytes capable of lipid storage is reduced, metabolic disease is exacerbated despite dramatic weight loss [Citation104]. Decreased adipocyte capacity increases the concentration of circulating fatty acids and triglycerides, increasing lipid accumulation in the liver, which in turn intensifies metabolic syndrome [Citation106]. Therefore, the metabolic impact of the atrazine transgenerational lean phenotype should be further investigated for changes in insulin sensitivity, serum triglycerides, and ectopic fat deposition.
Conclusions
In summary, this study indicated that ancestral exposure to the environmental toxicants atrazine and DDT can promote DNA methylation changes in adipocytes. These differential DNA methylated regions may contribute to changes in adipocyte differentiation and metabolic dysregulation. Further studies are needed to investigate if similar epigenetic mechanisms are present in the visceral adipocytes of lean and obese humans. Ancestral exposures to environmental toxicants and epigenetic transgenerational inheritance needs to be considered in the pathogenesis of obesity and metabolic disease.
Authors’ contributions
SEK formal analysis, investigation, methodology, validation, writing – original draft, review and editing.
EN formal analysis, validation, writing – review and editing.
DB data curation, formal analysis, investigation, methodology, validation, writing – review and editing.
MKS conceptualization, funding acquisition, project administration, supervision, validation, writing – review and editing.
Availability of data and material
All molecular data has been deposited into the public database at NCBI (GEO # GSE137536).
Ethics approval
All experimental protocols for the rat procedures were pre-approved by the Washington State University Animal Care and Use Committee (IACUC approval #6252).
Supplemental Material
Download Zip (4 MB)Acknowledgments
We acknowledge Ms. Michelle Pappalardo and Dr. Ingrid Sadler-Riggleman for technical assistance. We acknowledge Ms. Amanda Quilty for editorial assistance and Ms. Heather Johnson for assistance in preparation of the manuscript. We thank the Genomics Core laboratory at WSU Spokane for sequencing data. This study was supported by John Templeton Foundation (50183 and 61174) grants to MKS and a Gerber Foundation (3631) grant to MKS.
Disclosure statement
No potential conflict of interest was reported by the authors.
Supplementary material
Supplemental data for this article can be accessed here.
Additional information
Funding
References
- WHO. Obesity and Overweight: world Health Organization; 2017 Available from: http://www.who.int/en/news-room/fact-sheets/detail/obesity-and-overweight
- WHO. Global status report on noncommuncable diseases: world Health Organization; 2014 Available from: http://apps.who.int/iris/bitstream/10665/148114/1/9789241564854_eng.pdf.
- Hales CM, Carroll MD, Fryar CD, et al. Prevalence of obesity among adults and youth: United States, 2015–2016. Hyattsville, MD: National Center for Health Statistics. NCHS data brief. 2017 (288).
- Alberti KG, Eckel RH, Grundy SM, et al. Harmonizing the metabolic syndrome: a joint interim statement of the international diabetes federation task force on epidemiology and prevention; national heart, lung, and blood institute; American heart association; world heart federation; international atherosclerosis society; and international association for the study of obesity. Circulation. 2009;120(16):1640–1645.
- Marchesini G, Brizi M, Bianchi G, et al. Nonalcoholic fatty liver disease: a feature of the metabolic syndrome. Diabetes. 2001;50(8):1844–1850.
- Ninomiya JK, L’Italien G, Criqui MH, et al. Association of the metabolic syndrome with history of myocardial infarction and stroke in the third national health and nutrition examination survey. Circulation. 2004;109(1):42–46.
- Thomas G, Sehgal AR, Kashyap SR, et al. Metabolic syndrome and kidney disease: a systematic review and meta-analysis. Clin J Am Soc Nephrol. 2011;6(10):2364–2373.
- Brown RE, Sharma AM, Ardern CI, et al. Secular differences in the association between caloric intake, macronutrient intake, and physical activity with obesity. Obes Res Clin Pract. 2016;10(3):243–255.
- Hales CN, Barker DJ. The thrifty phenotype hypothesis. Br Med Bull. 2001;60:5–20.
- Hanson MA, Gluckman PD. Early developmental conditioning of later health and disease: physiology or pathophysiology? Physiol Rev. 2014;94(4):1027–1076.
- Barker DJ. Intrauterine programming of coronary heart disease and stroke. Acta Paediatrica. 1997;423: 178–182. discussion 83.
- Barker DJ. The developmental origins of chronic adult disease. Acta Paediatr Suppl. 2004;93(446):26–33.
- Vandenberg LN, Colborn T, Hayes TB, et al. Hormones and endocrine-disrupting chemicals: low-dose effects and nonmonotonic dose responses. Endocr Rev. 2012;33(3):378–455.
- Heindel JJ, Blumberg B, Cave M, et al. Metabolism disrupting chemicals and metabolic disorders. Reprod Toxicol. 2017;68:3–33.
- Grun F, Blumberg B. Environmental obesogens: organotins and endocrine disruption via nuclear receptor signaling. Endocrinology. 2006;147(6 Suppl):S50–5.
- Chamorro-Garcia R, Blumberg B. Transgenerational effects of obesogens and the obesity epidemic. Curr Opin Pharmacol. 2014;19:153–158.
- Moreno-Navarrete JM, Fernández-Real JM. Adipocyte differentiation. In: Symonds ME, editor. Adipose tissue biology: springer science+business media. New York, NY: pringer; 2012. p. 17–38.
- Kershaw EE, Flier JS. Adipose tissue as an endocrine organ. J Clin Endocrinol Metab. 2004;89(6):2548–2556.
- Nilsson E, Klukovich R, Sadler-Riggleman I, et al. Environmental toxicant induced epigenetic transgenerational inheritance of ovarian pathology and granulosa cell epigenome and transcriptome alterations: ancestral origins of polycystic ovarian syndrome and primary ovarian insufiency. Epigenetics. 2018;13(8):875–895.
- Klose RJ, Bird AP. Genomic DNA methylation: the mark and its mediators. Trends Biochem Sci. 2006;31(2):89–97.
- Murphy SK, Jirtle RL. Imprinting evolution and the price of silence. BioEssays. 2003;25(6):577–588.
- Das R, Hampton DD, Jirtle RL. Imprinting evolution and human health. Mammalian Genome. 2009;20(9–10):563–572.
- Jirtle RL, Skinner MK. Environmental epigenomics and disease susceptibility. Nat Rev Genet. 2007;8(4):253–262.
- Skinner MK, Anway MD. Seminiferous cord formation and germ-cell programming: epigenetic transgenerational actions of endocrine disruptors. Ann N Y Acad Sci. 2005;1061:18–32.
- Manikkam M, Tracey R, Guerrero-Bosagna C, et al. Dioxin (TCDD) induces epigenetic transgenerational inheritance of adult onset disease and sperm epimutations. PloS One. 2012;7(9):1–15. e46249
- Tracey R, Manikkam M, Guerrero-Bosagna C, et al. (jet fuel JP-8) induce epigenetic transgenerational inheritance of obesity, reproductive disease and sperm epimutations. Reprod Toxicol. 2013;36:104–116.
- Skinner MK, Manikkam M, Tracey R, et al. Ancestral dichlorodiphenyltrichloroethane (DDT) exposure promotes epigenetic transgenerational inheritance of obesity. BMC Med. 2013;11(228):1–16.
- Manikkam M, Haque MM, Guerrero-Bosagna C, et al. Pesticide methoxychlor promotes the epigenetic transgenerational inheritance of adult onset disease through the female germline. PloS One. 2014;9(7): 1–19. e102091.
- Manikkam M, Tracey R, Guerrero-Bosagna C, et al. Plastics derived endocrine disruptors (BPA, DEHP and DBP) induce epigenetic transgenerational inheritance of obesity, reproductive disease and sperm epimutations. PloS One. 2013;8(1):1–18. e55387
- Chamorro-Garcia R, Diaz-Castillo C, Shoucri BM, et al. Ancestral perinatal obesogen exposure results in a transgenerational thrifty phenotype in mice. Nat Commun. 2017;8(1):2012.
- Chamorro-Garcia R, Sahu M, Abbey RJ, et al. Transgenerational inheritance of increased fat depot size, stem cell reprogramming, and hepatic steatosis elicited by prenatal exposure to the obesogen tributyltin in mice. Environ Health Perspect. 2013;121(3):359–366.
- Wu H, Sun YE. Epigenetic regulation of stem cell differentiation. Pediatr Res. 2006;59(4 Pt 2):21R–5R.
- Bloushtain-Qimron N, Yao J, Shipitsin M, et al. Epigenetic patterns of embryonic and adult stem cells. Cell Cycle. 2009;8(6):809–817.
- Bloushtain-Qimron N, Yao J, Snyder EL, et al. Cell type-specific DNA methylation patterns in the human breast. Proc Natl Acad Sci U S A. 2008;105(37):14076–14081.
- Planat-Benard V, Silvestre JS, Cousin B, et al. Plasticity of human adipose lineage cells toward endothelial cells: physiological and therapeutic perspectives. Circulation. 2004;109(5):656–663.
- King SE, McBirney M, Beck D, et al. Sperm epimutation biomarkers of obesity and pathologies following DDT induced epigenetic transgenerational inheritance of disease. Environ Epigenet. 2019;5(2):1–15. dvz008
- McBirney M, King SE, Pappalardo M, et al. Atrazine induced epigenetic transgenerational inheritance of disease, lean phenotype and sperm epimutation pathology biomarkers. PloS One. 2017;12(9):1–37. e0184306
- Guerrero-Bosagna C, Savenkova M, Haque MM, et al. Environmentally induced epigenetic transgenerational inheritance of altered sertoli cell transcriptome and epigenome: molecular etiology of male infertility. PloS One. 2013;8(3):1–12. e59922
- Klukovich R, Nilsson E, Sadler-Riggleman I, et al. Environmental toxicant induced epigenetic transgenerational inheritance of prostate pathology and stromal-epithelial cell epigenome and transcriptome alterations: ancestral origins of prostate disease. Sci Rep. 2019;9(2209):1–17.
- Chusyd DE, Wang D, Huffman DM, et al. Relationships between rodent white adipose fat pads and human white adipose fat depots. Front Nutr. 2016;3:10.
- Galarraga M, Campion J, Munoz-Barrutia A, et al. Adiposoft: automated software for the analysis of white adipose tissue cellularity in histological sections. J Lipid Res. 2012;53(12):2791–2796.
- Alkhouri N, Gornicka A, Berk MP, et al. Adipocyte apoptosis, a link between obesity, insulin resistance, and hepatic steatosis. J Biol Chem. 2010;285(5):3428–3438.
- Kerr AG, Sinha I, Dadvar S, et al. Epigenetic regulation of diabetogenic adipose morphology. Mol Metab. 2019;25:159–167.
- Manikkam M, Guerrero-Bosagna C, Tracey R, et al. Transgenerational actions of environmental compounds on reproductive disease and identification of epigenetic biomarkers of ancestral exposures. PloS One. 2012;7(2):1–12. e31901
- Bolger AM, Lohse M, Usadel B. Trimmomatic: a flexible trimmer for Illumina sequence data. Bioinformatics. 2014;30(15):2114–2120.
- Langmead B, Salzberg SL. Fast gapped-read alignment with Bowtie 2. Nat Methods. 2012;9(4):357–359.
- Lienhard M, Grimm C, Morkel M, et al. MEDIPS: genome-wide differential coverage analysis of sequencing data derived from DNA enrichment experiments. Bioinformatics. 2014;30(2):284–286.
- Robinson MD, McCarthy DJ, Smyth GK. edgeR: a Bioconductor package for differential expression analysis of digital gene expression data. Bioinformatics. 2010;26(1):139–140.
- Durinck S, Spellman PT, Birney E, et al. Mapping identifiers for the integration of genomic datasets with the R/Bioconductor package biomaRt. Nat Protoc. 2009;4(8):1184–1191.
- Cunningham F, Amode MR, Barrell D, et al. Ensembl 2015. Nucleic Acids Res. 2015;43(Databaseissue):D662–9.
- Kanehisa M, Goto S. KEGG: kyoto encyclopedia of genes and genomes. Nucleic Acids Res. 2000;28(1):27–30.
- Kanehisa M, Goto S, Sato Y, et al. Data, information, knowledge and principle: back to metabolism in KEGG. Nucleic Acids Res. 2014;42(Databaseissue):D199–205.
- Huang da W, Sherman BT, Lempicki RA. Systematic and integrative analysis of large gene lists using DAVID bioinformatics resources. Nat Protoc. 2009;4(1):44–57.
- Mi H, Muruganujan A, Casagrande JT, et al. Large-scale gene function analysis with the PANTHER classification system. Nat Protoc. 2013;8(8):1551–1566.
- Gene. National Library of Medicine (US), National Center for Biotechnology Information Bethesda (MD)2004 Available from: https://www.ncbi.nlm.nih.gov/gene/.
- Skinner MK, Manikkam M, Haque MM, et al. Epigenetic transgenerational inheritance of somatic transcriptomes and epigenetic control regions. Genome Biol. 2012;13(10):R91.
- Skinner MK, Guerrero-Bosagna C. Role of CpG deserts in the epigenetic transgenerational inheritance of differential DNA methylation regions. BMC Genomics. 2014;15(1):692.
- Ambati S, Yu P, McKinney EC, et al. Adipocyte nuclei captured from VAT and SAT. BMC Obes. 2016;3:35.
- Nishizuka M, Horinouchi W, Yamada E, et al. KCNMA1, a pore-forming alpha-subunit of BK channels, regulates insulin signalling in mature adipocytes. FEBS Lett. 2016;590(23):4372–4380.
- Pearce LR, Atanassova N, Banton MC, et al. KSR2 mutations are associated with obesity, insulin resistance, and impaired cellular fuel oxidation. Cell. 2013;155(4):765–777.
- Nakatochi M, Ushida Y, Yasuda Y, et al. Identification of an interaction between VWF rs7965413 and platelet count as a novel risk marker for metabolic syndrome: an extensive search of candidate polymorphisms in a case-control study. PloS One. 2015;10(2):e0117591.
- Joo Y, Kim H, Lee S, et al. Neuronal growth regulator 1-deficient mice show increased adiposity and decreased muscle mass. Int J Obes. 2019; 43:1769–1782.
- Graham SJ, Black MJ, Soboloff J, et al. Stim1, an endoplasmic reticulum Ca2+ sensor, negatively regulates 3T3-L1 pre-adipocyte differentiation. Differentiation. 2009;77(3):239–247.
- van Beekum O, Gao Y, Berger R, et al. A novel RNAi lethality rescue screen to identify regulators of adipogenesis. PloS One. 2012;7(6):e37680.
- Bagchi RA, Ferguson BS, Stratton MS, et al. HDAC11 suppresses the thermogenic program of adipose tissue via BRD2. JCI Insight. 2018;3:15.
- McDonald ME, Li C, Bian H, et al. Myocardin-related transcription factor A regulates conversion of progenitors to beige adipocytes. Cell. 2015;160(1–2):105–118.
- Zhao Q, Hou J, Chen B, et al. Prenatal cocaine exposure impairs cognitive function of progeny via insulin growth factor II epigenetic regulation. Neurobiol Dis. 2015;82:54–65.
- Deng W, Wang X, Xiao J, et al. Loss of regulator of G protein signaling 5 exacerbates obesity, hepatic steatosis, inflammation and insulin resistance. PloS One. 2012;7(1):e30256.
- Crowley RK, O’Reilly MW, Bujalska IJ, et al. SFRP2 Is Associated with Increased Adiposity and VEGF Expression. PloS One. 2016;11(9):e0163777.
- Lee KY, Yamamoto Y, Boucher J, et al. Shox2 is a molecular determinant of depot-specific adipocyte function. Proc Natl Acad Sci U S A. 2013;110(28):11409–11414.
- Nordstrom SM, Tran JL, Sos BC, et al. Disruption of JAK2 in adipocytes impairs lipolysis and improves fatty liver in mice with elevated GH. Mol Endocrinol. 2013;27(8):1333–1342.
- Symonds MEE. Adipose tissue biology. New York: Springer-Verlag; 2012. VI, 414 p.
- Guo Q, Xie J, Dang CV, et al. Identification of a large Myc-binding protein that contains RCC1-like repeats. Proc Natl Acad Sci U S A. 1998;95(16):9172–9177.
- Deisenroth C, Black MB, Pendse S, et al. MYC is an early response regulator of human adipogenesis in adipose stem cells. PloS One. 2014;9(12):e114133.
- Otte K, Kranz H, Kober I, et al. Identification of farnesoid X receptor beta as a novel mammalian nuclear receptor sensing lanosterol. Mol Cell Biol. 2003;23(3):864–872.
- Imai T, Jiang M, Chambon P, et al. Impaired adipogenesis and lipolysis in the mouse upon selective ablation of the retinoid X receptor alpha mediated by a tamoxifen-inducible chimeric Cre recombinase (Cre-ERT2) in adipocytes. Proc Natl Acad Sci U S A. 2001;98(1):224–228.
- Wang L, Norris ET, Jordan IK. Human retrotransposon insertion polymorphisms are associated with health and disease via gene regulatory phenotypes. Front Microbiol. 2017;8:1418.
- Goodwin PJ. Obesity and endocrine therapy: host factors and breast cancer outcome. Breast. 2013;22(Suppl 2):S44–7.
- Liu L, Zou P, Zheng L, et al. Tamoxifen reduces fat mass by boosting reactive oxygen species. Cell Death Dis. 2015;6:e1586.
- Birzniece V, Ho KK. Estrogen receptor antagonism uncovers gender-dimorphic suppression of whole body fat oxidation in humans: differential effects of tamoxifen on the GH and gonadal axes. Eur J Endocrinol. 2015;173(4):479–487.
- Guillaume M, Handgraaf S, Fabre A, et al. Selective activation of estrogen receptor alpha activation function-1 is sufficient to prevent obesity, steatosis, and insulin resistance in mouse. Am J Pathol. 2017;187(6):1273–1287.
- Zhao L, Wang B, Gomez N, et al. Even a low dose of tamoxifen profoundly induces adipose tissue browning in female mice. Int J Obesity. 2019;Published Online:1–9.
- Mansego ML, Milagro FI, Zulet MA, et al. Differential DNA methylation in relation to age and health risks of obesity. Int J Mol Sci. 2015;16(8):16816–16832.
- Kurylowicz A, Jonas M, Lisik W, et al. Obesity is associated with a decrease in expression but not with the hypermethylation of thermogenesis-related genes in adipose tissues. J Transl Med. 2015;13:31.
- Fernandez-Real JM, Corella D, Goumidi L, et al. Thyroid hormone receptor alpha gene variants increase the risk of developing obesity and show gene-diet interactions. Int J Obes (Lond). 2013;37(11):1499–1505.
- Pelletier P, Gauthier K, Sideleva O, et al. Mice lacking the thyroid hormone receptor-alpha gene spend more energy in thermogenesis, burn more fat, and are less sensitive to high-fat diet-induced obesity. Endocrinology. 2008;149(12):6471–6486.
- Meerson A, Yehuda H. Leptin and insulin up-regulate miR-4443 to suppress NCOA1 and TRAF4, and decrease the invasiveness of human colon cancer cells. BMC Cancer. 2016;16(1):882.
- Mohsen GA, Abu-Taweel GM, Rajagopal R, et al. Betulinic acid lowers lipid accumulation in adipocytes through enhanced NCoA1-PPARgamma interaction. J Infect Public Health. 2019; 12(5):726-732.
- Tateishi K, Okada Y, Kallin EM, et al. Role of Jhdm2a in regulating metabolic gene expression and obesity resistance. Nature. 2009;458(7239):757–761.
- Henry MD, Costanzo-Garvey DL, Klutho PJ, et al. Obesity-dependent dysregulation of glucose homeostasis in kinase suppressor of ras 2-/- mice. Physiol Rep. 2014;2:7.
- Pilbrow AP. Discovery of an obesity susceptibility gene, KSR2, provides new insight into energy homeostasis pathways. Circ Cardiovasc Genet. 2014;7(2):218–219.
- Kruse R, Vienberg SG, Vind BF, et al. Effects of insulin and exercise training on FGF21, its receptors and target genes in obesity and type 2 diabetes. Diabetologia. 2017;60(10):2042–2051.
- Babaknejad N, Nayeri H, Hemmati R, et al. An overview of FGF19 and FGF21: the therapeutic role in the treatment of the metabolic disorders and obesity. Horm Metab Res. 2018;50(6):441–452.
- Sonoda J, Chen MZ, Baruch A. FGF21-receptor agonists: an emerging therapeutic class for obesity-related diseases. Horm Mol Biol Clin Investig. 2017;30:2.
- van den Berg H. Global status of DDT and its alternatives for use in vector control to prevent disease. Environ Health Perspect. 2009;117(11):1656–1663.
- CDC. Toxicological Profile for DDT, DDE, and DDD: center for Disease Control; 2002 Available from: https://www.atsdr.cdc.gov/toxprofiles/tp35.pdf
- Lee DH, Porta M, Jacobs DR Jr., et al. Chlorinated persistent organic pollutants, obesity, and type 2 diabetes. Endocr Rev. 2014;35(4):557–601.
- Rignell-Hydbom A, Lidfeldt J, Kiviranta H, et al. Exposure to p,p’-DDE: a risk factor for type 2 diabetes. PloS One. 2009;4(10):e7503.
- Kabasenche WP, Skinner MK. DDT, epigenetic harm, and transgenerational environmental justice. Environ Health. 2014;13:62.
- Solomon KR, Baker DB, Richards RP, et al. Ecological risk assessment of atrazine in North American surface waters. Environ Toxicol Chem. 1996;15(1):31–76.
- Kookana R, Holz G, Barnes C, et al. Impact of climatic and soil conditions on environmental fate of atrazine used under plantation forestry in Australia. J Environ Manage. 2010;91(12):2649–2656.
- Cinti S, Mitchell G, Barbatelli G, et al. Adipocyte death defines macrophage localization and function in adipose tissue of obese mice and humans. J Lipid Res. 2005;46(11):2347–2355.
- Morris DL, Evans-Molina C. Metabolic dysfunction and adipose tissue macrophages: is there more to glean from studying the lean?: comment on “Adipose tissue infiltration in normal-weight subjects and its impact on metabolic function” by Moreno-Indias et al. Transl Res. 2016;172:1–5.
- Pajvani UB, Trujillo ME, Combs TP, et al. Fat apoptosis through targeted activation of caspase 8: a new mouse model of inducible and reversible lipoatrophy. Nat Med. 2005;11(7):797–803.
- Grundy SM. Adipose tissue and metabolic syndrome: too much, too little or neither. Eur J Clin Invest. 2015;45(11):1209–1217.
- Muller G, Wied S, Dearey EA, et al. Lipid storage in large and small rat adipocytes by vesicle-associated glycosylphosphatidylinositol-anchored proteins. Results Probl Cell Differ. 2010;52:27–34.