
ABSTRACT
Macroscopic deposition of epicardial adipose tissue (EAT) has been strongly associated with numerous indices of obesity and cardiovascular disease risk. In contrast, the morphology of EAT adipocytes has rarely been investigated. We aimed to determine whether obesity-driven adipocyte hypertrophy, which is characteristic of other visceral fat depots, is found within EAT adipocytes. EAT samples were collected from cardiac surgery patients (n = 49), stained with haematoxylin & eosin, and analysed for mean adipocyte size and non-adipocyte area. EAT thickness was measured using echocardiography. A significant positive relationship was found between EAT thickness and body mass index (BMI). When stratified into standardized BMI categories, EAT thickness was 58.7% greater (p = 0.003) in patients from the obese (7.3 ± 1.8 mm) compared to normal (4.6 ± 0.9 mm) category. BMI as a continuous variable significantly correlated with EAT thickness (r = 0.56, p < 0.0001). Conversely, no correlation was observed between adipocyte size and either BMI or EAT thickness. No difference in the non-adipocyte area was found between BMI groups. Our results suggest that the increased macroscopic EAT deposition associated with obesity is not caused by adipocyte hypertrophy. Rather, alternative remodelling via adipocyte proliferation might be responsible for the observed EAT expansion.
Introduction
Epicardial adipose tissue (EAT) deposition has emerged as a novel clinical marker for systemic metabolic dysfunction and cardiovascular disease. When measured as either thickness or volume, macroscopic EAT deposition has been found to be strongly associated with measures of obesity and insulin resistance [Citation1–Citation3], as well as coronary artery disease [Citation4–Citation6] and atrial fibrillation [Citation7]. With regard to cardiovascular disease, EAT deposition often associates with greater strength than traditional anthropometric and biochemical risk factors, and might eventually serve as a predictive variable for adverse post-operative outcomes [Citation6,Citation7]. Despite the growing clinical interest and utilization of macroscopic EAT dimensions for risk stratification, study of how microscopic EAT morphology relates to macroscopic deposition in obesity has rarely been performed.
Adipose expansion in obesity occurs by two main morphological alterations to the constituent adipocytes: an increase in cell size (hypertrophy) and an increase in cell number (hyperplasia) [Citation8]. The relative contributions of trophic and plastic remodelling vary between different subcutaneous (SAT) and visceral adipose tissue (VAT) depots; however, hypertrophic growth seems to be the predominant mechanism in obesity [Citation8]. Consistently, an increase in the volume of various SAT depots, including at abdominal, femoral, and gluteal sites has been found to not only correlate with indices of obesity, like body mass index (BMI) and body fat percentage but also with the size of the adipocytes comprising each depot [Citation9–Citation16]. Similar associations have been reported between adipocyte size, adipose volume, and BMI in omental, retroperitoneal, and intraperitoneal VATs [Citation9,Citation10,Citation13]. No such investigations of EAT morphology have been undertaken.
Non-invasive imaging using two-dimensional EAT thickness and three-dimensional EAT volume has established a firm positive correlation between EAT deposition and BMI [Citation1–Citation3]. Furthermore, macroscopic quantification of EAT measured from post-mortem hearts has revealed a similar step-wise increase in overall EAT volume or thickness with increased myocardial mass [Citation17]. In contrast, EAT adipocyte morphology has a less defined relationship with BMI. Although early work seemed to suggest that mean EAT adipocyte size increased slightly with BMI in lean, overweight, and obese post-mortem cases [Citation18], recent intra-individual post-mortem analyses from our group found that unlike adipocytes from other SAT and VAT depots, EAT adipocyte size does not correlate with BMI [Citation19].
Unfortunately, quantification of EAT deposition was not accessible for our previous study [Citation19]. Therefore, for the current study, we utilized echocardiographic EAT thickness measured in cardiac surgery patients and assessed the relationship between the EAT thickness and the size of the adipocytes comprising the fat tissue. By doing so, we aimed to clarify whether hypertrophy is the dominant form of adipocyte remodelling in the well-established EAT expansion in obesity [Citation1–Citation3]. Interestingly, we have found that EAT thickness increases linearly with BMI, but this is not concurrent with hypertrophy of the paired EAT adipocytes. Additionally, the frequency distribution of adipocyte sizes revealed an increase in the proportion of smaller adipocytes within the EAT from obese patients relative to normal and overweight patients. This suggests that hyperplastic rather than hypertrophic remodelling of EAT adipocytes underlies macroscopic EAT expansion in obesity.
Methods
Patients
Patients undergoing cardiac surgery (n = 49) at Dunedin Hospital, New Zealand, provided informed consent for the collection of a sample of their EAT and their clinical data to be used for this study. All use was approved by the local Human Ethics Committee (Approval number: LRS12-01-001) and conformed to the principles outlined in the Declaration of Helsinki. The surgeries included lone coronary artery bypass grafting surgery (CABG) (n = 27) and aortic (n = 7) or mitral (n = 4) valve replacement or a combination (n = 11). In addition to the patient age and sex, other relevant anthropometric, biochemical, and haemodynamic preoperative patient information was made available for this study and is presented in . Patients were stratified into standardized BMI groups as follows: BMI < 25 kg/m2 = normal, ≥25 and <30 kg/m2 = overweight, ≥30 kg/m2 = obese[Citation20].
Table 1. Characteristics of patients by body mass index categories.
Echocardiography
All patients had a comprehensive echocardiogram obtained preoperatively using commercially available machines (Vivid E9 or E95, GE Healthcare, IL, USA). Images were recorded according to the recommendations of the American Society of Echocardiography [Citation21]. EAT thickness was assessed in the parasternal long axis view using a standardized method based on that of Iacobellis and Willens [Citation22]. Intra-observer and inter-observer variability were calculated from 21 randomly selected subjects with excellent agreement; inter-observer and intra-observer interclass correlation coefficients were both over 95%.
EAT procurement and processing
During surgery, an EAT biopsy was obtained from the right atrioventricular groove. The EAT was collected in standard chilled Krebs Henseleit Buffer containing (in mM) 118.5 NaCl, 4.5 KCl, 1.0 MgCl26H2O, 0.33 NaH2PO4, 25 NaHCO3, 11 glucose, and 0.5 CaCl2 that was previous bubbled with carbogen (95% O2 + 5% CO2). At the laboratory, the biopsy was fixed with formalin. The fixed tissue was then dehydrated, embedded in paraffin, and sectioned at 5 µm using a microtome. Each section was then stained with haematoxylin & eosin. Briefly, this involved deparaffinisation of each section using sequential xylene solution immersions (2 min per immersion). Rehydration of the sections was then achieved through sequential immersions in ethanol of decreasing concentrations (100%, 100%, 95% for 2 min each followed by 70% for 1 min). Following a 1-min wash in deionized water, the sections were immersed in Gillis haematoxylin for 4 min, water again for 2 min, Scott’s solution for 2 min, and finally for 30 s in eosin stain before a 1-min water rinse. Finalization of the stain was achieved by serial 100% ethanol immersions (30-s each) followed by serial xylene immersions (2 min each).
Measurement of adipocyte size
The fixed and stained EAT sections were scanned at 20x magnification using an Aperio Digital Slide Scanning System (Leica Biosystems Pathology Imaging, Germany) to generate a digital image of the section. Measurement of adipocyte size was performed using Aperio ImageScope software (Leica Biosystems Pathology Imaging, Germany). Briefly, using the Positive Pen Tool of the software, the border of every intact adipocyte contained within the field of view of each EAT image was traced. Then, based on the image resolution generated at section scanning, the area contained within each traced adipocyte was calculated. Adipocytes with a disrupted membrane border were not traced for analysis, nor were those with incomplete borders at the image frame. One section was imaged from each patient.
Measurement of non-adipocyte area
In the same sections used for EAT adipocyte size analysis, the relative non-adipocyte area, which comprises the stromal vascular fraction, was determined using ImageJ software (National Institutes of Health, Bethesda, MD, USA). Tagged imaged files imported into ImageJ using the Bio-Formats importer (Open Microscopy Environment, Dundee, UK) were analysed by determining the area and relative colour threshold of adipocytes within the field of view. Once determined, image area classified within the adipocyte colour threshold was deleted to render a measurable black background. The relative black (adipose) and non-black (non-adipose) areas were then quantified.
Data analysis
Analysis of EAT thickness and EAT adipocyte size was performed by a researcher blinded to the BMI of the patient and the corresponding EAT thickness/adipocyte size related to each patient. Data, including patient characteristics, are presented as mean values ± standard deviation (SD) or standard error (SEM) as appropriate. Differences in BMI-stratified data were assessed to be statistically significant by Fisher’s exact test or one-way ANOVA with post hoc Tukey’s multiple comparisons test as appropriate. The relationships between two continuous variables were determined using simple univariate Pearson correlation with fitted with linear regression. Additional adjustment for age, sex, and HbA1c was performed using multiple linear regression analyses. Adipocyte size frequency distribution curves were fitted based on the size of every adipocyte measured in each section. Differences for all data were deemed significant if p < 0.05. Data were analysed using GraphPad Prism 8 software (GraphPad Software Inc., La Jolla, CA, USA).
Results
Patient characteristics
In total, EAT was obtained from 49 patients undergoing cardiac surgery. When stratified into standardized BMI categories, 8 patients were defined as normal (average BMI = 23.3 ± 2.1 kg/m2), 28 as overweight (27.7 ± 1.5 kg/m2), and 13 as obese (33.2 ± 1.6 kg/m2). presents the average anthropometric, biochemical, and basic haemodynamic indices recorded from each patient within each BMI category. No differences in any patient characteristic was found between BMI groups. Additionally, no difference in mean adipocyte size was found between patients undergoing lone CABG surgery when compared to those undergoing lone aortic or mitral valves replacement surgeries (data not shown), as previously reported [Citation23,Citation24].
EAT thickness and BMI relationship
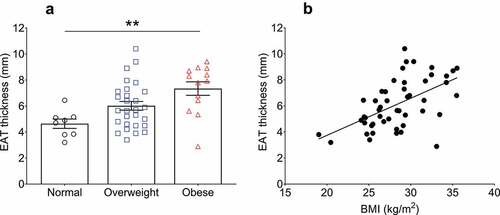
EAT thickness was measured using two-dimensional echocardiography in the parasternal long-axis view. The mean EAT thickness from the patient cohort was 6.1 ± 1.9 mm. When stratified, the mean thickness from patients within the normal BMI group was 4.6 ± 0.9 mm, whereas the EAT thickness of the overweight patients showed a non-significant increase of 30.4% (6.0 ± 1.7 mm, p = 0.122). The EAT of the obese patients was significantly thicker (7.3 ± 1.8 mm, p = 0.003) than normal BMI patients (, )). A trend towards an increased EAT thickness in obese compared to overweight patients was found (p = 0.064). To circumvent the limitations incurred by BMI categorization, including discrepancy in sample sizes, we performed correlation analyses to utilize BMI as a continuous variable ()). When correlated using univariate linear regression, a significant and robust positive association was found between EAT thickness and BMI (r = 0.56, p < 0.0001), even with adjustment for age, sex, and HbA1c (β = 0.29 ± 0.06 (SE), 95% confidence interval [CI]: 0.16 to 0.43, R2 (adjusted) = 0.27, p < 0.0001).
Figure 1. Relationship of epicardial adipose tissue (EAT) thickness with body mass index (BMI). (a) EAT thickness stratified into standardized BMI categories (normal <25 kg/m2, overweight ≥25 and <30 kg/m2, obese ≥30 kg/m2). The average BMI for each category was: normal patients (n = 8) = 23.3 ± 2.1 kg/m2, overweight patients (n = 28) = 27.7 ± 1.5 kg/m2, obese patients (n = 13) = 33.2 ± 1.6 kg/m2. Statistical differences in EAT thickness between the groups was determined using one-way ANOVA with post hoc Tukey’s multiple comparisons test. **p = 0.0028. Difference between overweight and obese patient EAT thicknesses p = 0.06. Data are presented as mean ± SEM. (b) Simple univariate correlation of EAT thickness vs BMI (range 19.0–35.5 kg/m2). A significant positive correlation was found between EAT thickness and BMI (r = 0.56, p < 0.0001). n = 49.
EAT adipocyte size and BMI relationship
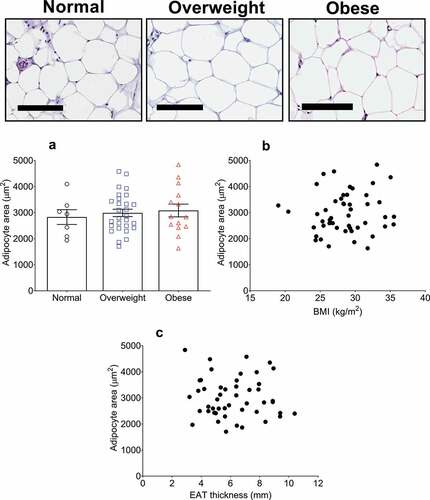
We have recently reported that the size of adipocytes comprising the EAT of 43 post-mortem cases have no association with BMI, neither when stratified into BMI categories nor when analysed using Pearson correlation[Citation19]. We aimed to corroborate these results in patients undergoing cardiac surgery in the current study. Representative images taken from the EAT sections used for adipocyte analysis are shown in . Quantification of the average adipocyte area, without adjustment for BMI, was 2991 ± 777 µm [Citation2]. With BMI categorization, no difference was found in average adipocyte size between the normal (2828 ± 693 µm2), overweight (2987 ± 734 µm2), and obese (3080 ± 881 µm2) groups (, )). Furthermore, no correlation was found between EAT adipocyte size and BMI using univariate correlation analysis (r = 0.11, p = 0.5) ()), or after adjustment for age, sex, and HbA1c (β = 37.12 ± 30.61, 95% CI: −0.24 to 98.80, R2 (adjusted) = 0.09, p = 0.2).
Figure 2. Epicardial adipose tissue (EAT) adipocyte size relationship with body mass index (BMI) and EAT thickness in cardiac surgery patients. Top panel shows representative images of haematoxylin & eosin stained EAT sections. From left to right, images are representative of normal (n = 8), overweight (n = 28), and obese (n = 13) patients as indicated. Scale bar indicates 100 µm. (a) Average adipocyte area is not different between any BMI category. Data are presented as means ± SEM. Statistical difference measured using one-way ANOVA with post hoc Tukey’s multiple comparisons test. (b) Adipocyte area does not correlate with BMI (range 19.0–35.5 kg/m2) or with EAT thickness (c) (r = 0.11, p = 0.5 and r = −0.07, p = 0.6, respectively) as assessed by univariate Pearson correlation. For B and C, n = 49.
EAT thickness and EAT adipocyte relationship
Macroscopic adipose deposition has been correlated with the constituent adipocyte size in many previous studies [Citation9–Citation13]. This includes SAT and VAT depots. To determine whether an analogous relationship exists with EAT thickness and EAT adipocyte size, we performed simple correlation analysis and found no correlation between the two parameters (r = −0.07, p = 0.6) ()).
Non-adipocyte area
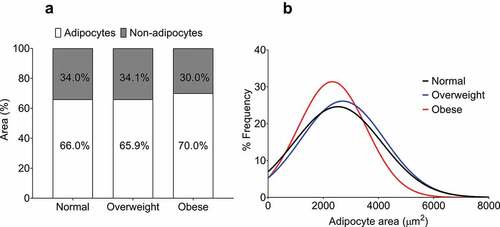
To determine whether the 58.7% thicker EAT in obese patients compared to normal patients might relate to an increase in non-adipocyte area (stromal vascular fraction and/or fibrosis), we also determined the relative non-adipocyte area within each section. The non-adipocyte area was remarkably similar between the three groups (normal: 34 ± 4.9%, overweight: 34.1 ± 5.3%, obese: 30.0 ± 3.8%, p = 0.6) ()).
Figure 3. Quantification of non-adipocyte area and epicardial adipocyte size frequency distribution in normal, overweight, and obese groups. (a) Non-adipocyte area is presented as a percentage relative to adipocyte area. No difference was found between the groups as assessed by one-way ANOVA (p = 0.55). (b) Curves fitted from the adipocyte size frequency distributions from normal (886 cells from 8 patients), overweight (1739 cells from 28 patients), and obese (1247 cells from 13 patients) BMI groups. The distribution from the obese group is relatively leftward and upward of the normal and overweight groups, indicating a higher proportion of smaller adipocytes.
Adipocyte size frequency distribution
By analysing the frequency distribution of EAT adipocyte size from each BMI group, we were able to provide a rough indication of whether an increase in adipocyte number (hyperplasia) could account for the increase in EAT thickness in obese patients. As shown in ), our analysis indicates a leftward and upward shift in the curve derived from the frequency distribution of EAT adipocytes from obese patients relative to the curves from both normal and overweight patients. This suggests that EAT from obese patients is comprised of a relatively greater proportion of smaller adipocytes.
Discussion
Based on studies of other SAT and VAT depots, which show a positive correlation in adipocyte size with adipose deposition [Citation9–Citation13], we hypothesized that an analogous relationship would exist within EAT. Interestingly, our data do not support our hypothesis, as no correlation could be found between EAT thickness and EAT adipocyte size. Moreover, we found that despite EAT thickness positively correlating with an increase in BMI, no such relationship exists for EAT adipocyte size. Increases in stromal vascular fractional or fibrotic deposits do not seem to account for the increased EAT thickness in obese individuals, whereas adipocyte size frequency distribution analysis suggests an increase in the number of adipocytes. Our main finding is therefore that the increased thickness of EAT in obesity is not associated with adipocyte hypertrophy, while our exploratory findings suggest that hyperplasia might instead underlie the expansion of EAT.
Adipose tissue and adipocyte size relationship
Total body fat deposition has been independently, and robustly, correlated with BMI and increased adipocyte size for SAT and VAT [Citation13,Citation16,Citation25,Citation26]. When measured specifically using computed tomography, dual-energy X-ray absorptiometry, or magnetic resonance imaging, the macroscopic deposition of numerous SAT and VAT depots have been shown to increase predictably with increased BMI [Citation14–Citation16]. The relationship between BMI and SAT mass, whether measured as anterior or posterior abdominal fat, has been reported with strong correlation coefficients ranging from 0.65 to 0.89 [Citation14–Citation16]. Similarly, intra-abdominal, intraperitoneal, and retroperitoneal VAT mass has been correlated with BMI with lesser coefficients between 0.32 and 0.58 [Citation14–Citation16]. Meta-analysis of non-invasively imaged EAT deposition has found a significant BMI association with average correlation coefficients of 0.47 and 0.43 for echocardiography and computed tomography studies, respectively [Citation1]. For the current study, we found that average EAT thickness measured by echocardiography is significantly greater in obese patients relative to patients with normal BMI ()), with thickness measures analogous to those reported previously for cohorts with similar BMI [Citation27]. Moreover, with univariate correlation, we found a robust correlation between EAT thickness and BMI (r = 0.56) ()), which agrees with data recently meta-analysed [Citation1]. Therefore, our data reinforce the finding that EAT thickness positively, and reproducibly, correlates with BMI.
We aimed to determine the microscopic adipocyte remodelling associated with this increased macroscopic EAT thickness. The sizes of adipocytes from various SAT and VAT depots have consistently been shown to positively correlate with BMI [Citation13,Citation28]. Moreover, this adipocyte hypertrophy has been comprehensively correlated with an increased deposition of the adipose depot that the cells comprise [Citation11–Citation13]. Cross-sectional studies found strong correlations between abdominal and femoral SAT adipocyte sizes and the area of the same SAT sites have found (coefficients typically 0.60 to 0.76) [Citation11–Citation13]. Analogous cross-sectional associations have also been reported for omental VAT adipocyte size and VAT area [Citation10,Citation13], while longitudinal analysis of regional adipose deposition and adipocyte size has revealed that overfeeding (with resultant ~4 kg weight gain) induces abdominal SAT adipocyte size hypertrophy that is proportional with increased abdominal SAT area (r = 0.74)[Citation11]. These findings thereby suggest that the increased deposition of an adipose tissue associated with increased BMI is predominantly dependent on hypertrophy of the adipocytes comprising the tissue.
The results of our study contrast with findings from other adipose depots. Our data suggest that not only does EAT adipocyte size not change with BMI, but that EAT adipocyte size does not change in parallel with increased EAT deposition ()). Recent work from our group, and earlier work from other labs, has found that EAT adipocyte size does not correlate with BMI in post-mortem cases or cardiac surgery patients [Citation19,Citation29]. Thus, our current study suggests that increased EAT thickness that is associated with increased BMI does not occur by hypertrophy of the constituent adipocytes, as has been reported as the predominant mechanism of expansion in other fat depots.
If not adipocyte hypertrophy, what are the alternative explanations?
If adipocyte hypertrophy cannot explain the 58.7% increase in macroscopic EAT thickness that occurs from normal to obese patients ()), then alternative remodelling mechanism(s) must occur. Adipose tissue also contains extensive stromal vascular components (non-adipocyte cells). As a longitudinal study, Alligier et al. (2012) found that subjects fed a diet supplemented with excess fat not only had an increased mean body weight after 56 days (~2.5 kg gain) but significant fibrotic and microvascular remodelling of the microscopic adipose structure had occurred [Citation30]. Expression of pro-fibrotic, pro-angiogenic, and pro-inflammatory genes was significantly increased relative to the beginning of the study, as was the histological density of capillaries and intercellular matrix deposits[Citation30]. Moreover, mRNA expression and histological examination of SAT and omental fat (VAT) has shown that obese subjects have increased pro-fibrotic gene expression and increased pericellular fibrosis compared to lean subjects [Citation31]. Investigation of stromal vascular remodelling within EAT has only been performed in relation to AF. Extracellular fibrosis of EAT has been found in the fatty infiltrate of atrial tissue from AF patients and sheep models of AF [Citation32]. Additionally, fibrosis of peri-myocardial EAT has been found to increase in severity concurrently with the extent of atrial fibrosis and the degree of AF [Citation33]. In our study,the non-adipocyte area was not different between the three stratified BMI groups ()). Although our method only provides a rough indication, the observed range of non-adipocyte area between normal and obese individuals makes it unlikely that the observed 58.7% increase in EAT thickness in obese individuals is due to an increase in stromal vascular or fibrotic deposition.
Finally, as mentioned earlier, adipose tissue also expands by adipocyte hyperplasia [Citation8]. Recent prospective studies using adipocyte deuterium incorporation over an 8-week period have found independent correlations of new-adipocyte formation with body fat percentage and BMI [Citation34,Citation35]. Similarly, cross-sectional analyses of SAT and VAT depots have found that the proportion of small adipocytes correlates with BMI in women [Citation9]. Extrapolation of such findings to EAT, which suggest that hyperplastic expansion can occur with increased BMI, requires caution due to depot-specificity and female-exclusivity of the results. Our cross-sectional study did not find a change in average adipocyte size when stratified into BMI categories ()) or with BMI as a continuous variable ()). When stratified into BMI categories and plotted as frequency distributions of size, the curve fitted from the adipocytes of the obese group showed a leftward and upward shift relative to the normal overweight curves ()). Although only exploratory, these data might indicate that an increase in the proportion of smaller adipocytes (i.e. hyperplastic remodelling) underlies the increased EAT thickness in obesity. As adipocyte proliferation has been correlated with multiple indices of metabolic dysfunction in other depots [Citation36,Citation37], this warrants further research.
Epicardial adipocytes have an intrinsically high capacity for lipogenesis and lipolysis, as well as a uniquely increased expression of genes associated with pro- and anti-inflammatory cytokines and brown fat-like thermogenesis [Citation38–Citation40]. These features confer EAT the ability to buffer excessive fatty acid levels from the coronary circulation, signal to the myocardium via paracrine and vasocrine adipokine release, and regulate myocardial temperature [Citation39,Citation41]. Previous studies have correlated epicardial adipocyte size with inflammatory cytokine release and insulin resistance [Citation23,Citation29]. Similarly, the EAT transcriptome has been found to be altered in patients with coronary artery disease, resulting in differential expression of inflammatory and apoptotic genes, which might alter the size of epicardial adipocytes [Citation42,Citation43]. Clearly, EAT adipocyte size is associated with changes in the cellular biochemistry; however, how this relates to the potential hyperplastic remodelling in obesity reported in the current study requires direct investigation. Furthermore, this would provide insight into the mechanistic role of EAT in complications associated with obesity and the numerous cardiovascular diseases with which EAT deposition has been linked to.
Limitations
Our study was limited by the anatomical distinction between the site of echocardiographic EAT measurement and the site of intra-surgical EAT biopsy. As is standard within the field [Citation22], EAT was measured at the right ventricular free wall, due to the absolute thickness of the fat at this location. The EAT biopsy, in contrast, was taken at the atrioventricular groove. Despite this discrepancy, previous post-mortem analysis of EAT adipocytes from 10 distinct sampling sites, including from the right ventricular free wall and the atrioventricular groove, found no differences in regional adipocyte size. However, in a small subset of post-mortem cases, the authors reported that adipocyte size can vary intra-individually between sampling sites [Citation18]. Based on this, together with our study design, we cannot rule out the possibility that EAT adipocyte size is not homogenous between the site of EAT thickness measurement and the site of biopsy. A further limitation of our study was that we could not correlate EAT adipocyte size with measures of visceral obesity like waist circumference and VAT volume. Both measures, which associate with EAT thickness with greater strength than BMI [Citation1], were not measured as part of routine pre-operative patient evaluation. Despite having a weaker association, the correlation of BMI with EAT thickness is still significant based on meta-analysis[Citation1]. Finally, only ~8% of the patients recruited for our study were female, thereby yielding a predominant male study population. While this limits the translatability of our results to the general population, it minimizes potentially confounding effects of sex on the results[Citation44].
To the best of our knowledge, this is the first study to directly compare the macroscopic deposition of epicardial fat with the size of constituent fat cells. We have found that despite a strong positive correlation of EAT thickness with BMI in cardiac surgery patients, epicardial adipocyte size does not increase concurrently. This suggests that, unlike other subcutaneous and visceral adipose depots, adipocyte hypertrophy is not the predominant form of cellular remodelling that causes EAT expansion in obesity. Instead, our exploratory analysis suggests that hyperplasia might be the predominant EAT remodelling mechanism. How this differential site-specific remodelling influences the physiology and the metabolic and transcriptomic properties of EAT will be basis of future research as it might provide insight into why excessive macroscopic EAT deposition is detrimental to cardio-metabolic health.
Disclosure statement
No potential conflict of interest was reported by the authors.
Additional information
Funding
References
- Rabkin SW. The relationship between epicardial fat and indices of obesity and the metabolic syndrome: a systematic review and meta-analysis. Metab Syndr Relat Disord. 2014;12:31–42.
- Pierdomenico SD, Pierdomenico AM, Cuccurullo F, et al. Meta-analysis of the relation of echocardiographic epicardial adipose tissue thickness and the metabolic syndrome. Am J Cardiol. 2013;111:73–78.
- Iacobellis G, Ribaudo MC, Assael F, et al. Echocardiographic epicardial adipose tissue is related to anthropometric and clinical parameters of metabolic syndrome: a new indicator of cardiovascular risk. J Clin Endocrinol Metab. 2003;88:5163–5168.
- Xu Y, Cheng X, Hong K, et al. How to interpret epicardial adipose tissue as a cause of coronary artery disease: a meta-analysis. Coronary Art Dis. 2012;23:227–233.
- Jeong J-W, Jeong MH, Yun KH, et al. Echocardiographic epicardial fat thickness and coronary artery disease. Circ J. 2007;71:536–539.
- Mahabadi AA, Berg MH, Lehmann N, et al. Association of epicardial fat with cardiovascular risk factors and incident myocardial infarction in the general population: the Heinz Nixdorf recall study. J Am Coll Cardiol. 2013;61:1388–1395.
- Wong CX, Sun MT, Odutayo A, et al. Associations of epicardial, abdominal, and overall adiposity with atrial fibrillation. Circ Arrhyth Electrophysiol. 2016;9:e004378.
- Tandon P, Wafer R, Minchin JE. Adipose morphology and metabolic disease. J Exp Biol. 2018;221:jeb164970.
- Michaud A, Laforest S, Pelletier M, et al. Abdominal adipocyte populations in women with visceral obesity. Eur J Endocrinol. 2016;174:227–239.
- Veilleux A, Caron-Jobin M, Noël S, et al. Visceral adipocyte hypertrophy is associated with dyslipidemia independent of body composition and fat distribution in women. Diabetes. 2011;60:1504–1511.
- Tchoukalova YD, Votruba SB, Tchkonia T, et al. Regional differences in cellular mechanisms of adipose tissue gain with overfeeding. Proc Natl Acad Sci. 2010;107:18226–18231.
- Tchoukalova YD, Koutsari C, Karpyak MV, et al. Subcutaneous adipocyte size and body fat distribution. Am J Clin Nutr. 2008;87:56–63.
- Tchernof A, Bélanger C, Morisset A-S, et al. Regional differences in adipose tissue metabolism in women: minor effect of obesity and body fat distribution. Diabetes. 2006;55:1353–1360.
- Lee K, Lee S, Kim Y-J, et al. Waist circumference, dual-energy X-ray absortiometrically measured abdominal adiposity, and computed tomographically derived intra-abdominal fat area on detecting metabolic risk factors in obese women. Nutrition. 2008;24:625–631.
- Chan D, Watts GF, Barrett P, et al. Waist circumference, waist-to-hip ratio and body mass index as predictors of adipose tissue compartments in men. Q J Med. 2003;96:441–447.
- Janssen I, Heymsfield SB, Allison DB, et al. Body mass index and waist circumference independently contribute to the prediction of nonabdominal, abdominal subcutaneous, and visceral fat. Am J Clin Nutr. 2002;75:683–688.
- Corradi D, Maestri R, Callegari S, et al. The ventricular epicardial fat is related to the myocardial mass in normal, ischemic and hypertrophic hearts. Cardiovasc Pathol. 2004;13:313–316.
- Sons HU, Hoffmann V. Epicardial fat cell size, fat distribution and fat infiltration of the right and left ventricle of the heart. Anat Anz. 1986;161:355–373.
- Aitken-Buck HM, Babakr AA, Coffey S, et al. Epicardial adipocyte size does not correlate with body mass index. Cardiovasc Pathol. 2019;43:107144.
- World Health Organisation Europe. Body mass index. 2019[cited 2019 May 10]. http://www.euro.who.int/en/health-topics/disease-prevention/nutrition/a-healthy-lifestyle/body-mass-index-bmi
- Mitchell C, Rahko PS, Blauwet LA, et al. Guidelines for performing a comprehensive transthoracic echocardiographic examination in adults: recommendations from the american society of echocardiography. J Am Soc Echocardiogr. 2019;32:1–64.
- Iacobellis G, Willens HJ. Echocardiographic epicardial fat: a review of research and clinical applications. J Am Soc Echocardiogr. 2009;22:1311–1319.
- Bambace C, Telesca M, Zoico E, et al. Adiponectin gene expression and adipocyte diameter: a comparison between epicardial and subcutaneous adipose tissue in men. Cardiovasc Pathol. 2011;20:e153–e156.
- Vianello E, Dozio E, Arnaboldi F, et al. Epicardial adipocyte hypertrophy: association with M1-polarization and toll-like receptor pathways in coronary artery disease patients. Nutr Metab Cardiovasc Dis. 2016;26:246–253.
- Arner E, Westermark PO, Spalding KL, et al. Adipocyte turnover: relevance to human adipose tissue morphology. Diabetes. 2010;59:105–109.
- Deurenberg P, Yap M, Van Staveren WA. Body mass index and percent body fat: a meta analysis among different ethnic groups. Int J Obes. 1998;22:1164–1171.
- Akyol B, Boyraz M, Aysoy C. Relationship of epicardial adipose tissue thickness with early indicators of atherosclerosis and cardiac functional changes in obese adolescents with metabolic syndrome. J Clin Res Pediatr Endocrinol. 2013;5:156–163.
- Salans LB, Cushman SW, Weismann RE. Studies of human adipose tissue Adipose cell size and number in nonobese and obese patients. J Clin Invest. 1973;52:929–941.
- Eiras S, Teijeira-Fernández E, Salgado-Somoza A, et al. Relationship between epicardial adipose tissue adipocyte size and MCP-1 expression. Cytokine. 2010;51:207–212.
- Alligier M, Meugnier E, Debard C, et al. Subcutaneous adipose tissue remodeling during the initial phase of weight gain induced by overfeeding in humans. J Clin Endocrinol Metab. 2012;97:E183–E192.
- Divoux A, Tordjman J, Lacasa D, et al. Fibrosis in human adipose tissue: composition, distribution, and link with lipid metabolism and fat mass loss. Diabetes. 2010;59:2817–2825.
- Haemers P, Hamdi H, Guedj K, et al. Atrial fibrillation is associated with the fibrotic remodelling of adipose tissue in the subepicardium of human and sheep atria. Eur Heart J. 2015;38:53–61.
- Abe I, Teshima Y, Kondo H, et al. Association of fibrotic remodeling and cytokines/chemokines content in epicardial adipose tissue with atrial myocardial fibrosis in patients with atrial fibrillation. Heart Rhythm. 2018;15:1717–1727.
- White UA, Fitch MD, Beyl RA, et al. Association of in vivo adipose tissue cellular kinetics with markers of metabolic health in humans. J Clin Endocrinol Metab. 2017;102:2171–2178.
- White UA, Fitch MD, Beyl RA, et al. Differences in in vivo cellular kinetics in abdominal and femoral subcutaneous adipose tissue in women. Diabetes. 2016;65:1642–1647.
- Fang L, Guo F, Zhou L, et al. The cell size and distribution of adipocytes from subcutaneous and visceral fat is associated with type 2 diabetes mellitus in humans. Adipocyte. 2015;4:273–279.
- McLaughlin T, Lamendola C, Coghlan N, et al. Subcutaneous adipose cell size and distribution: relationship to insulin resistance and body fat. Obesity. 2014;22:673–680.
- Marchington JM, Mattacks CA, Pond CM. Adipose tissue in the mammalian heart and pericardium: structure, foetal development and biochemical properties. Comp Biochem Physiol. 1989;94:225–232.
- Marchington JM, Pond CM. Site-specific properties of pericardial and epicardial adipose tissue: the effects of insulin and high-fat feeding on lipogenesis and the incorporation of fatty acids in vitro. Int J Obes. 1990;14:1013–1022.
- Yim J, Rabkin SW. Differences in gene expression and gene associations in epicardial fat compared to subcutaneous fat. Horm Metab Res. 2017;49:327–337.
- Iacobellis G, Bianco AC. Epicardial adipose tissue: emerging physiological, pathophysiological and clinical features. Trends Endocrinol Metab. 2011;22:450–457.
- McAninch EA, Fonseca TL, Poggioli R, et al. Epicardial adipose tissue has a unique transcriptome modified in severe coronary artery disease. Obesity. 2015;23:1267–1278.
- Maghbooli Z, Hossein-nezhad A. Transcriptome and molecular endocrinology aspects of epicardial adipose tissue in cardiovascular diseases: a systematic review and meta-analysis of observational studies. Biomed Res Int. 2015;2015. DOI:10.1155/2015/926567
- Camhi SM, Bray GA, Bouchard C, et al. The relationship of waist circumference and BMI to visceral, subcutaneous, and total body fat: sex and race differences. Obesity. 2011;19:402–408.