
ABSTRACT
We analysed if levels of four miRNAs would change after a lifestyle intervention involving dietary and exercises in prediabetes. MiRNAs previously shown to be associated with diabetes (Let-7a, Let-7e, miR-144 and miR-92a) were extracted from serum pre- and post-intervention. mRNA was extracted from fat-tissue for gene expression analyses. The intervention resulted in increased Let-7a and miR-92a. We found correlations between miRNAs and clinical variables (triglycerides, cholesterol, insulin, weight and BMI). We also found correlations between miRNAs and target genes, revealing a link between miR-92a and IGF system. A lifestyle intervention resulted in marked changes in miRNAs. The association of miRNAs with insulin and the IGF system (both receptors and binding proteins) may represent a mechanism of regulating IGFs metabolic actions.
Introduction
Impaired glucose regulation (IGR) refers to a metabolic state between normal glucose homoeostasis and diabetes [Citation1]. Usually referred as pre-diabetes or non-diabetic hyperglycaemia, IGR represents a high risk to develop type 2 diabetes mellitus (T2DM). T2DM is thought to arise from a summation of genetic and environmental/epigenetic factors, which result in a decline in insulin activity, followed by a chronic pancreatic beta-cell dysfunction. Diverse circulating microRNAs (miRNAs) have been identified as being significantly different between T2DM patients and IGR individuals [Citation2,Citation3].
MiRNAs are endogenous, 21–25 nucleotides in length, small non-coding RNA molecules that regulate gene expression at the post-transcriptional level by binding to target mRNAs and affecting their translation [Citation4]. MiRNAs participate in a variety of important biological processes including gene regulation, proliferation, apoptosis and metabolism [Citation5,Citation6]. Because miRNAs are relatively stable in plasma and are regulated in health and disease conditions, they are increasingly being used as a new class of disease biomarkers [Citation7].
Dysfunction of miRNAs significantly contributes to initiation and progression of T2DM. The investigation surrounding miRNAs has grown considerably, and it has been demonstrated that they have functional roles in insulin secretion, glucose homoeostasis and adipocyte differentiation [Citation8–10]. Additionally, circulating miRNAs have been shown to be involved in the mechanisms underlying cardiovascular disease (CVD) [Citation10–12], being CVD the main cause of mortality in T2DM people, affecting at least 68% of these individuals who are 65 y or older [Citation13]. In plasma, they are protected from circulating ribonucleases through their association with lipid and protein carriers [Citation14]. Lipoproteins, high-density lipoproteins (HDL) and low-density lipoproteins (LDL) were reported to transport miRNAs [Citation15]. In the last decade, many miRNAs have been identified to play a pathophysiological role in T2DM, among them, Let-7a has been associated with glucose metabolism [Citation16,Citation17], Let-7e showed sensitivity to metformin treatment [Citation18], miR-144 was demonstrated to play a role in beta-cell dysfunction [Citation19] and insulin signalling [Citation19]; and miR-92a associated with cell dysfunction in T2DM [Citation20], endothelial dysfunction [Citation21,Citation22], and coronary heart disease [Citation11].
Despite progress made related to the study of IGR and T2DM [Citation23], the understanding of the mechanisms underlying these metabolic disorders remains not fully clarified. Feasible biomarkers are necessary to better assess the risk of disease, monitor responses to treatment, personalize therapy and improve patient quality of life implying new strategies to prevent the progress from IGR to T2DM.
In this study, we sought to determine whether levels of four key circulating miRNAs, previously identified to be important for metabolic derangements, would change in response to a lifestyle intervention of individuals with IGR. We analysed circulating miRNA in serum where they are resistant to degradation; this resistance occurs as they are transported by carrier molecules including lipoproteins such as HDL, argonaute-2 and exosomes, which confer to miRNA high stability; therefore, they can be readily detected in blood samples [Citation7,Citation24]. Additionally, we tested for associations with these miRNAs and clinical variables [weight, Body Mass Index (BMI), indicators of glucose regulation] and target genes associated with IGR and T2DM. For mRNA expression, our interest was to analyse the direct effect of the intervention in fat tissue, as adipose lipid mobilization through fat cell lipolysis is particularly interesting due to its close association with body fat mass and central role in energy metabolism [Citation25].
Methods
MiRNAs extraction and analysis
Serum was collected from 20 IGR individuals (n = 10 males – mean age 61.5 ± 4.83; n = 10 females – mean age 60.2 ± 2.73), at baseline and following a 6-month telephone-led lifestyle intervention (Care Call Programme) where they received exercise and nutritional advice. The complete description of samples collecting and CareCall Programme details were described before by our group [Citation26]. The 20 individuals were recruited in the time frame available, and all agreed to donate blood sample and adipose tissue punch in two time points, baseline (before starting the CareCall Programme) and 6 months after the lifestyle intervention.
Circulating miRNAs were extracted from 500uL of serum pre- and post-intervention by pre-incubation with Trizol LS reagent (ThermoFisher Scientific) followed by purification using RNeasy Mini Kit (Qiagen-UK), and 2uL was reverse transcribed using TaqMan™ Advanced miRNA cDNA Synthesis Kit (ThermoFisher Scientific) generating a total of 20uL of cDNA, following the manufacturer’s instructions. The levels of four key miRNAs (Let-7a, Let-7e, miR-144 and miR-92a) previously shown to be associated with diabetes [Citation4,Citation16,Citation18,Citation19,Citation21,Citation27–30] were analysed by RT-qPCR on a StepOne machine (Applied Biosystems), using the TaqMan™ Advanced miRNA assays (477827_mir, 478575_mir, 477914_mir, 477860_mir, 478579_mir) and TaqMan Fast advanced mastermix (ThermoFisher Scientific). The experiments were performed in triplicates in a total volume of 15 μL containing 5 μL of cDNA template, 10 μL of TaqMan Fast advanced master mix, 1 μL of miRNA assay and 4 μL of RNase-free water per reaction. The thermal-cycling conditions were performed as follows: enzyme activation step at 95ºC, 20 sec, 1 cycle; denaturation step at 95ºC, 1 sec, 40 cycles; annealing/extension step at 60ºC, 20 sec, 40 cycles. Cq values higher than the cut-off of 38 were not considered as a reliable expression value, according to MIQE Guideline [Citation31], and therefore were excluded from the statistical analysis.
MiR-16 was previously reported to have relatively stable expression across most human tissues, including plasma and serum [Citation32–34] and was used as an endogenous control.
This study was submitted to the Ethics committee of Research and Development Department of Salford Royal NHS Foundation Trust and the permission was granted in accordance with the Research Governance Framework (2005), Medicines for Human Uses (Clinical Trials) Regulations (2004) and Salford Royal NHS Foundation Trust local policies (proc number 14/NW/1196).
All the following experiments for miRNAs and gene expression were conducted in a blind way to reduce or eliminate experimental biases. KS participated in the recruitment of IGR participants, sample collection and labelling. HAF and CML conducted all the molecular biology experiments.
RNA extraction and gene expression analysis
All IGR participants had a punch of subcutaneous fat tissue collected for RNA extraction. The adipose tissue was taken from a gluteal fat biopsy. A small area around the upper buttock was anaesthetized with a local anaesthetic. A sample of superficial fat, measuring approximately 5 mm diameter by 5 mm deep, was taken with a punch biopsy needle. The skin was sutured with one or two stitches and a sterile dressing applied afterwards. The participant was asked to come back to the Clinical Research Facility (CRF) after one week for suture removal. The next study visit appointment was given and the participant discharged from CRF. RNA was extracted using AllPrep DNA/RNA Mini Kit (Qiagen, Valencia, CA). Gene expression analyses were conducted for 18 genes in fat tissue (PPARG, GIPR, IGF2BP2, FTO, CAV1, IGF1 R, INSR, IGFBP4, WFS1, IGF1, LPL, IGFBP2, IGF2, IGFBP6, LEP, LDLR, IGFR2, HHEX), known to be implicated in the modulation of weight change and interventions as diet and exercise, impaired glucose regulation and T2DM. The viability and quantity of the RNA were determined by NanoDrop® ND-1000 spectrophotometer (Nanodrop, Wilmington, DE). High-capacity cDNA Reverse Transcription Kit (Life Technologies, Foster City, CA) was used to synthesize cDNA by using approximately 400 ng of each RNA sample, and 50 ng of cDNA were then diluted in H2O mixed with TaqMan® Universal PCR Master Mix (Life Technologies) and disposed in a 96 well plate.
Relative gene expression was determined using a LightCycler 480 machine (Roche) running LightCycler 480 SW 1.5.0 SP3 software. The assays used in this study were Roche RealTime ready single assays (PPARG, GIPR, IGF2BP2, FTO, CAV1, IGF1 R, INSR, IGFBP4, WFS1, IGF1, LPL, IGFBP2, IGF2, IGFBP6, LEP, LDLR, IGFR2, HHEX) relative to two housekeeping genes (ACTB and RN18S1). All genes were assayed in triplicate and 50 ng of total cDNA was used per reaction for all. The qPCR protocol was as follows: pre-incubation – 1 cycle at 95°C for 10 minutes, amplification – 50 cycles at 95°C for 10 secs, 60°C for 30 secs and 72°C for 1 sec, cooling – 1 cycle, 40°C for 30 secs.
We quantified the gene expression using the Comparative threshold (Ct) method (ΔΔCt Method) [Citation35,Citation36], and the amount of target gene was normalized to ACTB as housekeeping gene (as it was stable across all samples, p > 0.05) and determined by 2−ΔΔCt, as previously described [Citation37,Citation38], with relative expression levels reported as fold change. Cq values higher than the cut-off of 35 were not considered as a reliable expression value, according to the manufacturer’s recommendations, and therefore were excluded from the statistical analysis. The expression of target mRNAs was then correlated with the miRNAs levels in considered important pathways to the development of T2DM.
Statistical analysis
All analyses were carried out using Statistical Package for Social Sciences (SPSS version 20.0, Armonk, NY, USA). Cq values of miRNA levels were expressed as 2−ΔCq [Citation39]. Descriptive analyses were performed to evaluate socio-demographic and clinical characteristics. We have performed a general linear model as a first analysis considering the clinical variables and miRNAs as dependent variables, weight change categories as fixed factor, adjusting for age and sex. Changes in miRNA levels before and after intervention were compared by Paired T-test followed by Bonferroni correction for multiple comparisons as a post-hoc test and considered significant when p ≤ 0.025. The miRNA levels were then correlated with clinical parameters and mRNA expression by Pearson’s correlation considering r ≥ 0.35 and p ≤ 0.05 significant. As we did not see any effect of age and sex for any of the variables, pre and post intervention, we carried out our correlations without age and sex adjustment. The data were correlated using Displayr and presented as correlation matrix. We performed the Kolmogorov–Smirnov test, and all the variables presented normal distribution (p > 0.05); thus, we performed parametric tests for our analysis.
Results
Socio-demographic and clinical characteristics of the sample
All individuals completed the study. At the end of 6 months of lifestyle intervention, the majority of the patients maintained (45%) or lost 3% (40%) in weight or more. Only three (15%) of patients gained weight. We analysed the changes in clinical variables of all patients together and separately for those who maintained the same weight or lost weight. The socio-demographic and clinical characteristics of all IGR patients included in this study and considering only those who maintained or lost 3% of weight or more (85% in total) are shown in .
Table 1. Anthropometric measurements and clinical variables of IGR participants before and after the intervention
Circulating MiRNA expression changes before and after the lifestyle intervention
The expression of miR-16 was stable across all our samples (t = −1.05, p = 0.303) and used as endogenous control. In the whole cohort (n = 20) both Let-7a and miR-92a were significantly higher following the intervention (for Let-7a: t = −2.91, p = 0.009; and for miR-92a: t = −4.71, p = 0.0001) (), while Let-7e and miR-144 did not show changes after the intervention (t = 1.34, p = 0.196 and t = −0.780, p = 0.445, respectively). When we analysed those people who maintained or lost weight only (n = 17) over the 6-month intervention, miR-92a and Let-7a remained elevated post-intervention, however only miR-92a achieving statistical significance (t = −3.73, p = 0.008 for miR-92a and t = −2.14, p = 0.048 for let-7a) (). In this group however Let-7e levels were significantly decreased post-intervention (t = 2.09, p = 0.017) ().
Figure 1. (a) MicroRNAs expression in serum of IGR individuals (n = 20) at baseline and 6 months after the lifestyle intervention. Data were analysed by Paired T-test and are expressed as Mean ± SD (p ≤ 0.025). (b) MicroRNAs expression in serum of IGR individuals which maintained weight or lost 3% of weight only (n = 17) at baseline and 6 months after the lifestyle intervention. Data were analysed by Paired T-test and are expressed as Mean ± SD (p ≤ 0.025)
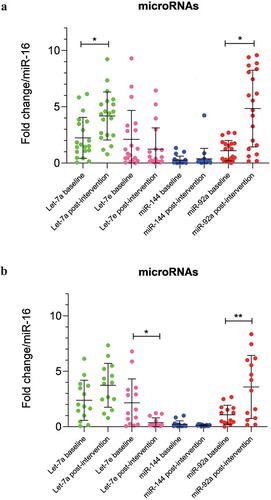
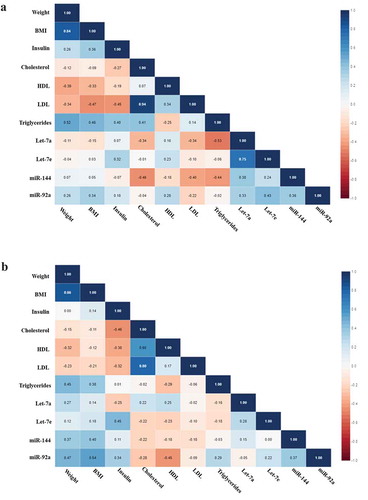
Figure 2. (a) Correlation matrix among microRNAs and clinical variables in all IGR individuals at baseline. Analysis were done by Pearson’s correlation, p ≤ 0.05. The r values for each correlation are shown in the squares. (b) Correlation matrix among microRNAs and clinical variables in all IGR individuals post-intervention. Analysis were done by Pearson’s correlation, p ≤ 0.05. The r values for each correlation are shown in the squares
Gene expression in fat tissue of IGR patients
The results related to gene expression were reported previously by our group [Citation40]. Summarizing, from the panel of genes chosen to be analysed, we found that the lifestyle intervention in IGR patients only reduced the expression of CAV1 with no changes in any other target genes (data not shown). We also did not find differences when excluding patients who gain weight after the intervention. For this reason, we tested the results of all IGR patients for correlations with miRNAs. Following the Cq cut off we excluded two patients from the mRNA analysis.
Correlations between miRNA levels, clinical variables and target genes
We tested by Pearson’s correlation the baseline and post-intervention miRNA levels and clinical variables of all IGR individuals and separately those who maintained or lost 3% in weight or more, as we found different results in miRNA levels when considering all patients and separately excluding those who gain weight. Considering all IGR individuals we found significant negative correlations at baseline between Let-7a and triglycerides (r = −0.526, p = 0.025) and miR-144 and cholesterol (r = −464, p = 0.039) (). Post-intervention we found positive correlations between Let-7e and insulin (r = 454, p = 0.044), miR-92a and weight (r = 0.471, p = 0.036) and BMI (r = 0.544, p = 0.013), and a negative correlation between miR-92a and HDL (r = −0.449, p = 0.047) ().
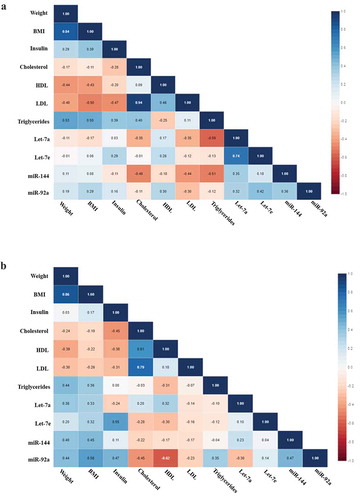
Excluding the individuals who gained weight, all the correlations we found before were maintained, however showing stronger significance. When baseline miRNA levels were correlated with clinical parameters we found significant negative correlations between Let-7a and triglycerides (r = −0.588, p = 0.021) and between miR-144 and cholesterol (r = −0.491, p = 0.045) (). After the intervention we found positive correlations between Let-7e and insulin (r = 0.551, p = 0.022) and miR-92a and BMI (r = 0.556, p = 0.021), also negative correlation between miR-92a and HDL (r = −0.619, p = 0.008) ().
Figure 3. (a) Correlation matrix among microRNAs and clinical variables in IGR individuals who maintained or lost 3% in weight or more at baseline. Analysis were done by Pearson’s correlation, p ≤ 0.05. The r values for each correlation are shown in the squares. (b) Correlation matrix among microRNAs and clinical variables in IGR individuals who maintained or lost 3% in weight or more post-intervention. Analysis were done by Pearson’s correlation, p ≤ 0.05. The r values for each correlation are shown in the squares
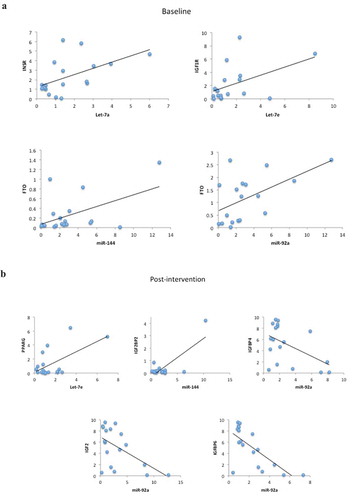
Regarding the target genes and miRNAs correlations, considering all IGR individuals, when analysed at baseline we found positive correlations between Let-7a and INSR (r = 0.526, p = 0.025), Let-7e and IGF1 R (r = 0.474, p = 0.047), miR-144 and FTO (r = 0.508, p = 0.031) and miR-92a and FTO (r = 0.545, p = 0.019) (). After the lifestyle intervention we found positive correlations between Let-7e and PPARG (r = 0.599, p = 0.009), miR-144 and IGF2BP2 (r = 0.779, p < 0.0001), and negative correlations between miR-92a and IGFBP4 (r = −0.509, p = 0.031), IGF2 (r = −0.559, p = 0.016) and IGFBP6 (r = −0.706, p = 0.001) ().
Figure 4. (a) Scatter plots representing the correlations among microRNAs and target genes in all IGR individuals at baseline. Analysis were done by Pearson’s correlation, p ≤ 0.05, r ≥ 0.350. (b) Scatter plots representing the correlations among microRNAs and target genes in all IGR individuals post-intervention. Analysis were done by Pearson’s correlation, p ≤ 0.05 r ≥ 0.350
Discussion
Multiple mechanisms are involved in the pathology of T2DM including inflammatory response, abnormal insulin secretion and glucose metabolism, and many aspects still require elucidation [Citation10,Citation12,Citation22]. Improvements of our knowledge in the mechanisms overlapping genetic and epigenetic aspects in T2DM may help to drive future research towards an integrated pathophysiological approach and to provide future directions in the field.
Although miRNAs have been investigated in T2DM and impaired glucose tolerance status, to the best of our knowledge, this is the first time that changes in miRNAs levels have been investigated in patients with IGR considering two time points: before (baseline) and 6 months after a telephone-based lifestyle intervention involving diet and exercise. The lifestyle intervention in patients with IGR sought to improve their dietary and exercise habits; after 6 months, it resulted in changes in miRNAs in general and linked to weight loss. Our results showed increased levels of Let-7a and miR-92a in all individuals submitted to the intervention while decreased levels of Let-7e were observed only in those who maintained or lost weight. The intervention also caused miR-92a and Let-7a upregulation linked to weight loss. Additionally, we found several correlations at both points (baseline and after 6 months of the lifestyle intervention) between the miRNAs and circulating lipids, BMI/weight, and with gene expression for genes involved in glucose regulation and T2DM.
Let-7 is a miRNA fundamental in suppressing tumour cell proliferation, conserved across diverse animal species from flies to humans [Citation41]. Despite the fact that the biological functions of Let-7 have not been well investigated and show contradictory results, decreased levels of Let-7 miRNAs are normally associated with poor prognosis [Citation42]. It was demonstrated before that Let-7a was downregulated in patients with IGR compared to normoglycemic individuals and considered a predictor of IGR [Citation4]. Also, its overexpression was able to prevent cell death and attenuated pro-inflammatory response in the brain endothelial cells under high glucose conditions [Citation16]. We found that after a lifestyle intervention IGR individuals had increased levels of Let-7a, supporting the hypothesis that this miRNA has a protective role [Citation16,Citation41] targeting glucose metabolism [Citation4]. An unexpected finding was the downregulation of Let-7e in those individuals who maintained or lost weight after the intervention. Let-7e, as part of Let-7 family, is known to have protective activity [Citation41]. However, as mentioned above, even though members of the Let-7 family are widely documented as tumour suppressor miRNAs, dysregulation of specific family members in different cancer types has also been described [Citation41]. Indeed, elevated Let-7e expression was significantly correlated with vein invasion and poor prognosis in hepatocellular carcinoma [Citation28].
In our study, we found increased levels of miR-92a in all IGR individuals following lifestyle intervention and this higher expression was maintained also when we exclude patients who gained weight. These results suggest a role for this miRNA in weight modulation as we also observed positive associations of miR-92a with weight and BMI post-intervention. MiR-92a is reported to have a role in angiogenesis, atherosclerosis [Citation21,Citation30,Citation43] and endothelial dysfunction [Citation10,Citation22]. In this regard, the levels of miR-92a were shown to be reduced in CD34+ cells from individuals with diabetic retinopathy compared with control subjects and patients with diabetes without diabetic retinopathy [Citation20]. Interestingly, we also found a negative correlation between this miRNA and high-density lipoprotein (HDL) post-intervention, it is already known that HDL has a role in transporting endogenous miRNAs and delivering them to recipient cells with functional targeting capabilities [Citation14]. MiRNAs, specifically miR-92a was seen to be involved in the regulation of angiogenesis and transported within HDL to sites of injury/repair [Citation44].
Even though we did not see variations in miR-144 as a consequence of the intervention, we found at baseline a negative correlation between miR-144 and total cholesterol. miRNA-144 is a key miRNA in the pathological processes of T2DM, and is an important component of the insulin-signalling cascade [Citation19] and lipid metabolism [Citation45] and also strongly associated with the IGF-1 R signalling pathway [Citation46].
Recent studies have shown abnormalities of miRNAs linked with T2DM [Citation10–12] and exploring the broad interaction among the genetic, epigenetic and environmental influences involved in the concomitant development of T2DM and CVD complications [Citation12]. MiRNAs are known to regulate gene expression by inhibiting translation via binding to the 3′ untranslated region of their target mRNA [Citation5]. So far, only few miRNAs have been linked to glucose metabolism and metabolic disorders [Citation2,Citation4]. We tested for associations the miRNAs analysed in this study with target genes known to be involved in glucose metabolism and T2DM. At baseline, considering the status of the patients as pre-diabetes, we found positive correlations between Let-7a and INSR, Let-7e and IGF1 R, miR-144 and FTO and miR-92a and FTO. It was demonstrated before that Let-7a can regulate the expression of INSR in breast cancer cell lines [Citation47], confirming the function of this miRNA in targeting genes related to IGF signalling pathway [Citation47]. Additionally, Let-7e was showed to be able to control IGF1 R expression in colorectal cancer cells [Citation29] suggesting that Let-7e could be used in IGF1 R-targeted therapeutics in anticancer therapy. No evidence was found in the literature regarding associations with miR-144 and miR-92a with FTO; however, these miRNAs have been shown to be involved in insulin resistance [Citation48] and diabetes [Citation4,Citation20].
Post-intervention, IGR patients showed an improvement in β-cell function, followed by weight loss. The correlations we found with miRNAs and target genes were mostly associated with IGF system. MiR-92a was negatively correlated with IGFBP4, IGFBP6 and IGF2; Let-7e was positively correlated with PPARG and miR-144 showed a positive correlation with IGFBP2. It is known that IGFBP6 protein can bind IGF2 and prevent the interactions of this protein with other receptors, such as IGF1 R and INSR [Citation47]. In our study, we found enhanced miR-92 as a consequence of lifestyle intervention, and this miRNA was shown to be negatively correlated with IGFBP6, among other genes involved in the IGF system (IGFBP4 and IGF2). If we consider that the increase of miR-92a can act suppressing the IGFBP6 gene post intervention, this mechanism could be enhancing the interaction of IGF2 with its receptors in adipose tissue cells. These evidence corroborates with our previous findings with these individuals showing that higher levels of IGF2 at baseline in IGR patients was predictive of weight loss [Citation26] and reinforcing IGF2 has an important participation in weight management in T2DM [Citation49]. Regarding the associations between Let-7e and PPARG and between miR-144 and IGFBP2, no previous studies were found showing such links. However, both genes are known to participate in the regulation of glucose and lipid metabolism [Citation50–53] and our results suggest they can be targets of these miRNAs.
Our study has some limitations due to the number of participants, even though we have strength in that participants consented to donate blood and fat tissue pre- and post-intervention, which permitted us to identify miRNA responses before and after the intervention and the link between miRNAs and gene expression in both time points. Another important limitation is the lack of data on menopausal status in women, which could influence our findings; however, the mean age variation in women was very small (60 ± 2.7 y old).
In conclusion, we speculate the association of miRNAs with insulin and the IGF system (both receptors and binding proteins) could represent a method of regulating the metabolic actions of IGFs, but this will require further experimental validation. In obesity and the metabolic syndrome, there is a dysregulation of IGF binding protein production that results in altered levels and action of the free fraction of IGF-I [Citation54–56]. MiRNAs may be involved in that dysregulation and warrant further study.
A telephone-led lifestyle intervention involving dietary and exercise advice resulted in marked changes in several miRNAs and their associations with clinical variables and target genes shown to be associated with diabetes. Our results encourage the continuity of the investigation of how miRNAs regulate metabolic process and may be new targets in preventing the progress of IGR status to T2DM that consist of a serious health burden worldwide.
Disclosure statement
The authors declare that there is no conflict of interest that could be perceived as prejudicing the impartiality of the research reported.
Data availability statement
Data available on request due to privacy/ethical restrictions
Additional information
Funding
References
- Gabir MM, Hanson RL, Dabelea D, et al. The 1997 American Diabetes Association and 1999 World Health Organization criteria for hyperglycemia in the diagnosis and prediction of diabetes. Diabetes Care. 2000;23:1108–1112.
- Karolina DS, Tavintharan S, Armugam A, et al. Circulating miRNA profiles in patients with metabolic syndrome. J Clin Endocrinol Metab. 2012;97:E2271–6.
- Kong L, Zhu J, Han W, et al. Significance of serum microRNAs in pre-diabetes and newly diagnosed type 2 diabetes: a clinical study. Acta Diabetol. 2011;48:61–69.
- Mononen N, Lyytikäinen L-P, Seppälä I, et al. Whole blood microRNA levels associate with glycemic status and correlate with target mRNAs in pathways important to type 2 diabetes. Sci. Rep. 2019;9.
- Pillai RS, Bhattacharyya SN, Filipowicz W. Repression of protein synthesis by miRNAs: how many mechanisms? Trends Cell Biol. 2007;17:118–126.
- Bartel DP. MicroRNAs: target recognition and regulatory functions. Cell. 2009;136:215–233.
- Mitchell PS, Parkin RK, Kroh EM, et al. Circulating microRNAs as stable blood-based markers for cancer detection. Proc Natl Acad Sci U S A. 2008;105:10513–10518.
- Trajkovski M, Hausser J, Soutschek J, et al. MicroRNAs 103 and 107 regulate insulin sensitivity. Nature. 2011;474:649–653.
- Hennessy E, O’Driscoll L. Molecular medicine of microRNAs: structure, function and implications for diabetes. Expert Rev Mol Med. 2008;10:1–20.
- Pordzik J, Jakubik D, Jarosz-Popek J, et al. Significance of circulating microRNAs in diabetes mellitus type 2 and platelet reactivity: bioinformatic analysis and review. Cardiovasc Diabetol. 2019;18:113.
- Jiménez-Lucena R, Camargo A, Alcalá-Diaz JF, et al. A plasma circulating miRNAs profile predicts type 2 diabetes mellitus and prediabetes: from the CORDIOPREV study. Experimental & Molecular Medicine. 2018;50:1–12.
- De Rosa S, Arcidiacono B, Chiefari E, et al. Type 2 diabetes mellitus and cardiovascular disease: genetic and epigenetic links. Front Endocrinol (Lausanne). 2018;9:2.
- Ofstad AP. Myocardial dysfunction and cardiovascular disease in type 2 diabetes. Scand J Clin Lab Invest. 2016;76:271–281.
- Vickers KC, Palmisano BT, Shoucri BM, et al. MicroRNAs are transported in plasma and delivered to recipient cells by high-density lipoproteins. Nature Cell Biology. 2011;13:423–433.
- Michell DL, Vickers KC. Lipoprotein carriers of microRNAs. Biochim Biophys Acta - Mol Cell Biol Lipids. 2016;1861:2069–2074.
- Song J, Yoon SR, Kim OY. MiR-Let7A controls the cell death and tight junction density of brain endothelial cells under high glucose condition. Oxid Med Cell Longev. 2017;2017. DOI:10.1155/2017/6051874
- Mononen N, Lyytikäinen LP, Seppälä I, et al. Whole blood microRNA levels associate with glycemic status and correlate with target mRNAs in pathways important to type 2 diabetes. Sci Rep. 2019;9.
- Demirsoy İH, Ertural DY, Balci Ş, et al. Profiles of circulating MiRNAs following metformin treatment in patients with type 2 diabetes. J Med Biochem. 2018;37:499–506.
- Karolina DS, Armugam A, Tavintharan S, et al. MicroRNA 144 impairs insulin signaling by inhibiting the expression of insulin receptor substrate 1 in type 2 diabetes mellitus. PLoS One. 2011;6. DOI:10.1371/annotation/698b7123-174f-4a09-95c9-fd6f5017d622
- Bhatwadekar AD, Yan Y, Stepps V, et al. MiR-92a corrects CD34+ cell dysfunction in diabetes by modulating core circadian genes involved in progenitor differentiation. Diabetes. 2015;64:4226–4237.
- Chen Z, Wen L, Martin M, et al. Oxidative stress activates endothelial innate immunity via sterol regulatory element binding protein 2 (SREBP2) transactivation of MicroRNA-92a. Circulation. 2015;131:805–814.
- Jansen F, Wang H, Przybilla D, et al. Vascular endothelial microparticles-incorporated microRNAs are altered in patients with diabetes mellitus. Cardiovasc Diabetol. 2016;15:49.
- Campbell RK. Type 2 diabetes: where we are today: an overview of disease burden, current treatments, and treatment strategies. J Am Pharm Assoc (2003). 2009;49(Suppl 1)S3–9.
- Fung EC, Butt AN, Eastwood J, et al. Circulating microRNA in cardiovascular disease. In: Advances in clinical chemistry. Vol. 91, Academic Press Inc.; 2019. p. 99–122. ISBN 9780128174715.
- Arner P, Andersson DP, Bäckdahl J, et al. Clinical and translational report cell metabolism clinical and translational report weight gain and impaired glucose metabolism in women are predicted by inefficient subcutaneous fat cell lipolysis. Cell Metab. 2018;28:45–54.
- Malipatil N, Fachim HA, Siddals K, et al. Data independent acquisition mass spectrometry can identify circulating proteins that predict future weight loss with a diet and exercise programme. J Clin Med. 2019;8:141.
- Song J, Lee JE. ASK1 modulates the expression of microRNA Let7A in microglia under high glucose in vitro condition. Front Cell Neurosci. 2015;9. DOI:10.3389/fncel.2015.00198
- Shi W, Zhang Z, Yang B, et al. Overexpression of microRNA let-7 correlates with disease progression and poor prognosis in hepatocellular carcinoma. Med (United States). 2017;96:e7764.
- Li Z, Pan W, Shen Y, et al. IGF1/IGF1R and microRNA let-7e down-regulate each other and modulate proliferation and migration of colorectal cancer cells. Cell Cycle. 2018;17:1212–1219.
- Loyer X, Potteaux S, Vion AC, et al. Inhibition of microRNA-92a prevents endothelial dysfunction and atherosclerosis in mice. Circ Res. 2014;114:434–443.
- Bustin SA, Benes V, Garson JA, et al. The MIQE guidelines: minimum information for publication of quantitative real-time PCR experiments. Clin Chem. 2009;55:611–622.
- Davoren PA, McNeill RE, Lowery AJ, et al. Identification of suitable endogenous control genes for microRNA gene expression analysis in human breast cancer. BMC Mol Biol. 2008;9. DOI:10.1186/1471-2199-9-76
- Rinnerthaler G, Hackl H, Gampenrieder SP, et al. miR-16-5p is a stably-expressed housekeeping MicroRNA in breast cancer tissues from primary tumors and from metastatic sites. Int. J. Mol. Sci. 2016;17:156.
- White Paper. A technical guide to identifying miRNA normalizers using TaqMan advanced miRNA assays. [cited 2020 Apr 1]. Available from: https://www.thermofisher.com/document-connect/document-connect.html?url=https%3A%2F%2Fassets.thermofisher.com%2FTFS-Assets%2FGSD%2FReference-Materials%2Fidentifying-mirna-normalizers-white-paper.pdf&title=V2hpdGUgUGFwZXI6IEEgdGVjaG5pY2FsIGd1aWRlIHRvIGlkZW50aWZ5aW5nIG1pUk5BIG5vcm1hbGl6ZXJzIHVzaW5nIFRhcU1hbiBBZHZhbmNlZCBtaVJOQSBBc3NheXM=.
- Schmittgen TD, Livak KJ. Analyzing real-time PCR data by the comparative CT method. Nat Protoc. 2008;3:1101–1108.
- Livak KJ, Schmittgen TD. Analysis of relative gene expression data using real-time quantitative PCR and. Methods. 2001;25:402–408.
- Julian GS, de Oliveira RW, Perry JC, et al. Validation of housekeeping genes in the brains of rats submitted to chronic intermittent hypoxia, a sleep apnea model. PLoS One. 2014;9:e109902.
- Walder RY, Wattiez A-S, White SR, et al. Validation of four reference genes for quantitative mRNA expression studies in a rat model of inflammatory injury. Mol Pain. 2014;10:55.
- Gevaert AB, Witvrouwen I, Vrints CJ, et al. MicroRNA profiling in plasma samples using qPCR arrays: recommendations for correct analysis and interpretation. Plos One. 2018;13:e0193173.
- Fachim HA, Siddals K, Malipatil N, et al. Lifestyle intervention in individuals with impaired glucose regulation affects Caveolin-1 expression and DNA methylation. Adipocyte. 2020;9:96–107.
- Su J-L, Chen P-S, Johansson G, et al. Function and regulation of Let-7 family microRNAs. MicroRNA E. 2012;1:34–39.
- Boyerinas B, Park SM, Hau A, et al. The role of let-7 in cell differentiation and cancer. Endocrine-Related Cancer. 2010;17:F19-F36.
- Bonauer A, Carmona G, Iwasaki M, et al. MicroRNA-92a controls angiogenesis and functional recovery of ischemic tissues in Mice. Science. 2009;324:1710–1713.
- Hourigan ST, Solly EL, Nankivell VA, et al. The regulation of miRNAs by reconstituted high-density lipoproteins in diabetes-impaired angiogenesis. Sci Rep. 2018;8. DOI:10.1038/s41598-018-32016-x.
- Wang X, Zheng Y, Ma Y, et al. Lipid metabolism disorder induced by up-regulation of miR-125b and miR-144 following β-diketone antibiotic exposure to F0-zebrafish (Danio rerio). Ecotoxicol Environ Saf. 2018;164:243–252.
- Ma W, Kang Y, Ning L, et al. Identification of microRNAs involved in gefitinib resistance of non-small-cell lung cancer through the insulin-like growth factor receptor 1 signaling pathway. Exp Ther Med. 2017;14:2853–2862.
- Poloznikov AA, Nikulin SV, Raigorodskaya MP, et al. Changes in the metastatic properties of MDA-MB-231 cells after IGFBP6 gene knockdown is associated with increased expression of miRNA genes controlling INSR, IGF1R, and CCND1 genes. Bull Exp Biol Med. 2019;166:641–645.
- Jones A, Danielson KM, Benton MC, et al. miRNA signatures of insulin resistance in obesity. Obesity. 2017;25:1734–1744.
- Narayanan R, Fu B, Payton A, et al. IGF2 gene polymorphisms and IGF-II concentration are determinants of longitudinal weight trends in Type 2 diabetes. Exp Clin Endocrinol Diabetes. 2013;121:361–367.
- Minchenko DO, Tsymbal DO, Davydov VV, et al. Expression of genes encoding IGF1, IGF2, and IGFBPs in blood of obese adolescents with insulin resistance. Endocr Regul. 2019;53:34–45.
- Kammel A, Saussenthaler S, Jähnert M, et al. Early hypermethylation of hepatic Igfbp2 results in its reduced expression preceding fatty liver in mice. Hum Mol Genet. 2016;25:2588–2599.
- Biernacka KM, Uzoh CC, Zeng L, et al. Hyperglycaemia-induced chemoresistance of prostate cancer cells due to IGFBP2. Endocr Relat Cancer. 2013;20:741–751.
- Lu P, Zhao Z. Advances on PPARγ research in the emerging era of precision medicine. Curr Drug Targets. 2018;19:663–673.
- Clemmons DR. Metabolic actions of insulin-like growth factor-I in normal physiology and diabetes. Endocrinol Metab Clin North Am. 2012;41:425–443.
- Baxter RC, Twigg SM. Actions of IGF binding proteins and related proteins in adipose tissue. Trends Endocrinol Metab. 2009;20:499–505.
- Slaaby R, Schäffer L, Lautrup-Larsen I, et al. Hybrid receptors formed by insulin receptor (IR) and insulin-like growth factor I receptor (IGF-IR) have low insulin and high IGF-1 affinity irrespective of the IR splice variant. J Biol Chem. 2006;281:25869–25874.