
ABSTRACT
Adipose tissue inflammation plays an important role in the regulation of glucose and lipids metabolism. It is unknown whether Ursolic acid (UA) could regulate adipose tissue inflammation, though it can regulate inflammation in many other tissues. In this study, 3T3-L1 adipocytes, DIO mice and lean mice were treated with UA or vehicle. Gene expression of inflammatory factors, chemokines and immune markers in adipocytes and adipose tissue, cytokines in cell culture medium and serum, and inflammation regulatory pathways in adipocytes were detected. Results showed that UA increased the expression of interleukins and chemokines, but not TNFα, in both adipocytes and adipose tissue. IL6 and MCP1 levels in the cell culture medium and mouse serum were induced by UA treatment. Cd14 expression level and number of CD14+ monocytes were higher in UA treated adipose tissue than those in the control group. Glucose tolerance test was impaired by UA treatment in DIO mice. Mechanistically, UA induced the expression of Tlr4 and the phosphorylation levels of ERK and NFκB in adipocytes. In conclusion, our study indicated that short-term UA administration could induce CD14+ monocytes infiltration by increasing the production of interleukins and chemokines in mouse adipose tissue, which might further impair glucose tolerance test.
Introduction
Adipose tissue plays an important role in metabolic health, for it serves as not only a storage organ for excess energy in the form of triacylglycerol but also an endocrine organ for many cytokines, such as interleukin 6 (IL6), tumour necrosis factor α (TNFα), monocyte chemokine protein 1 (MCP1), macrophage inflammatory protein 2 (MIP2), adiponectin and leptin, which regulate systemic insulin sensitivity and energy homoeostasis [Citation1–4]. Lipids homoeostasis in the adipose tissue is mediated by lipogenesis and lipolysis. Lipogenesis, which means lipids synthesis, is mediated by lipogenic enzymes, such as fatty acid synthetase (FASN), stearoyl-CoA desaturase 1 (SCD1) and acetyl CoA carboxylase (ACC). Lipolysis, which means fat mobilization, is mediated by adipose triglyceride lipase (ATGL) and hormone-sensitive lipase (HSL) [Citation5]. Inflammatory factors and chemokines can regulate lipids metabolism in adipose tissue [Citation3,Citation6]. IL6 and TNFα induce lipolysis and suppress lipogenesis, while chemokines mediate adipose tissue to recruit macrophages and monocytes, which can produce more inflammatory factors to impair adipose homoeostasis. Dysfunction of adipose tissue, especially adipose tissue inflammation, contribute to the development of insulin resistance and metabolic disorders [Citation6–8].
Ursolic acid (UA), a pentacyclic triterpenic acid distributed in a variety of traditional medicine herbs and edible plants, has multiple biological functions, including regulation of glucose and lipids metabolism, anti-cancer, anti-oxidation and anti-inflammation [Citation9]. UA has been proved to ameliorate hepatic steatosis, suppress adipogenesis of pre-adipocytes, and stimulate lipolysis in cultured adipocytes [Citation10–13]. Besides, UA was also reported to regulate inflammation in macrophages, mammary epithelial cells, liver, skin, lung, kidney and intestine, with both anti- and pro-inflammatory effects in different cell types and tissues [Citation9,Citation14–18]. However, the effect of UA on adipose tissue inflammation has not been reported.
Nuclear factor kappa B (NFκB) signalling pathway is a key regulator for the secretion of IL6, TNFα, interleukin 1β (IL1β) and other pro-inflammatory cytokines under the treatment of UA [Citation19,Citation20]. Furthermore, it is reported that the effect of UA on IL6 production was also mediated by toll-like receptor 4 (TLR4) and inhibitor of kappa B kinase beta (IKKβ) in macrophages, by extracellular regulated protein kinases (ERK) in liver, and by Caspase-3 in BEAS-2B cells [Citation21–23].
To clarify the effect of UA on adipose tissue inflammation, we treated both 3T3-L1 adipocytes and mice with UA, and found that short-term UA administration could induce the expression of interleukins, chemokines and inflammation regulatory genes in both cultured adipocytes and adipose tissue. Moreover, UA treatment stimulated the adipose tissue to recruit CD14 positive monocytes.
Material and methods
Animal study
Animal study protocol (SICAU-2017-028) was reviewed and approved by the Animal Care and Use Committee of Sichuan Agricultural University. All animal procedures were performed according to the guide for the care and use of laboratory animals of the National Institute of Health. C57BL/6 J male and female mice were obtained from Laboratory Animal Research Centre of Sichuan University (Chengdu, China), and were housed under the temperature of 22 ± 2°C and humidity of 60 ± 5% with 12 h light/dark cycle.
Fifteen 5-week-old female mice with similar body weight were fed with high fat diet (HFD, 60% energy was from fat, Medicience Ltd, Yangzhou, China). At 19-week of age, mice were randomized into 3 groups with similar body weight (BW). Mice in group 1 (Control, n = 5) were intraperitoneally (i.p.) injected with the vehicle (dimethyl sulphoxide, DMSO, Sigma, Shanghai, China), mice in group 2 (UA10, n = 5) were injected with UA (Sigma, Shanghai, China) at 10 mg/kg BW and mice in group 3 (UA20, n = 5) were injected with UA at 20 mg/kg BW.
Thirteen 12-week-old male lean mice with the similar weight were randomly divided into two groups. One group (n = 7) was injected with DMSO at 0.35 mL/kg BW, and the other group (n = 6) was injected with UA at 20 mg/kg BW. All mice were fed with normal chow diet (Dashuo, Chengdu, China).
All mice were injected once daily for 3 d. In the evening of the third day, mice were starved for 12 h. The next morning, mice were sacrificed 2 h after UA or vehicle injection. Bodyweight was recorded, tail vein blood glucose levels were measured with glucose strips (Beijingyicheng, Beijing, China). Blood, gonadal adipose tissues, perirenal adipose tissues and subcutaneous adipose tissues were collected, weighed and frozen in liquid nitrogen, followed by storing at −80°C for further analysis. One piece of gonadal fat tissue was fixed in 4% formalin for haematoxylin and eosin stain and immunohistology stain. The weights of gonadal adipose tissues, perirenal adipose tissues and subcutaneous adipose tissues were summed as weight of total white adipose tissue (WAT).
GTT and ITT study
Glucose tolerance test (GTT) and insulin tolerance test (ITT) were performed as previously reported [Citation24]. Briefly, 19-week-old female diet-induced obese mice were intraperitoneally injected with UA or vehicle (n = 7 per group) daily. On day 4, mice were intraperitoneally injected with 0.75 g/kg BW glucose (Sigma) after an overnight (12 h) fast. Blood glucose levels were measured with tail-vein blood with glucose strips at 0, 15, 30, 45, 60 and 90 min post glucose injection. Mice were then put back to recover for 3 d with daily injection of UA or vehicle.
ITT was performed on day 7 of UA treatment after 6 h-fasting. Mice were intraperitoneally injected with 1.2 U/kg BW of insulin. Blood glucose levels were measured at 0, 15, 30, 45, 60 and 90 min post insulin injection.
Cell culture
The culture and differentiation of 3T3-L1 preadipocytes (ATCC) were performed as previously reported [Citation24]. Briefly, 3T3-L1 preadipocytes were cultured in 10% foetal bovine serum (FBS) (Gibco, Shanghai, China), 100 U/mL penicillin and 100 μg/mL streptomycin (Gibco, Shanghai, China) supplemented DMEM (Gibco, Shanghai, China), under the condition of 37°C and 5% CO2. Cells were subcultured into a 12-well plate at the density of 5 × 10⁵ per well. Two days after 100% confluence, cells were incubated in 10% FBS containing DMEM, plus 1 µg/mL insulin (Sigma), 1 µM dexamethasone (Sigma) and 0.5 mM isobutyl methylxanthine (Sigma) for 4 d. Cells were then continually maintained in 10% FBS containing DMEM with 1 µg/mL insulin for another 6 d. Medium was freshly changed every other day. Cells were then treated with UA (Sigma) or vehicle (DMSO) after 12 h-incubation in serum-free DMEM.
Measure of inflammatory cytokines
Serum levels of IL6, TNFα and MCP1 were measured with the respective ELISA kits (BioLegend, San Diego, CA, USA) according to the instructions of manufacturer, as previously reported [Citation24].
For the detection of IL6 and MCP1 levels in the cell culture medium, fully differentiated 3T3-L1 adipocytes were treated with 25 µM UA or vehicle for 12 h in serum-free DMEM. Levels of IL6 and MCP1 in the medium were quantified with the respective ELISA kits (BioLegend).
Histochemistry and immunohistochemistry straining
The formalin fixed gonadal adipose tissues were embedded in paraffin and were sliced into 4 µm sections. H&E staining was performed as previously reported [Citation24]. Briefly, sections were dehydrated and stained with haematoxylin for 5 min, followed by 2 min staining with eosin after washing with double distilled water. Sections were then dehydrated and mounted onto slides with a neutral resin.
Immunohistochemistry straining was performed by Servicebio (Wuhan, China) using the DAB-stain method. Anti-CD14 antibody (Servicebio, Wuhan, China) was used at the dilution of 1:200.
Images were captured on a microscope (TS100, Nikon, Tokyo, Japan) with a CCD (DS-U3, Nikon, Tokyo, Japan) using imaging software (NIS-Elements F3.2, Nikon).
RNA extraction and real-time PCR
Total RNA was isolated from gonadal adipose tissues and adipocytes with TRI Reagent (Sigma, Shanghai, China) under the manufacturer’s instruction. The quality of total RNA was assessed by agarose gel and the concentration was measured with a spectrophotometer (NanoDrop 2000, Thermo Fisher Scientific, Shanghai, China). cDNA was synthesized with 1 µg total RNA using a reverse-transcription PCR kit (Takara, Dalian, China). Real-time quantitative PCR was performed with Power SYBR Green RT-PCR reagents (Biorad, Shanghai, China) using the QuantStudioTM 6 Flex System (Applied Biosystems, USA). The PCR conditions were 1 cycle of 95°C for 30 s and 40 cycles of 95°C for 15 s followed by 60°C for 1 min. Data were analysed by 2-delta CT method with Bactin as the reference gene. Sequences of the primers were given in Supplementary Table S1.
Western blot analysis
Western blot analysis was performed as previously reported [Citation25]. Briefly, total proteins were extracted from 3T3-L1 adipocytes and adipose tissues using cell lysis buffer (Beyotime, Shanghai, China) supplemented with protease inhibitor (Roche, Mannheim, Germany). Twenty-microgram protein of each sample was separated in 10% polyacrylamide gel (Beyotime, Shanghai, China) and then was transferred onto PVDF membrane (BioRad). The membranes were blocked in 1 × TBS solution containing 1% bovine serum albumin (Beyotime) and 0.05% Tween-20 (BioRad, Shanghai, China) for 1 h at room temperature, followed by incubation with the appropriate primary antibodies overnight at 4°C. Antibodies to ACC1 (1:2000), pERK (1:2000), ERK (1:2000), pNFκB (1:2000), NFκB (1:2000), Caspase 3 (1:2000) and Tubulin (1:10,000) were obtained from Cell Signalling Technology (Shanghai, China). The membranes were then incubated with their appropriate second antibodies (Cell Signalling Technology) for 1 h after 6 times washing with 1 × TBST solution. After another 6 time-wash in 1 × TBST solution, the protein signalling on the membranes was obtained using the ChemiDocTM XRS+ imaging system (BioRad) with ECL western blotting detection reagent (BioRad). The blots were quantified by Image Lab 5.1 Software (BioRad).
Statistical analysis
Data were analysed using the software of SAS 9.4. One-way ANOVA with post hoc analysis was applied for multiple comparisons; independent t-test was utilized to compare the difference between two groups; repeated-measures ANOVA was used to analyse the statistical difference of GTT and ITT study. All data were presented as mean ± SEM and P value <0.05 was considered statistically significant.
Results
UA induced the expression of Il6 and chemokine genes in 3T3-L1 adipocytes
Results showed that the expression of Il6, but not Tnfa, could be induced by UA in adipocytes as compared with control group (,b)). Meanwhile, the expressions of chemokines Mcp1, Mcp3 and Mip2 were increased by UA treatment in adipocytes, in a dose and time dependent manner (,b)). Concentrations of IL6 and MCP1 in cell culture medium were also increased by UA treatment compared with the control group ()).
Figure 1. UA induced the expression of Il6 and chemokine genes in cultured adipocytes. (a) 3T3-L1 adipocytes were treated with vehicle, 10 µM, 25 µM or 50 µM UA for 12 h. Gene expression levels of Il6, Tnfa, Mcp1, Mcp3 and Mip2 in the cells were analysed. (b) 3T3-L1 adipocytes were treated with vehicle or 25 µM UA for the indicated time. Gene expression levels of Il6, Tnfa, Mcp1, Mcp3 and Mip2 in the cells were detected. (c) 3T3-L1 adipocytes were treated with vehicle or 25 µM UA for 12 h, concentrations of IL6 and MCP1 in the cell culture medium were measured. N = 3 per group. P values in the bar graph represent the results of one-way ANOVA analysis. Different letters of a, b and c on the bars indicate significant difference among the groups. Results represented one of three independently performed experiments
UA induced the expression of interleukin and chemokine genes in the adipose tissue of DIO mice
UA has been reported to suppress inflammatory gene expression in BEAS-2B bronchial epithelial cells and spinal cord, while induce inflammation in peritoneal macrophages [Citation14,Citation21,Citation26]. And, our in vitro data had revealed that UA induced the expression of Il6 and chemokine genes Mcp1, Mcp3 and Mip2 in adipocytes. To investigate the in vivo effect of UA on adipose inflammatory and chemokine gene expression, diet-induced obese (DIO) mice were treated with UA for 3 d. Results showed that UA treatment did not change the body weight, blood glucose level or adipose tissue weight (Supplementary Figure S1A-D). The expression of Il6, Il1b, Mcp1, Mcp3 and Mip2 in gonadal adipose tissue (gWAT) were remarkably induced by UA, as compared to those in the control group ()). However, UA did not change the expression of Tnfa in the gWAT ()). Further study indicated that serum levels of IL6 and MCP1 were increased by 20 mg/kg UA treatment as compared to those in the control mice ()). No difference of serum TNFα level was observed between the UA treated mice and control mice ()).
Figure 2. UA promoted the expression of interleukin and chemokine genes in the adipose tissue of DIO mice. DIO mice were treated with UA or vehicle for 3 d. (a) Il6, Il1b and Tnfa expression levels in gonadal fat tissues. (b) Mcp1, Mcp3 and Mip2 expression levels in gonadal fat tissues. (c) Concentrations of IL6, TNFα and MCP1 in mouse serum. N = 5 mice per group. P values in the bar graph represent the results of one-way ANOVA analysis. Different letters of a and b on the bars indicate significant difference among the groups

UA induced the expression of interleukin and chemokine genes in the adipose tissue of lean mice
The obese individuals have higher adipose tissue inflammation level and macrophage content than the lean individuals [Citation6]. Thus, we next tested the effect of UA on adipose tissue inflammation in lean mice. Similar to the results in DIO mice, UA administration did not change the body weight or the adipose tissue weight as compared to the control group (Supplementary Figure S2A-C). Gene expression of Il6, Il1b, Mcp1, Mcp3 and Mip2, but not Tnfa, were upregulated by UA in the gWAT of lean mice, as compared with those of the control mice ()). Besides, serum level of MCP1 was significantly higher in the UA treated mice than that in the control mice ()). However, no significant difference of serum IL6 was observed between the UA group and control group ()).
Figure 3. UA induced the expression of interleukin and chemokine genes in the adipose tissue of lean mice. Normal chow fed mice were treated with UA (n = 6) or vehicle (n = 7) for 3 d. (a) Gene expression levels Il6, Il1b and Tnfa in gonadal fat tissues. (b) Mcp1, Mcp3 and Mip2 expression levels in gonadal fat tissues. (c) Serum levels of IL6. (d) Serum levels of MCP1. *P < 0.05, **P < 0.01 Veh VS UA
UA inhibited the expression of lipogenic genes in 3T3-L1 adipocytes
It has been reported that UA suppressed lipogenesis in liver and inhibited adipogenesis in 3T3-L1 preadipocytes [Citation13]. Here, we tested the effect of UA on lipogenic genes expression in 3T3-L1 mature adipocytes. Results showed that UA significantly suppressed the gene expression of Acc1, Fasn and Sterol regulatory element-binding protein 1 c (Srebp1c) in adipocytes at the doses of 25 and 50 µM, as compared to the control group ()). Besides, the protein level of ACC1 was decreased by 25 µM and 50 µM UA, as compared to the control group ()). As forkhead box protein O1 (FOXO1) has been reported to suppress lipogenesis [Citation27]. We investigated Foxo1 expression in the adipocytes. Result showed that the Foxo1 expression was remarkably increased by UA treatment compared with that in the control cells ()). These data indicated that UA could suppress lipogenesis in cultured adipocytes.
Figure 4. UA suppressed lipogenic gene expression in adipocytes. 3T3-L1 adipocytes were treated with vehicle, 10 µM, 25 µM or 50 µM UA for 12 h. (a) Gene expression levels of Acc1, Fasn and Srebp1c. (b) ACC1 protein levels in the cells. (c) Gene expression levels of Foxo1. P values in the bar graph represent the results of one-way ANOVA analysis. Different letters of a, b and c on the bars indicate significant difference among the groups. N = 3 per group. Results represented one of three independently performed experiments
UA stimulated white adipose tissue to recruit CD14+ monocytes
Increased expression and secretion of chemokines in adipose tissue could stimulate immune cells to infiltrate into adipose tissue [Citation6,Citation28]. Thus, expression of the marker genes of immune cells was measured in the adipose tissue. Results showed that the expression of F4/80 and Cd11 c, markers of macrophage, were not changed by UA treatment in the gWAT of lean mice, as compared to those in the control mice ()). For the marker genes of monocytes, primary T cells and neutrophil, UA only increased the expression of Cd14 and Ly6g, but not Cd4, Cd3e, Cd8b1, Ccr6 or Cd11b in the gWAT of lean mice compared with the control group ()). Similarly, only the expression of Cd14 and Ly6g were increased by UA in the gWAT of DIO mice (Supplementary Figure S3).
Figure 5. UA stimulated white adipose tissue to recruit CD14+ monocytes. Normal chow fed male mice were treated with UA (n = 6) or vehicle (n = 7) for 3 d. (a) Gene expression levels of F4/80, Cd11 c, Cd14, Cd4, Cd3e, Cd8b1, Ccr6, Ly6g and Cd11b in gonadal fat tissues. (b) H&E staining images for gonadal fat tissues. Red arrows indicate crown-like structures. (c) Images for CD14 immunohistochemical stain of gonadal fat tissues. Red arrows indicate CD14 positive monocytes. (d) Average numbers of CD14 positive monocytes per images. *P < 0.05 Veh VS UA
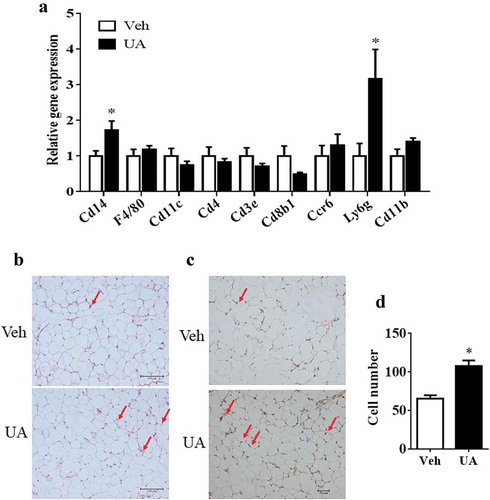
H&E staining and immunohistology straining were then performed to check the CD14+ cells in the adipose tissue of lean mice. Results showed that the number of CD14+ monocytes was increased in the adipose tissues of UA treated mice as compared to that in the control mice (-d)).
UA administration-impaired mouse glucose tolerance test
It was reported that chronic adipose tissue inflammation could impair insulin sensitivity and induce lipids metabolic disorder [Citation4]. Thus, we further analysed the glucose tolerance test, insulin tolerance test and lipids metabolic gene expression. Results showed that UA trended to impair mouse glucose tolerance test as compared to the control group ()). However, insulin tolerance test was not changed by UA treatment ()). Besides, short-term UA administration did not change the expression of lipogenic or lipolytic genes in lean or DIO mice compared with the control group (Supplementary Figure S4A,B).
Figure 6. UA administration trended to impair glucose tolerance test in DIO mice. Diet-induced obese mice were daily injected with UA or vehicle for 3 d (n = 7 per group). Glucose tolerance test (a) was performed on day 4, and insulin tolerance test (b) was performed on day 7 of UA treatment. P values in the bar graph represent the results of repeated-measures ANOVA analysis
UA upregulated expression of Tlr4 and phosphorylation levels of ERK and NFκB in adipocytes
As the inflammatory gene expression is regulated by TLR4 in macrophages and epithelial cells, so the expression of Tlr4 was tested in both cultured adipocytes and adipose tissue. Results showed that UA could induce the expression of Tlr4 in a dose-dependent manner in 3T3-L1 adipocytes, as compared to the control group ()). Besides, UA treatment, from 6 h to 24 h, could induce the expression of Tlr4 ()). In vivo study also showed that the expression of Tlr4 was increased by UA in the gWAT of lean mice as compared that of the control mice ()).
Figure 7. UA upregulated the expression of Tlr4 and the phosphorylation levels of ERK and NFκB. (a) Tlr4 expression levels in 3T3-L1 adipocytes which were treated with vehicle, 10 µM, 25 µM or 50 µM UA for 12 h (n = 3 per group). (b) Tlr4 expression levels in 3T3-L1 adipocytes which were treated with 25 µM UA or vehicle for the indicated time (n = 3 per group). (c) Tlr4 expression levels in the gonadal adipose tissue of lean mice which were treated with vehicle or UA (n = 6–7 per group). (d,e) Phosphorylation levels of ERK and NFκB in the 3T3-L1 adipocytes which were treated with 25 µM UA or vehicle for 30 min (n = 3 per group). (f) Illustration for UA stimulating adipose tissue to recruit CD14+ monocytes. *P < 0.05, **P < 0.01 Veh VS UA. P values in the bar graph represent the results of one-way ANOVA analysis. Different letters of a, b and c on the bars indicate significant difference among the groups. Results for cell studies represented one of three independently performed experiments
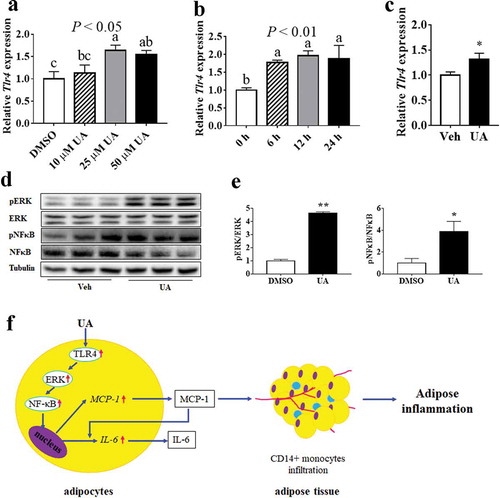
ERK/NFκB pathway was reported to be involved in the regulation of inflammation. Our data showed that the phosphorylation levels of both ERK and NFκB were upregulated by UA in 3T3-L1 adipocytes, as compared to the control group (,e)). However, the protein level of Caspase 3, another regulator for inflammatory genes, was not changed by UA treatment in adipocytes compared with the control group (Supplementary Figure S5A,B).
Discussion
Adipose tissue is the major organ for excess energy storage, as well as an endocrine organ which secretes inflammatory factors and chemokines. Here, we found that short-time treatment with UA induced the production of IL6, IL1β, MCP1, MCP3 and MIP2 in both adipocytes and adipose tissue, and subsequently stimulated the adipose tissue to recruit CD14+ monocytes. Besides, we also revealed that short-time UA treatment trended to impair glucose tolerance test in diet-induced obese mice. Our results are important for the functional study of UA.
Adipose tissue secretes many cytokines, such as IL6, TNFα, MCP1 and MIP2, who play important roles in the regulation of metabolism and immunity [Citation1,Citation4,Citation29,Citation30]. Our results suggested that UA remarkably increased the expression of interleukin and chemokine genes, but not Tnfa, in both cultured adipocytes and mouse adipose tissue. Meanwhile, serum concentration of MCP1 was induced by UA treatment in both DIO mice and lean mice, while serum IL6 level was increased by UA treatment in lean mice. Previous studies have reported that UA inhibited inflammation in many tissues and cells, including liver, kidney, spinal cord, intestine and macrophages [Citation9,Citation16,Citation18,Citation23,Citation26,Citation31]. However, some other studies found that UA enhanced proinflammatory factors expression in resting macrophages and mouse skin [Citation14,Citation15,Citation20]. Thus, UA has both positive and negative effects on the expression of inflammatory cytokines in different cell types and tissues. Our study demonstrated that UA stimulated the expression of interleukins Il6 and Il1b and chemokines Mcp1, Mcp3 and Mip2 in adipocytes and adipose tissue. It is interesting that only the expression of Il6, but not Tnfa, was elevated by UA in adipocytes. That might be because MCP1 could induce the expression of Il6, but not Tnfa [Citation32]. It has been reported that IL6 could induce hepatic insulin resistance [Citation33,Citation34]. Thus, short-term UA administration might impair hepatic insulin sensitivity by stimulating adipose tissue to secret IL6. Our data also demonstrated that UA administration trended to impair glucose tolerance test in DIO mice. The effect of long-term UA administration on adipose tissue inflammation and insulin sensitivity needs further study to be explored.
Previous study indicated that adipocyte-secreted MCP1 could stimulate the infiltration of macrophages into adipose tissue via MCP1/CCR2 pathway [Citation28]. Besides, MCP1 could also recruitment T lymphocytes and other immune cells to inflammation sites [Citation35,Citation36]. Our results indicated that UA markedly increased the expression of Cd14 and the number of CD14 positive monocytes in adipose tissue, while the expression of macrophage marker genes F4/80 and Cd11 c were not changed. These data indicated that short-time UA administration stimulated the white adipose tissue to recruit CD14 positive monocytes, but not macrophages. CD14 has been reported to induced inflammation and insulin resistance in adipose tissue [Citation37,Citation38]. Thus, short-term UA administration might impair adipose tissue insulin sensitivity by recruit CD14+ monocytes. It was reported that activated monocytes could be transferred to macrophages in adipose tissue [Citation39]. The reason why we did not observe the change of macrophage marker in UA treated adipose tissue might be because our study was a short-time study. Maybe, longer time of UA administration could change the content of macrophages in adipose tissue. However, the hypothesis needs further study to be confirmed.
According to previous studies, UA regulated the expression of TNFα, IL6 and IL1β via the key inflammatory transcription factor NFκB in activated T cells, B cells and macrophages [Citation20,Citation31]. Results of Ghosh suggested that TLR4 enhanced Il6, Tnfa and Mcp1 expression through NFκB pathway in adipose tissue of ageing mice [Citation40]. Another study showed that UA decreased Il6, Tnfa and Il1b expression by inhibiting TLR4/NFκB pathway in mouse macrophages [Citation22]. Besides, Thompson and colleagues suggested that NFκB stimulated the expression of MCP1 in astrocytes [Citation41]. Our results showed that UA stimulated Tlr4 expression and phosphorylation level of NFκB in adipocytes. Therefore, UA might up-regulate the production of interleukins and chemokines through the TLR4/NFκB signalling pathway in adipocytes ()).
Suppressed ERK/NFκB signalling was reported to mediate UA inhibiting inflammation in liver [Citation23]. Study of Ma et al. suggested that UA might inhibit ERK/NFκB pathway via inactivation of Caspase 3 [Citation21]. Our results found that though UA activated ERK/NFκB signalling pathway, but it did not change Caspase 3 protein level. These results indicated that UA might also induce the expression of interleukins and chemokines by activating ERK/NF-κB pathway ()). The protein level of Caspase 3 was not affected by UA in our study might be because we used different cells from other studies. Ma et al. used BEAS-2B epithelial cells [Citation21]. Wu et al., who found that UA stimulated ERK/NFκB pathway by activating Caspase 3, used human osteosarcoma cells [Citation42]. However, 3T3-L1 adipocytes were used in our study. Besides, FOXO1 was reported to induce the expression of Il6 and Mcp1 in adipocytes [Citation43]. The expression of Foxo1 was increased by UA in our study. Thus, FOXO1 might also be involved in UA inducing the expression of interleukins and chemokines in adipocytes.
Fat deposition is closely related to the expansion of adipose tissue mass. Overload of fat leads to adipose tissue hypertrophy, and even obesity [Citation44]. Thus, discovery of chemicals and components in herbs those can reduce body fat accumulation is very important for human health. As a triterpenoid extracted from plants and herbs, UA has shown its function on suppressing lipogenesis in liver and on inhibiting adipogenesis in 3T3-L1 preadipocytes [Citation10–12,Citation45]. Similarly, our study demonstrated that UA inhibited lipogenic gene expression in cultured adipocytes.
Many studies have reported that UA decreased adipose accumulation in DIO mice and rats [Citation12,Citation13,Citation46–48]. However, in those studies, the direct targets of UA seemed not to be the adipose tissue itself, but the liver and muscle. Because these reports did not show the expression of lipogenic genes or lipolytic genes in the adipose tissue. We observed neither the change of adipose tissue weight nor the change of lipogenic gene expression by UA treatment, in DIO mice or lean mice. The different results on adipose tissue weight change between our study and others might be because our study was a short-time trail with only 3-d treatment, while previous studies treated animals for at least 5 weeks. The study of Sundaresan et al. indicated that 5 mg/kg BW UA administration for 5 weeks caused a significant reduction in epididymal fat tissue weight [Citation48]. Jia and colleagues suggested that only 200 but not 50 mg/kg BW UA treatment for 8 weeks could reduce adipose accumulation in DIO mice [Citation13]. One study suggested that DIO mice took feed with 0.14% UA (w/w) for 6 weeks had lower epididymal fat weight than the control mice [Citation46], whereas Li et al. showed that intake of feed supplemented with 0.25% UA (w/w), but not the feed with 0.125% UA, for 6 weeks could decrease fat content in DIO rats [Citation12]. Another study showed that DIO mice, who drank water containing 0.05% UA (w/v) (equivalent to a dose of 10 mg/kg of body weight based on water consumption), accumulated less visceral fat after 15-week treatment than the control mice [Citation47]. These studies indicate that UA has the potent to suppress fat accumulation. However, the treatment conditions and the molecular mechanisms still need to be defined.
FOXO1 has been reported to suppress the expression of SREBP1c [Citation27], a transcriptional factor which upregulates ACC1 and FASN expression [Citation49,Citation50]. Our study demonstrated that UA stimulated Foxo1 expression and decreased Srebp1c expression in adipocytes. Thus, UA might suppress lipid synthesis through FOXO1/SREBP1c pathway in adipocytes. Besides, IL6 was reported to inhibit Fasn expression in DIO mouse liver [Citation51]. Our results showed that Il6 expression was significantly upgraded by UA in adipocytes. Therefore, UA might also suppress lipids synthesis through IL6 pathway in adipocytes. However, the exact mechanisms need further studies to be elucidated.
In summary, our study indicated that short-term UA administration could stimulate adipose tissue to recruit CD14+ monocytes by inducing the adipocytes to produce interleukins and chemokines via the TLR4/NFκB pathway.
Supplemental Material
Download MS Word (716.8 KB)Acknowledgments
We thank the staffs of Laboratory of Animal Disease-Resistant Nutrition on helping of sample analysis.
Disclosure statement
The authors declare that they have no conflicts of interest with the contents of this article.
Supplementary material
Supplemental data for this article can be accessed here.
Additional information
Funding
References
- Ahima RS. Adipose tissue as an endocrine organ. Obesity (Silver Spring). 2006;14(Suppl 5):242S–249S.
- Feng B, Jiao P, Nie Y, et al. Clodronate liposomes improve metabolic profile and reduce visceral adipose macrophage content in diet-induced obese mice. PLoS One. 2011;6:e24358.
- Feng B, Zhang T, Xu H. Human adipose dynamics and metabolic health. Ann N Y Acad Sci. 2013;1281:160–177.
- Reilly SM, Saltiel AR. Adapting to obesity with adipose tissue inflammation. Nat Rev Endocrinol. 2017;13:633–643.
- Scherer T, O’Hare J, Diggs-Andrews K, et al. Brain insulin controls adipose tissue lipolysis and lipogenesis. Cell Metab. 2011;13:183–194.
- Xu H, Barnes GT, Yang Q, et al. Chronic inflammation in fat plays a crucial role in the development of obesity-related insulin resistance. J Clin Invest. 2003;112:1821–1830.
- Guilherme A, Virbasius JV, Puri V, et al. Adipocyte dysfunctions linking obesity to insulin resistance and type 2 diabetes. Nat Rev Mol Cell Biol. 2008;9:367–377.
- Kahn CR, Wang G, Lee KY. Altered adipose tissue and adipocyte function in the pathogenesis of metabolic syndrome. J Clin Invest. 2019;129:3990–4000.
- Ikeda Y, Murakami A, Ohigashi H. Ursolic acid: an anti- and pro-inflammatory triterpenoid. Mol Nutr Food Res. 2008;52:26–42.
- Li Y, Kang Z, Li S, et al. Ursolic acid stimulates lipolysis in primary-cultured rat adipocytes. Mol Nutr Food Res. 2010;54:1609–1617.
- He Y, Li Y, Zhao T, et al. Ursolic acid inhibits adipogenesis in 3T3-L1 adipocytes through LKB1/AMPK pathway. PLoS One. 2013;8:e70135.
- Li S, Liao X, Meng F, et al. Therapeutic role of ursolic acid on ameliorating hepatic steatosis and improving metabolic disorders in high-fat diet-induced non-alcoholic fatty liver disease rats. PLoS One. 2014;9:e86724.
- Jia Y, Kim S, Kim J, et al. Ursolic acid improves lipid and glucose metabolism in high-fat-fed C57BL/6J mice by activating peroxisome proliferator-activated receptor alpha and hepatic autophagy. Mol Nutr Food Res. 2015;59:344–354.
- Ikeda Y, Murakami A, Fujimura Y, et al. Aggregated ursolic acid, a natural triterpenoid, induces IL-1beta release from murine peritoneal macrophages: role of CD36. J Immunol. 2007;178:4854–4864.
- Ikeda Y, Murakami A, Nishizawa T, et al. Ursolic acid enhances cyclooxygenases and tumor necrosis factor-alpha expression in mouse skin. Biosci Biotechnol Biochem. 2006;70:1033–1037.
- Chun J, Lee C, Hwang SW, et al. Ursolic acid inhibits nuclear factor-kappaB signaling in intestinal epithelial cells and macrophages, and attenuates experimental colitis in mice. Life Sci. 2014;110:23–34.
- Kim SH, Hong JH, Lee YC. Ursolic acid, a potential PPARgamma agonist, suppresses ovalbumin-induced airway inflammation and Penh by down-regulating IL-5, IL-13, and IL-17 in a mouse model of allergic asthma. Eur J Pharmacol. 2013;701:131–143.
- Li J, Li N, Yan S, et al. Ursolic acid alleviates inflammation and against diabetes induced nephropathy through TLR4mediated inflammatory pathway. Mol Med Rep. 2018;18:4675–4681.
- Zhang T, Su J, Guo B, et al. Ursolic acid alleviates early brain injury after experimental subarachnoid hemorrhage by suppressing TLR4-mediated inflammatory pathway. Int Immunopharmacol. 2014;23:585–591.
- You HJ, Choi CY, Kim JY, et al. Ursolic acid enhances nitric oxide and tumor necrosis factor-alpha production via nuclear factor-kappaB activation in the resting macrophages. FEBS Lett. 2001;509:156–160.
- Ma X, Zhang Y, Wang Z, et al. Ursolic acid, a natural nutraceutical agent, targets Caspase3 and alleviates inflammation-associated downstream signal transduction. Mol Nutr Food Res. 2017;61:1700332.
- Jang SE, Jeong JJ, Hyam SR, et al. Ursolic acid isolated from the seed of Cornus officinalis ameliorates colitis in mice by inhibiting the binding of lipopolysaccharide to Toll-like receptor 4 on macrophages. J Agric Food Chem. 2014;62:9711–9721.
- Ma JQ, Ding J, Zhang L, et al. Ursolic acid protects mouse liver against CCl4-induced oxidative stress and inflammation by the MAPK/NF-kappaB pathway. Environ Toxicol Pharmacol. 2014;37:975–983.
- Huang X, Jiang D, Zhu Y, et al. Chronic high dose zinc supplementation induces visceral adipose tissue hypertrophy without altering body weight in mice. Nutrients. 2017;9:E1138.
- Feng B, Huang X, Jiang D, et al. Endoplasmic reticulum stress inducer tunicamycin alters hepatic energy homeostasis in mice. Int J Mol Sci. 2017;18:E1710.
- Zhang Y, Song C, Li H, et al. Ursolic acid prevents augmented peripheral inflammation and inflammatory hyperalgesia in high-fat diet-induced obese rats by restoring downregulated spinal PPARalpha. Mol Med Rep. 2016;13:5309–5316.
- Deng X, Zhang W, I OS, et al. FoxO1 inhibits sterol regulatory element-binding protein-1c (SREBP-1c) gene expression via transcription factors Sp1 and SREBP-1c. J Biol Chem. 2012;287:20132–20143.
- Kanda H, Tateya S, Tamori Y, et al. contributes to macrophage infiltration into adipose tissue, insulin resistance, and hepatic steatosis in obesity. J Clin Invest. 2006;116:1494–1505.
- Vieira-Potter VJ. Inflammation and macrophage modulation in adipose tissues. Cell Microbiol. 2014;16:1484–1492.
- Grant RW, Dixit VD. Adipose tissue as an immunological organ. Obesity (Silver Spring). 2015;23:512–518.
- Checker R, Sandur SK, Sharma D, et al. Potent anti-inflammatory activity of ursolic acid, a triterpenoid antioxidant, is mediated through suppression of NF-kappaB, AP-1 and NF-AT. PLoS One. 2012;7:e31318.
- Ziraldo C, Vodovotz Y, Namas RA, et al. Central role for MCP-1/CCL2 in injury-induced inflammation revealed by in vitro, in silico, and clinical studies. PLoS One. 2013;8:e79804.
- Matsubara T, Mita A, Minami K, et al. PGRN is a Key Adipokine Mediating High Fat Diet-Induced Insulin Resistance and Obesity through IL-6 in Adipose Tissue. Cell Metab. 2012;15:38–50.
- Kim JH, Kim J, Liu H-Y, et al. Regulation of IL-6 induced hepatic insulin resistance by mtor through the STAT3-SOCS3 pathway. J Biol Chem. 283:708–715.
- Karimian MS, Pirro M, Majeed M, et al. Curcumin as a natural regulator of monocyte chemoattractant protein-1. Cytokine Growth Factor Rev. 2017;33:55–63.
- Hayashida K, Nanki T, Girschick H, et al. Synovial stromal cells from rheumatoid arthritis patients attract monocytes by producing MCP-1 and IL-8. Arthritis Res. 2001;3:118–126.
- Fernández-Real JM, Pérez Del Pulgar S, Luche E, et al. CD14 modulates inflammation-driven insulin resistance. Diabetes. 2011;60:2179–2186.
- Luche E, Cousin B, Garidou L, et al. Metabolic endotoxemia directly increases the proliferation of adipocyte precursors at the onset of metabolic diseases through a CD14-dependent mechanism. Mol Metab. 2013;2:281–291.
- Russo L, Lumeng CN. Properties and functions of adipose tissue macrophages in obesity. Immunology. 2018;155:407–417.
- Ghosh AK, O’Brien M, Mau T, et al. Toll-like receptor 4 (TLR4) deficient mice are protected from adipose tissue inflammation in aging. Aging (Albany NY). 2017;9:1971–1982.
- Thompson WL, Van Eldik LJ. Inflammatory cytokines stimulate the chemokines CCL2/MCP-1 and CCL7/MCP-3 through NFkB and MAPK dependent pathways in rat astrocytes. Brain Res. 2009;1287:47–57.
- Wu CC, Cheng CH, Lee YH, et al. Ursolic acid triggers apoptosis in human osteosarcoma cells via caspase activation and the ERK1/2 MAPK pathway. J Agric Food Chem. 2016;64:4220–4226.
- Ito Y, Daitoku H, Foxo FA. increases pro-inflammatory gene expression by inducing C/EBPbeta in TNF-alpha-treated adipocytes. Biochem Biophys Res Commun. 2009;378:290–295.
- Lafontan M. Adipose tissue and adipocyte dysregulation. Diabetes Metab. 2014;40:16–28.
- Sundaresan A, Radhiga T, Pugalendi KV. Effect of ursolic acid and Rosiglitazone combination on hepatic lipid accumulation in high fat diet-fed C57BL/6J mice. Eur J Pharmacol. 2014;741:297–303.
- Kunkel SD, Elmore CJ, Bongers KS, et al. Ursolic acid increases skeletal muscle and brown fat and decreases diet-induced obesity, glucose intolerance and fatty liver disease. PLoS One. 2012;7:e39332.
- Rao VS, de Melo CL, Queiroz MG, et al. Ursolic acid, a pentacyclic triterpene from Sambucus australis, prevents abdominal adiposity in mice fed a high-fat diet. J Med Food. 2011;14:1375–1382.
- Sundaresan A, Harini R, Pugalendi KV. Ursolic acid and rosiglitazone combination alleviates metabolic syndrome in high fat diet fed C57BL/6J mice. Gen Physiol Biophys. 2012;31:323–333.
- Kim JB, Sarraf P, Wright M, et al. Nutritional and insulin regulation of fatty acid synthetase and leptin gene expression through ADD1/SREBP1. J Clin Invest. 1998;101:1–9.
- Hagiwara A, Cornu M, Cybulski N, et al. Hepatic mTORC2 activates glycolysis and lipogenesis through Akt, glucokinase, and SREBP1c. Cell Metab. 2012;15:725–738.
- Ma Y, Gao M, Sun H, et al. Interleukin-6 gene transfer reverses body weight gain and fatty liver in obese mice. Biochim Biophys Acta. 2015;1852:1001–1011.