
ABSTRACT
Aurora-A kinase, a serine/threonine mitotic kinase, is reportedly upregulated in skin tissues of individuals with type 2 diabetes mellitus , although its function in diabetes is unclear. C57BL/6 J mice were utilized to establish a type 2 diabetic model and explore the functions of Aurora-A in diabetes. Aurora-A was highly expressed in the pancreas of the diabetic mice as confirmed by western blot. Inhibition of Aurora-A did not affect fasting blood glucose and body weight, but did improve insulin resistance, as indicated by improved oral glucose tolerance, insulin tolerance, and the Homoeostasis Model Assessment-Insulin Resistance index. Blockade of Aurora-A dramatically decreased the number of infiltrating macrophages in the pancreas in parallel with decreases in the levels of serum insulin and interleukin-6 (IL-6) mRNA. The levels of phosphorylated forms of protein kinase B, which are the key mediators of in insulin resistance, were not induced in liver, adipocyte tissues, and skeletal muscle by alisertib treatment. Our findings indicate that suppression of Aurora-A could at least partially enhance insulin sensitivity by decreasing the number of infiltrating macrophages and IL-6 level in a type 2 diabetic mouse model.
Introduction
Diabetes, which is characterized by hyperglycaemia, is one of the major metabolic disorders in the present century. Prolonged hyperglycaemia causes a series of fatal complications [Citation1]. Global projections of diabetes in 2017 estimated that 700 million adults worldwide would have diabetes by 2045. There are already 425 million diabetic adults [Citation2]. A combination of peripheral insulin resistance (IR) and dysfunctional insulin secretion by pancreatic β-cells is implicated in the pathogenesis of type 2 diabetes mellitus (T2DM) [Citation3]. Many epidemiological studies have shown that chronic subclinical inflammation may be associated with the transformation of IR and T2DM 53 [Citation4,Citation5].
IR refers to a decrease in insulin sensitivity. To maintain normal operation of the body, more insulin needs to be released, which leads to hyperinsulinemia [Citation6]. IR is closely associated with the occurrence and development of T2DM. Recent studies have documented the interference with the insulin signal transduction pathway after the insulin receptor intersects with the signal transduction of inflammatory factors, and due to the inflammatory factors produced by non-specific inflammation interfere. These are the main molecular mechanisms of IR caused by inflammation. Given the continuing increase in the global diabetic population and the enormous impact of diabetes on patient health and welfare, there is an urgent need to define factors and mechanisms that contribute to IR in diabetes and to identify new therapeutic targets. Aurora-A is one of the three proteins in the Aurora family. Aurora-A localizes to centrosomes and spindle poles, and has been implicated in centrosome maturation and spindle assembly [Citation7]. Elevated levels of Aurora-A are generally detected in human cancers and are associated with poor prognosis [Citation8,Citation9]. Aurora-A preferentially induces β-cell DNA replication and promotes rat β-cell replication and the mitotic cell cycle [Citation10]. Additionally, Aurora-A is also involved in controlling nuclear factor-kappa B-mediated inflammatory through the protein kinase B (AKT) pathway as well as IĸB stabilization [Citation11]. Recently, it was shown that aberrant expression of Aurora-A is increased in the skin tissues of diabetic patients [Citation12].
The foregoing findings indicate that Aurora-A may be a novel target in the treatment of IR. To explore this, we presently detected the expression of Aurora-A and clarified its role in a mouse model of T2DM.
Materials
Reagents
Streptozotocin (STZ) was purchased from VICMED (Jiangsu, China). Neutral insulin injection solution was purchased from Wanbang (Jiangsu, China).
Equipments
Equipments used were detailed in the following subsections.
Experimental animals
Four-week-old male C57BL/6 J mice obtained from Vital River (Beijing, China) were housed under environmentally controlled conditions. All experimental procedures complied with the Provision and General Recommendation of the Chinese Laboratory Association and were approved by the Institutional Animal Care and Use Committee of Xuzhou Medical University.
Induction of diabetes in mice and drug administration
After adjusting to the laboratory environment for 7 days prior to the experiments, mice were fed normal chow (Normal) or a high-fat diet (HFD) for 7 days. The HFD contained 60% fat and 40% standard chow (Research Diets Inc., New Brunswick, NJ, USA). The mice were fasted for 16 h before receiving STZ. STZ was dissolved in freshly prepared 100 mM citrate buffer (pH 4.5) and administered by intraperitoneal injection at 85 mg/kg on days 0 and 1. The Normal and HFD groups of mice were injected with the same amount of citrate buffer. During the injection, mice in the HFD group injected with STZ were orally administered 5% glucose (2 mL/kg body weight) 24 h after each injection to prevent initial mortality due to STZ-induced hypoglycaemia.
Mice displaying fasting plasma glucose (FPG) levels higher than 11.1 mM [Citation13] were considered HFD/STZ-diabetic mice. FPG levels and body weight were monitored once a week for 5 weeks. To assess the role of Aurora-A in the diabetic model (DM), beginning at week 4 the DM group was orally treated daily with 20 mg/kg of alisertib, a novel oral Aurora-A inhibitor, for 2 weeks. The N and HFD groups received the same amount of normal saline every day. During the trial, individual body weight and FBG levels were measured once a week. At the termination of the study, the mice were sacrificed. Blood samples were collected from the vein behind the eye sockets and stored at −80°C until analyses. Pancreatic samples were immediately acquired and stored at −80°C until required.
FPG concentration
Blood (0.1 mL) was collected from the orbital vein and orbital artery of mice after 16 h of fasting and before their sacrifice. The PG concentration was measured 16 h after removal of food at 7 p.m. This represented the FPG concentration. The determination was made using a blood glucose device (Sanwa Kagaku, Nagoya, Japan). Immediately after the measurement was made, mice were provided with food.
Oral glucose tolerance test (OGTT)
Mice were fasted for 16 h before oral administration of glucose solution (2.0 g/kg). PG concentration was measured 30 min prior to glucose administration (‘Pre’) and 15, 30, 60, and 120 min after glucose administration on day 35 after induction of diabetes.
Insulin tolerance test (ITT)
Mice were fasted for 16 h before the subcutaneous injection of insulin (0.04 U/10 g of body weight). PG concentration was measured 30 min prior to insulin injection (‘Pre’) and 30, 60, and 120 min after the injection of insulin on day 36 after induction of diabetes. Insulin (Penfil R, 100 U/mL) was diluted with insulin dilution buffer (10 mM HCl solution containing 0.1–0.25% phenol and 1.4–1.8% glycerine) according to the manufacturer’s instructions.
Measurement of insulin and other biochemical parameters
Insulin and other biochemical parameters were measured at the end of the study. Briefly, blood samples were collected from the ocular artery 16 h after fasting. The serum was used to detect the levels of insulin, total cholesterol (TC), and triglycerides (TG). Serum insulin levels were measured using a Mouse Insulin ELISA kit (BioVision Inc., Milpitas, CA, USA). TG and TC were measured with respective kits (Jiancheng, Nanjing, China). The Homoeostasis Model Assessment of Insulin Resistance (HOMA-IR) was calculated as (FPG [mmol/L] × fasting plasma insulin [uUI/ml])/22.5.
Mouse islet isolation and Ki-67 staining
Islets were isolated from the pancreas of mice after collagen digestion as described previously [Citation14]. Briefly, the pancreas was injected with 5 mL of cold enzyme solution (Hank’s Balanced Salt Solution containing 25 mM HEPES buffer and collagenase Type V; Sigma-Aldrich, St. Louis, MO, USA). The pancreas was removed from each mouse and digested at 37°C for 18 min. Enzymatic activity was terminated following the addition of cold (4°C) 10% RPMI. Islets were then isolated by centrifugation, decanting the supernatant, resuspension, and filtering through a 450-μm screen. Finally, islets were purified by Euro-Ficoll density gradient centrifugation. The islet cells were fixed in 4% paraformaldehyde, permeabilized in permeabilization buffer (0.02% Triton-100 in PBS), blocked in blocking solution (0.5% BSA in PBS), and then incubated with rabbit anti-Ki-67 (1:100) (D3B5, Cell Signalling Technology, #12,202) antibody. Fluorescein isothiocynate (FITC)-conjugated goat anti-rabbit IgG (1:200; VICMED) was used as the secondary antibody. Fluorescence was imaged using an LSM 700 laser scanning confocal fluorescent microscope (Carl Zeiss, Jena, Germany).
Tissue preparation and western blot
Western blot was performed as described previously [Citation15]. The frozen pancreatic tissues were cut into pieces and homogenized in ice-cold cellular lysis buffer (150 mM NaCl, 10 mM Tris–HCl, 5 mM EDTA, 1 mM EGTA, and 10% Triton X-100) containing a protease inhibitor cocktail. The homogenates were sonicated for 5 min. The tissue lysates were centrifuged for 10 min at 13,200 rpm at 4°C. The tissue protein concentrations were measured using the Bradford protein assay. Equal amounts of total protein from the tissue lysates were loaded and resolved by 10% sodium dodecyl sulphate-polyacrylamide gel electrophoresis (SDS-PAGE). The proteins were transferred to nitrocellulose membranes (Millipore, Billerica, MA, USA). After blocking in 5% non-fat milk for 30 min at room temperature, the membranes were incubated with the indicated antibodies at 4°C overnight. The membranes were incubated with the appropriate horseradish peroxidase (HRP)-conjugated secondary antibody for 2 h at room temperature. HRP activity was visualized using ClarityTM Western ECL Substrate and a ChemiDoc™ MP Imaging System (Bio-Rad Laboratories, Hercules, CA, USA). Densitometric analysis was performed using Image LabTM software version 5.1 (Bio-Rad Laboratories).
Haematoxylin and eosin (H&E) and immunofluorescence staining
For H&E staining, the histological sections were deparaffinized and hydrated through a series of decreasing concentrations of ethanol (100–80%), then stained with H&E (Beyotime, Shanghai, China), and covered with synthetic resin. Samples were observed by light microscopy using an Eclipse E400 microscope (Nikon, Tokyo, Japan) as described previously [Citation16].
Islet inflammation was assessed by quantifying the number of macrophages and neutrophils within the islets using a PANO 3-plex IHC kit (YX Biotechnology, Shanghai, China). Different primary antibodies were sequentially applied, followed by HRP-conjugated secondary antibody and tyramide signal amplification (TSA). Nuclei were stained with 4ʹ-6ʹ-diamidino-2-phenylindole (DAPI; Sigma-Aldrich, St. Louis, MO, USA). Quantification of the positively stained cells was verified from 15 to 20 islets/group. The mean number from all fields of each pancreatic sample was calculated.
RNA extraction and quantitative RT-PCR (qPCR)
Total RNA was isolated from the islet tissue using TRIzol reagent according to the standard procedure (Invitrogen, Carlsbad, CA, USA), followed by real-time RT-PCR with One Step TB Green™ PrimeScript™ RT-PCR Kit II (TaKaRa Bio, Shiga, Japan). Primers designed with Primer Premier 5.0 were as follows (F denotes forward and R denotes reverse): interleukin-6 (IL-6)-F, 5ʹ-CCGGAGAGGAGACTTCACAG-3ʹ; IL-6-R, 5ʹ-TCCACGATTTCCCAGAGAAC-3ʹ; β-actin-F, 5′-GCTACAGCTTCACCACCACA-3; and β-actin-R, 5′-TCTCCAGGGAGGAAGAGGAT-3ʹ. Results were normalized to β-actin mRNA.
Statistical analyses
Data were analysed using SPSS software (version 16.0; SPSS Inc., Cary, NC, USA). Comparisons of two groups are presented as mean ± SEM. The 2-tailed paired t-test was used for data that were simultaneously normally distributed and homogenously variant. The Mann-Whitney test was used for data that were not. A pairwise comparison between groups was conducted by one-way ANOVA with appropriate Bonferroni’s multiple comparison test. A P-value < 0.05 was considered statistically significant.
Results
Establishment of mouse model of T2DM by combined administration of STZ and HFD
Seven days after the injection of STZ, the fasting blood glucose of mice in the STZ+HFD group was significantly higher than that in the normal, STZ alone, and HFD groups (), P < 0.01). Conversely, without obvious changes in body weight in STZ+HFD mice, the body weight of the HFD group was increased compared with that of the normal group and STZ alone group ()). During the experiment, loss of hair lustre, polydipsia, polyuria, and polyphagia were also observed in the diabetic mice (data not shown).
Figure 1. High expression of Aurora-A in the diabetic mouse model established with STZ and HFD
Oral glucose tolerance was assessed using the OGTT. An increase in the area under curve (AUC) was observed in the STZ+HFD group compared to the normal, STZ alone, and HFD groups. However, no obvious difference was found between the normal, STZ, and HFD groups (), right panel). In the ITT, the STZ+HFD group displayed decreased in FPG during the first 60 min after the injection of insulin ()). Then, the FPG concentration was maintained at 5 to 7 mM. However, the levels of FPG were maintained at almost the original levels prior to the administration of insulin in the normal, STZ alone, and HFD groups (), left panel). In addition, the AUC was significantly increased in the STZ+HFD group compared with the other three groups (), right panel). Serum TC was significantly increased in the diabetic mice, although the levels of TG were identical in mice treated with STZ+HFD compared with mice treated solely with STZ or the HFD (). The findings indicated that the diabetic mice suffered from hypercholesterolemia.
Overexpression of Aurora-A in pancreas of diabetic mice
High levels of Aurora-A expression have been observed in diabetic patients [Citation17]. We examined the expression of Aurora-A in the aforementioned diabetic mouse model. Similar with prior data, the levels of Aurora-A were significantly increased in the pancreas of the STZ+HFD group compared with those of the normal, STZ, and HFD groups ()).
Aurora-A inhibition does not affect body weight or blood glucose in diabetic mice
To elucidate the role of Aurora-A in diabetic mice, STZ+HFD mice were also treated with alisertib (20 mg/kg) or the same volume of saline (control group) for 2 weeks. FPG and body weight were monitored. FPG levels in the alisertib-treated diabetic mice were identical to those in control mice ()). Body weight was not affected by alisertib compared with the control group ()).
Figure 2. Suppression of Aurora-A improves insulin resistance (IR) in STZ+HFD mice
Suppression of Aurora-A improves IR in diabetic mice
To further assess whether Aurora-A was involved in regulating IR by improving glucose tolerance and insulin tolerance in STZ+HFD mice, OGTT and ITT were performed after the 2-week alisertib treatment. In the OGTT, decreased AUC was observed in mice treated with alisertib after glucose administration ()). Alisertib also significantly decreased blood glucose levels after insulin injection compared with that of the control group, as evident by the decreased AUC ()). Serum insulin in these STZ+HFD mice with and without alisertib treatment revealed markedly high levels of insulin in the control group, with a profound reduction upon alisertib treatment ()). The STZ+HFD mice showed a significant increase in the HOMA-IR index compared to the normal group. When these mice were treated with alisertib, the HOMA-IR index was significantly reduced ()).
Defects in the AKT/PKB pathway are associated with IR [Citation18,Citation19]. We investigated the levels of activated AKT. Alisertib treatment blocked Aurora-A activity. However, the levels of p-AKT were not increased in liver tissues compared to that in control mice ()). Similarly, the levels of p-AKT were not affected in adipocyte tissues or skeletal muscle ()).
Blockade of Aurora-A may not affect β-cell proliferation in diabetic mice
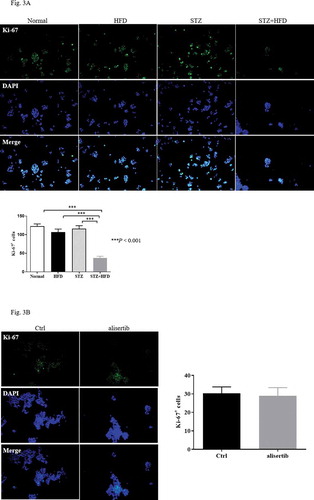
A previous study indicated that Aurora-A plays an important role in mediating β-cell proliferation [Citation10]. We used Ki-67 staining to investigate the proliferation of pancreatic islet cells in diabetic mice. The number of Ki-67 positive islet cells in the STZ+HFD group was significantly decreased compared with that in the normal, STZ, and HFD groups ()). Unexpectedly, alisertib treatment did not result in a change in the number of Ki-67+ islet cells in STZ+HFD mice compared with saline-treated SZT+HFD mice ()). The finding indicated that the aberrant expression of Aurora-A might be important in controlling insulin sensitivity rather than mediating the proliferation of islet cells.
Figure 3. Blockade of Aurora-A does not affect proliferation of β-cells in diabetic mice
Inhibition of Aurora-A suppresses macrophage infiltration
Multiple studies have indicated that the levels of IL-6 are associated with hyperglycaemia and IR [Citation17,Citation20–23]. Therefore, to determine the mechanisms by which Aurora-A mediated insulin sensitivity, we examined levels IL-6 in serum and the expression of IL-6 in pancreatic tissue. As shown in ), the serum level of IL-6 in STZ+HFD mice was significantly higher than that in normal mice, whereas, in the presence of alisertib, the serum level of IL-6 in these mice was significantly lower. Consistent with the above results, the qPCR results showed that IL-6 mRNA levels were significantly higher in the STZ+HFD mice than in the normal mice ()).
Figure 4. Alisertib inhibits macrophages infiltration and downregulates the levels of IL-6
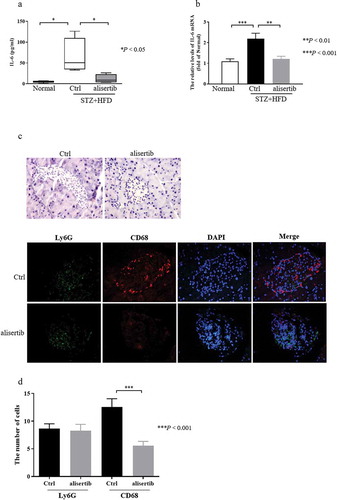
However, the expression of IL-6 mRNA in STZ+HFD mice was obviously decreased following alisertib treatment ()). IL-6 is predominantly produced by macrophages [Citation24]. Additionally, macrophage infiltration is critical in mediating pancreatic islet inflammation during the progression of T2DM [Citation25]. Based on this information, we quantified the number of macrophages and neutrophils within islets to assess the inflammatory status of islets. The number of infiltrating macrophages (CD68+ cells), but not neutrophils (Ly6G+ cells), were dramatically reduced in pancreatic tissues from alisertib-treated mice compared with the numbers in control mice (). 277
Discussion
T2DM is a slowly progressive disease. An important cause of its occurrence and development is the decompensation of IR [Citation26]. Improving IR is recognized as a potentially important treatment of T2DM. Aurora-A protein expression is elevated in diabetic skin tissue [Citation12]. This discovery has prompted extensive research on the physiological significance of Aurora-A. Most of the studies have focussed on its relationship with cancer. Presently, the expression of Aurora-A was higher in the pancreatic tissue of the diabetic mice (). A previous study demonstrated the involvement of Aurora-A in controlling the proliferation of β cell [Citation10]. However, we observed that blocking Aurora-A activity using alisertib did not change the proliferation of islet cells ()). We cannot rule out the possibility that our experiment missed the time point for islet β cell
proliferation after administration of STZ. Interestingly, we observed that the AUC of ITT and HOMA-IR index was significantly decreased in alisertib-treated STZ+HFD mice compared with the values in saline-treated STZ+HFD mice. Furthermore, the levels of serum insulin in STZ+HFD mice were significantly lower when they also were treated with alisertib compared to mice treated with saline. The findings indicated that the inhibition of Aurora-A might be involved in attenuating IR. The common ectopic fat deposits in obese patients are liver and skeletal muscle [Citation27]. These sites are also common sites of IR [Citation28]. Unfortunately, alisertib did not contribute to an increase in the levels of p-AKT in the liver and skeletal muscle ()).These observations indicate that alisertib ameliorated IR by other mechanisms than AKT activation. We also found that the inhibition of Aurora-A did not affect the levels of FPG and the body weight of the diabetic mice. The data indicate the indirect involvement of Aurora-A in the inhibition of diabetes.
IR is a common metabolic state that may cause atherogenic dyslipidemia, obesity and T2DM. IR is also important in the pathogenesis of T2DM [Citation29,Citation30]. Activated inflammatory signals directly affect IR and trigger systemic IR [Citation31,Citation32]. IL-6, IL-1β, and tumour necrosis factor-alpha are proinflammatory cytokines with cytotoxic, cytostatic (inhibition of insulin synthesis and secretion), or cytocidal activities on pancreatic islets. These activities can promote the development of IR [Citation33,Citation34]. An investigation of T2DM has revealed the important role of IL-6 [Citation35]. Circulating IL-6 levels are increased in insulin-resistant states, such as impaired glucose tolerance [Citation36] and T2DM [Citation37,Citation38]. The circulating IL-6 levels correlate with the risk of developing T2DM. It was recently shown that IL-6 can induce IR and that IL-6 gene expression is markedly upregulated in the affected individuals [Citation35]. Presently, the serum and pancreatic tissue levels of IL-6 were increased in STZ+HFD mice. IL-6 was significantly decreased after the administration of alisertib ()). We speculate that the inhibition of Aurora-A could reduce IR by inhibiting the release of IL-6. IL-6 is predominantly produced by macrophages [Citation24]. Of note, infiltrating macrophages can lead to pancreatic islet inflammation during the progression of T2DM [Citation25]. We assessed the ability of alisertib to decrease macrophage infiltration. As expected, the treatment decreased the number of infiltrating macrophages in pancreatic tissues compared with that in control mice ().
In conclusion, the inhibition of Aurora-A improved IR in mice following the induction of diabetes by STZ+HFD. The mice displayed fewer infiltrating macrophages and IL-6 was at least partially downregulated.
Author contributions
F.D.M and Q.W.S performed the experiments and contributed equally to the preparation of the manuscript. D.M.Z analysed the data. Q.L performed the immunohistochemistry analysis. H. J. performed real-time RT-PCR analysis. D.S.L analysed the data. J.Y contributed to the conception and design of the study, performed the experiments, and analysed and interpreted the data.
Disclosure statement
The authors have no conflicts of interest to declare.
Additional information
Funding
References
- Blonde L. Epidemiology, costs, consequences, and pathophysiology of type 2 diabetes: an american epidemic. Ochsner J. 2001;3(3):126–131.
- Marathe PH, Gao HX, Close KL. American diabetes association standards of medical care in diabetes 2017. J Diabetes. 2017;9(4):320–344.
- Ndisang JF, Vannacci A, Rastogi S. Insulin resistance, type 1 and type 2 diabetes, and related complications 2017. J Diabetes Res. 2017;2017:p. 1478294.
- Pedersen BK. IL-6 signalling in exercise and disease. Biochem Soc Trans. 2007;35(5):p. 1295–1297.
- Shah A, Mehta N, Reilly MP. Adipose inflammation, insulin resistance, and cardiovascular disease. JPEN J Parenter Enteral Nutr. 2008;32(6):638–644.
- Kim B, Feldman EL. Insulin resistance in the nervous system. Trends Endocrinol Metab. 2012;23(3):133–141.
- Marumoto T, Zhang D, Saya H. Aurora-A - a guardian of poles. Nat Rev Cancer. 2005;5(1):42–50.
- Tang A, Gao K, Chu L, et al. Aurora kinases: novel therapy targets in cancers. Oncotarget. 2017;8(14):23937–23954.
- Wang J, Nikhil K, Viccaro K, et al. Phosphorylation-dependent regulation of ALDH1A1 by Aurora kinase A: insights on their synergistic relationship in pancreatic cancer. BMC Biol. 2017;15(1):10.
- Hobson A, Draney C, Stratford A, et al. Aurora Kinase A is critical for the Nkx6.1 mediated beta-cell proliferation pathway. Islets. 2015;7(1):e1027854.
- Yao JE, Yan M, Guan Z, et al. Aurora-A down-regulates IkappaBalpha via Akt activation and interacts with insulin-like growth factor-1 induced phosphatidylinositol 3-kinase pathway for cancer cell survival. Mol Cancer. 2009;8(1):95.
- Cho MK, An JM, Kim CH, et al. Elevated aurora kinase a protein expression in diabetic skin tissue. Arch Plast Surg. 2014;41(1):35–39.
- Deng X, Sun L, Lai X, et al. Tea polypeptide ameliorates diabetic nephropathy through RAGE and NF-κB signaling pathway in type 2 diabetes mice. J Agric Food Chem. 2018;66(45):11957–11967.
- Zhu L, Almaça J, Dadi PK, et al. beta-arrestin-2 is an essential regulator of pancreatic beta-cell function under physiological and pathophysiological conditions. Nat Commun. 2017;8(1):14295.
- Zhang B, Gu X, Han X, et al. Crosstalk between DNA methylation and histone acetylation triggers GDNF high transcription in glioblastoma cells. Clin Epigenetics. 2020;12(1):47.
- Lu J, Wang H, Zhang R, et al. Effects of photoperiod on acetaminophen-induced hepatotoxicity in mice. Dig Dis Sci. 2020;65(1):383 178–188.
- Bastard JP, Maachi M, Van Nhieu JT, et al. Adipose tissue IL-6 content correlates with resistance to insulin activation of glucose uptake both in vivo and in vitro. J Clin Endocrinol Metab. 2009;87(5):2084–2089.
- Tonks KT, Ng Y, Miller S, et al. Impaired Akt phosphorylation in insulin-resistant human muscle is accompanied by selective and heterogeneous downstream defects. Diabetologia. 2013;56(4):875–885.
- Brady MJ, Saltiel AR. Closing in on the cause of insulin resistance and type 2 diabetes. J Clin Invest. 1999;104(6):675–676.
- Sandler S, Bendtzen K, Eizirik DL, et al. Interleukin-6 affects insulin secretion and glucose metabolism of rat pancreatic islets in vitro. Endocrinology. 1990;126(2):1288–1294.
- Kanemaki T, Kitade H, Kaibori M, et al. Interleukin 1beta and interleukin 6, but not tumor necrosis factor alpha, inhibit insulin-stimulated glycogen synthesis in rat hepatocytes. Hepatology. 1998;27(5):1296–1303.
- Tsigos C, Papanicolaou DA, Kyrou I, et al. Dose-dependent effects of recombinant human interleukin-6 on glucose regulation. J Clin Endocrinol Metab. 1997;82(12):4167–4170.
- Festa A, D’Agostino R Jr, Howard G, et al. Chronic subclinical inflammation as part of the insulin resistance syndrome. Circulation. 2000;102(1):42–47.
- Schuett H, Oestreich R, Waetzig GH, et al. Transsignaling of interleukin-6 crucially contributes to atherosclerosis in mice. Arterioscler Thromb Vasc Biol. 2012;32(2):281–290.
- Ying W, Fu W, Lee YS, et al. The role of macrophages in obesity-associated islet inflammation and beta-cell abnormalities. Nat Rev Endocrinol. 2020;16(2):81–90.
- Lisa SM, Wickbom M, Wang F, et al. Early impairment of insulin secretion in rats after surgical trauma. Eur J Endocrinol. 2002;147(6):825–833.
- Larsonmeyer DE, Newcomer BR, Ravussin E, et al. Intrahepatic and intramyocellular lipids are determinants of insulin resistance in prepubertal children. Diabetologia. 2011;54(4):869–875.
- Savage DB, Petersen KF, Shulman GI. Disordered lipid metabolism and the pathogenesis of insulin resistance. Physiol Rev. 2007;87(2):507–520.
- Noakes TD. So what comes first: the obesity or the insulin resistance? And which is more important? Clin Chem. 2018;64(1):7–9.
- Altaf QA, Barnett AH, Tahrani AA. Novel therapeutics for type 2 diabetes: insulin resistance. Diabetes Obes Metab. 2015;17(4):319–334.
- Osborn O, Olefsky JM. The cellular and signaling networks linking the immune system and metabolism in disease. Nat Med. 2012;18(3):425 363–374.
- Arkan MC, Hevener AL, Greten FR, et al. IKK-beta links inflammation to obesity-induced insulin resistance. Nat Med. 2005;11(2):428 191–198.
- Erbağci AB, Tarakçioğlu M, Coşkun Y, et al. Mediators of inflammation in children with type I diabetes mellitus: cytokines in type I diabetic children. Clin Biochem. 2001;34(8):645–650.
- Lackey DE, Olefsky JM. Regulation of metabolism by the innate immune system. Nat Rev Endocrinol. 2016;12(1):15–28.
- Rotter V, Nagaev I, Smith U. Interleukin-6 (IL-6) induces insulin resistance in 3T3-L1 adipocytes and is, like IL-8 and tumor necrosis factor-alpha, overexpressed in human fat cells from insulin-resistant subjects. J Biol Chem. 2003;278(46):45777–45784.
- Müller S, Martin S, Koenig W, et al. Impaired glucose tolerance is associated with increased serum concentrations of interleukin 6 and co-regulated acute-phase proteins but not TNF-alpha or its receptors. Diabetologia. 2002;45(6):805–812.
- Carey AL, Febbraio MA. Interleukin-6 and insulin sensitivity: friend or foe? Diabetologia. 2004;47(7):1135–1142.
- Pickup JC, Mattock MB, Chusney GD, et al. NIDDM as a disease of the innate immune system: association of acute-phase reactants and interleukin-6 with metabolic syndrome X. Diabetologia. 1997;40(11):1286–1292.