
ABSTRACT
Culturing cells on bio-gels are believed to provide a more in vivo-like extracellular matrix. 3T3-L1 cells cultured on Matrigel® significantly alteregd their proliferation and differentiation as compared to growth on tissue culture-coated polystyrene surfaces. Growth on a 250-μm thick layer of Matrigel® facilitated the formation of cellular aggregates of 3T3-L1 cells. Differentiation of 3T3-L1 cells cultured on Matrigel® demonstrated increased levels of mRNA levels for key adipogenic transcription factors (PPARγ, C/EBPα, SREBP1), lipogenic markers (FAS, FABP4, LPL, PLIN1) and markers of adipocyte maturity (LEP), compared to cells cultured directly on a polystyrene tissue culture surface. The gene expression of extracellular matrix proteins (FN1, COL1A1, COL4A1, COL6, LAM) was decreased in 3T3-L1 cells cultured on Matrigel®. Furthermore, growth on Matrigel® increased lipid accumulation in 3T3-L1 cells in the presence and absence of rosiglitazone, a thiazolidinedione routinely used to optimize differentiation in these cells. These changes in adipocyte gene expression and lipid accumulation patterns may be a result of the increased cell–cell and cell–ECM interactions occurring on the Matrigel®, a scenario that is more reflective of an in vivo model. Taken together, our data advance the understanding of the value of culturing 3T3-L1 cells on Matrigel®.
INTRODUCTION
The white adipose tissue (WAT) is responsible for regulating energy and glucose homoeostasis, insulin sensitivity, satiety, blood pressure and immunity[Citation1], and its dysfunction is associated with metabolic abnormalities, type 2 diabetes and cardiovascular disease [Citation2,Citation3]. The WAT is composed of lipid-filled adipocytes [Citation4], originating from mesenchymal progenitors that form adipocyte precursors, which differentiate into mature adipose cells [Citation5]. Adipocyte differentiation is characterized by changes in gene expression of specific markers that determine the mature adipocyte phenotype [Citation6]. During adipocyte differentiation, a tightly regulated sequential activation of transcription factors, including peroxisome proliferator-activated receptor γ (PPARγ) [Citation7–9] and CCAAT/enhancer-binding protein alpha (C/EBPα) [Citation10] potentiate differentiation of preadipocytes into the mature adipocytes [Citation11–13]. Sterol regulatory element-binding protein-1 (SREBP1) is another key transcription factor associated with adipocyte development, induced early during adipocyte differentiation, and is known to regulate lipid homoeostasis by controlling the expression of enzymes required for fatty acid and triglyceride synthesis [Citation14]. Mature 3T3-L1 adipocytes express mRNA and protein markers, including fatty acid binding protein 4 (FABP4) [Citation15,Citation16] and lipoprotein lipase (LPL) [Citation17], leptin (LEP) [Citation18], and accumulate lipids in the form of triglycerides (TGs) [Citation19,Citation20]. Furthermore adipocytes are also surrounded by a basement membrane (BM) [Citation21], which is a specialized extracellular matrix (ECM), primarily composed of collagen IV, laminin and entactin [Citation22]. The adipocyte BM undergoes constant remodelling throughout differentiation in order to ensure cell integrity and to allow for adipocyte expansion associated with lipid accumulation [Citation23].
Mechanisms underlying adipocyte biology are commonly investigated, in vitro, using well-characterized cell lines, such as 3T3-L1 and 3T3-F442A cells [Citation24]. Optimally, cell culture models of adipocytes should resemble the WAT as closely as possible. However, most in vitro studies are conducted with cells cultured directly on flat, polystyrene tissue culture plates, in the absence of an appropriate ECM [Citation25]. While the simplicity and low-cost associated with this method is attractive, cells cultured on a flat, non-physiologically stiff surface may result in a flattened morphology and exhibit reduced cell–cell and cell–ECM interactions [Citation26]. Changes in cellular morphology can affect cell differentiation, function and response to pharmaceutical reagents [Citation27]. Furthermore, it is speculated that expression of ECM proteins may be significantly higher in vitro, relative to in vivo, possibly as a result of cellular attempts to compensate for the lack of a physiologically representative ECM [Citation21]. The commonly used and well-characterized cell line, 3T3-L1, differentiates from fibroblasts to adipocytes under the influence of steroids and hormones on traditional polystyrene tissue culture plates [Citation28].
The importance of an ECM in facilitating a more in vivo-like biological responses has been gradually emerging in the literature [Citation29–31]. Hydrogels make excellent candidates for cell culture substrates because of their high water content, greater flexibility and much lower stiffness compared to polystyrene [Citation32]. A thick layer of hydrogel can allow adipose cells to attain a more rounded morphology, compared to uncoated polystyrene surfaces [Citation33]. Matrigel® is a biologically derived hydrogel, composed of proteins, such as laminin, collagen IV, heparin sulphate proteoglycans and entactin [Citation34], which are also found in the adipocyte BM [Citation35,Citation36]. Matrigel® has been previously shown to enhance the ability of preadipocytes to mature adipocytes, in vitro and in vivo [Citation37–40]. The stromal vascular fraction (SVF) isolated from human adipose tissue can be differentiated into adipocytes with ~60% efficiency when cultured on Matrigel®. However, when SVF is differentiated to adipocytes on polystyrene or collagen I only 13% to 28% differentiation efficiency is observed and this is further reduced on fibronectin (< 5%) [Citation37]. Furthermore, lipid accumulation in cells cultured on Matrigel® was 30% higher relative to adipocytes differentiated on the other substrates [Citation37]. In vivo, 3T3-F442A preadipocytes injected into mice, together with Matrigel®, displayed twofold increase in DNA content, triglyceride levels and glycerol-3-phosphate dehydrogenase (GPDH) activity, compared to cells injected alone [Citation38]. These studies provide evidence that growth of preadipocytes on Matrigel® impacts cellular differentiation to adipocytes.
Gene expression profiling has been extensively used to characterize differentiation of 3T3-L1 cells [Citation10,Citation41]. However, no studies have characterized the gene expression of transcription factors, adipogenic and lipogenic markers, and ECM proteins of 3T3-L1 cells cultured on Matrigel®. This study explored changes in lipid accumulation and gene expression of 3T3-L1 cells cultured and differentiated on a 250 μm layer of Matrigel®, and investigated differentiation efficiency in the absence of rosiglitazone. We hypothesized that differentiation of 3T3-L1 cells on Matrigel® would impact expression of genes related to cellular differentiation, lipid homoeostasis and ECM proteins. The 3T3-L1 cell line has the potential to differentiate from fibroblasts to adipocytes, which is the reason underlying its high usage in more than 5000 published articles [Citation42]. 3T3-L1 cells undergo growth arrest before being exposed to differentiation media, which allows the cells to upregulate genes that drive the adipogenic programme. Upregulation of adipogenic gene expression increases glucose uptake and triglyceride synthesis and cells display lipid accumulation starting 4 days after the initiation of differentiation [Citation43,Citation44]. Various studies have reported that 3T3-L1 cells differentiated using conventional protocols (i.e., differentiation with insulin, dexamethasone and 3-isobutyl-1-methylxanthine) display low differentiation efficiency and decline in differentiation with increase passage number [Citation28,Citation45]. In order to avoid low differentiation efficiency of 3T3-L1 cells, a thiazolidinedione is included in the differentiation mix, known as rosiglitazone [Citation28,Citation46,Citation47]. Although Rosiglitazone enhances 3T3-L1 differentiation and lipid accumulation [Citation28], it is a PPARγ agonist that may interfere with other drugs being tested in the system or alter important pathways in adipocyte differentiation. In this study, we demonstrated that 3T3-L1 cells sufficiently differentiate over two weeks on Matrigel® with insulin, dexamethasone and 3-isobutyl-1-methylxanthine (IBMX), in the absence of rosiglitazone. Furthermore, 3T3-L1 cells differentiated on Matrigel® displayed higher mRNA levels of the Leptin gene, with or without rosiglitazone, which is not often reported in studies conducted with cell lines. This demonstrates that our model is robust in producing high differentiation efficiency for 3T3-L1 cells and thus represents a reliable in-vivo-like model for in vitro adipogenesis research.
RESULTS
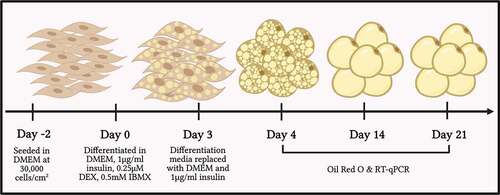
3T3-L1 cells were cultured on polystyrene tissue culture plates or on 250 μm layer of Matrigel®. All cells were initially seeded and proliferated for 48 hours without differentiation media. This time point was referred to as day 0. Undifferentiated 3T3-L1 cells were imaged and harvested for experiments at this time. Following this initial 48 hours, 3T3-L1 cells were supplemented with differentiation media for 3 days. At day 3, cells were supplemented with maintenance media and imaged and harvested at days 4, 14 and day 21. displays the timeline used for culturing and differentiating 3T3-L1 cells in this study.
Figure 1. Timeline of 3T3-L1 cell seeding and differentiation. 3T3-L1 cells were seeded at 30,000 cells/cm2 in Dulbecco’s Modification of Eagle’s Medium (DMEM) with 1 g/L glucose, supplemented with 10% foetal bovine serum (FBS), 1% Penicillin-Streptomycin, and 1% L-glutamine, at 37°C in a humidified CO2 incubator, placed in the incubator for 48 hours, to reach 100% confluence, and differentiated with DMEM 1X with 4.5 g/L glucose, supplemented with 10% FBS, 1% Penicillin-Streptomycin, 1% L-glutamine, 1 μg/ml insulin, 0.25 μM dexamethasone (DEX) and 0.5 mM isobutyl-methyl-xanthine (IBMX). 48 hours following initiation of differentiation, the media was replaced with DMEM with 4.5 g/L glucose, 10% FBS, 1% penicillin streptomycin, 1% L-glutamine and 1 µg/ml insulin, and the cells were re-supplemented with maintenance media every 48 hours until day 21. For experimental analysis, cells were either stained for ORO or harvested for gene expression analysis at day 4, day 14 and day 21 following differentiation. The figure was created using BioRender.com
Matrigel® facilitates clustering of 3T3-L1 cells and significantly decreases proliferation
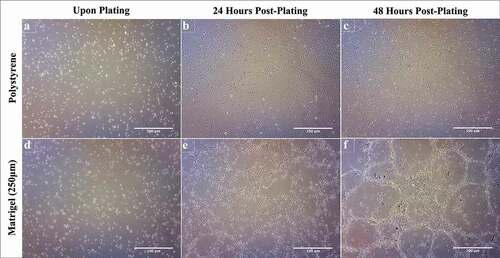
represents 3T3-L1 cells seeded at a density of 30,000 cells/cm2 on polystyrene and Matrigel®. 3T3-L1 cells seeded on conventional polystyrene tissue culture plates displayed growth in a monolayer over 48 hours (, panel A, B, C) [Citation48,Citation49]. However, cells grown on Matrigel® formed distinct cluster-like patterns (, panel D, E, F). The clustering of 3T3-L1 cells on Matrigel® is apparent 24 hours post plating and is very prominent in cells cultured on Matrigel® at 48 hours post plating (, panel D, E, F).
Figure 2. Matrigel® induces 3T3-L1 cell aggregation in a thickness-dependent manner. Phase-contrast images of 3T3-L1 cells seeded at a density of 30,000 cells/cm2 on polystyrene (A, B, C) and on Matrigel® (D, E, F). Images were taken of the 3T3-L1 cells upon plating, 24 hours post-plating, and 48 hours post-plating. Each image was taken at 20x magnification and is representative of three biological replicates (n = 3)
Matrigel® enhances lipid accumulation in 3T3-L1 cells
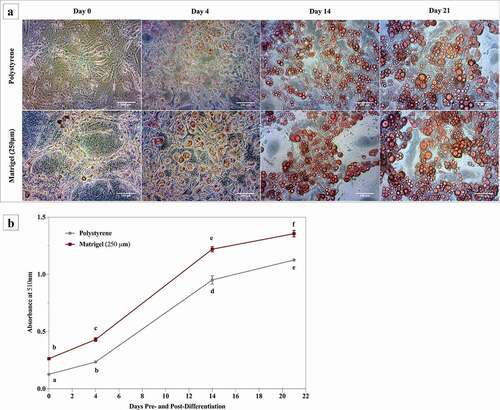
Lipid accumulation in 3T3-L1 cells grown on Matrigel® and polystyrene was assessed by conducting an ORO assay (). Regardless of surface, all cells demonstrated a significant increase in lipid accumulation over 21 days of differentiation (). 3T3-L1 cells differentiated on polystyrene demonstrated a significant increase in lipid accumulation following differentiation at day 4, day 14 and day 21, relative to day 0. Furthermore, lipid levels at all time points (day 0, 4, 14 and 21) are significantly different from each other. This pattern is consistent in 3T3-L1 cells differentiated on Matrigel®. At day 0, 3T3-L1 preadipocytes cultured on Matrigel® demonstrate significantly increased lipid levels (108%), relative to cells on polystyrene. Following differentiation, 3T3-L1 cells on Matrigel® display increased lipid accumulation compared to cells on polystyrene at day 4 (83%), day 14 (28%) and day 21 (20%) ().
Figure 3. Matrigel® significantly enhances lipid accumulation in 3T3-L1 cells differentiated on Matrigel®, visualized by Oil Red O staining. 3T3-L1 cells were cultured and differentiated on Matrigel® and polystyrene. A) Phase-contrast images of Oil Red O stained 3T3-L1 cells on polystyrene and Matrigel®. Undifferentiated 3T3-L1 cells were imaged at day 0, and differentiated cells were imaged at days 4, 14 and 21. Each image was taken at 20x magnification and is representative of three biological replicates. B) At day 0, 4, 14 and 21 Oil Red O stained 3T3-L1 cells were analysed for lipid quantification spectrophotometrically. Results from three biological replicates are represented as mean ± SEM and compared using two-way ANOVA. Statistical differences are represented by distinct letters on the line graphs
Matrigel® enhances mRNA levels of adipogenic markers in differentiated 3T3-L1 cells
3T3-L1 cells cultured on Matrigel® and polystyrene were differentiated and maintained for 14 days. Cells were harvested at days 0, 4 and 14 for RT-qPCR analysis. Regardless of surface, 3T3-L1 cells demonstrated increased mRNA levels of PPARγ, C/EBPα, LPL, PLIN1, FABP4 and LEP over the 14 days of differentiation (). PPARγ and C/EBPα are key transcription factors in adipogenesis, and both are activators of genes that are expressed by mature adipocytes including FABP4 and LEP [Citation50,Citation51]. Growth on Matrigel® resulted in enhanced mRNA levels of PPARγ (73%) and C/EBPα (91%) in 3T3-L1 cells at day 14, compared to cells cultured on polystyrene (). There was no change in mRNA levels of PPARγ and C/EBPα in 3T3-L1 cells on Matrigel® at day 0 or day 4, relative to cells on polystyrene at day 0 or day 4, respectively (). 3T3-L1 cells differentiated on Matrigel® demonstrated significantly higher mRNA levels of SREBP1, which is another key transcription factor involved in adipocyte differentiation, at day 4 (191%) and day 14 (301%), relative to cells on polystyrene (). There was no change in SREBP1 gene expression at day 0 between the two conditions. Fatty acid synthase (FAS) and lipoprotein lipase (LPL) are both key targets of SREBP1 and are involved in fatty acid metabolism [Citation52]. Matrigel® enhanced gene expression of FAS and LPL in 3T1-L1 cells at day 14 by 2800% and 181%, respectively, relative to polystyrene (). Between the two conditions, there was no difference in mRNA levels of FAS at day 0 or day 4 ().
Figure 4. Growth on Matrigel® enhances the expression of transcription factors and markers involved in lipogenesis and adipocyte maturity in 3T3-L1 cells. 3T3-L1 cells were cultured and differentiated on Matrigel® and polystyrene. Three biological replicates, separated by passage and time, were harvested at day 0, day 4 and day 14 for RT-qPCR. Results are referenced to RPL37a and RPL32 and expressed as mean ± SEM. Results were compared using two-way ANOVA and statistical differences are represented by change in letters on the line graphs
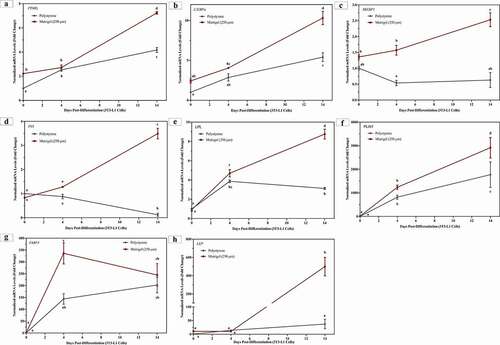
Mature adipocytes express late markers of adipogenesis, such as perilipin-1 (PLIN-1) [Citation53,Citation54]. 3T3-L1 cells grown on Matrigel® displayed increased gene expression of PLIN1 (64%) at day 14, compared to cells on polystyrene (). FABP4 is an early marker of adipocyte differentiation [Citation16]. In 3T3-L1 cells differentiated on polystyrene, the mRNA levels of FABP4 significantly increased upon differentiation (day 4 and day 14), compared to undifferentiated cells (day 0) (). 3T3-L1 cells on Matrigel® displayed increased gene expression of FABP4 at day 4 and day 14, compared to day 0. At day 4, Matrigel® significantly increased the gene expression of FABP4 in 3T3-L1 cells (133%), compared to polystyrene. There was no change in mRNA levels of FABP4 between the cells on the two conditions at day 0 or day 14 (). Terminally differentiated 3T3-L1 cells synthesize and secrete markers of mature adipocytes, such as leptin (LEP) [Citation18]. 3T3-L1 cells differentiated on Matrigel® demonstrated significant increase in gene expression of LEP (1240%) 14 days following differentiation, compared to cells on polystyrene ().
Matrigel® downregulates mRNA levels of extracellular matrix proteins in 3T3-L1 cells
During adipogenesis, differentiating adipocytes express, synthesize and secrete ECM proteins in order to develop their basement matrix [Citation6,Citation22,Citation55]. This involves increase or decrease in mRNA levels of various ECM proteins including, but not limited to, fibronectin (FN1), collagen I (COL1A1), collagen IV (COL4A1), collagen 6 (COL6) and laminin (LAM) [Citation36]. represents 3T3-L1 cells differentiated on Matrigel® and polystyrene, and assessed for changes in mRNA levels of FN1, COL1A1, COL4A1, COL6 and LAM at day 0, day 4 and day 14. Regardless of surface, the mRNA levels of FN1 and COL1A1 decreased significantly after 4 days of differentiation (relative to day 0), and then mRNA levels increased at day 14 to levels similar as those observed in cells at day 0 (). 3T3-L1 cells cultured and differentiated on Matrigel® decreased mRNA levels of FN1 (65% at day 0 and 77% at day 14)) and COL1A1 (67% at day 0 and 75% at day 14), relative to cells on polystyrene at day 0 and day 14, respectively ().
Figure 5. 3T3-L1 cells on Matrigel® demonstrate significant downregulation of ECM markers. 3T3-L1 cells were cultured and differentiated on Matrigel® and polystyrene. Three biological replicates, separated by passage and time, were harvested at day 0, day 4 and day 14 for RT-qPCR. Results are referenced to RPL37a and RPL32 and expressed as mean ± SEM. Results were compared using two-way ANOVA and statistical differences are represented by change in letters on the line graphs
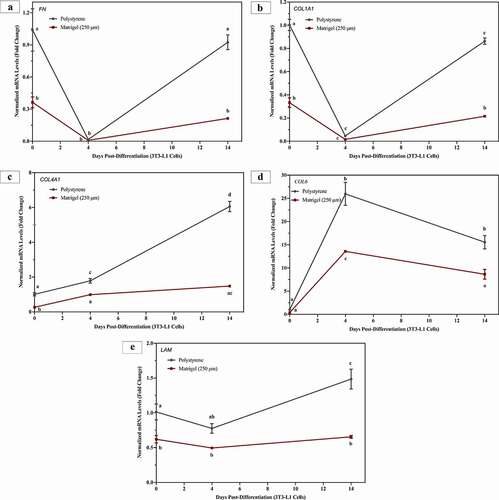
In 3T3-L1 cells cultured on polystyrene, mRNA levels of COL4A1, COL6 and LAM significantly increased after 14 days of differentiation, relative to undifferentiated cells (day 0) on polystyrene (). However, in 3T3-L1 cells grown on Matrigel®, mRNA levels of COL4A1 and LAM do not increase post differentiation, relative to undifferentiated cells on Matrigel® (). COL6 mRNA levels in 3T3-L1 cells on Matrigel® increase at day 4, relative to day 0, and then decrease at day 14 to similar levels as day 0 (). 3T3-L1 cells on Matrigel® demonstrate significantly lower mRNA levels of COL4A1, relative to cells on polystyrene, at day 0 (73%), day 4 (45%) and day 14 (76%) (). Matrigel® decreased mRNA levels of COL6 in 3T3-L1 cell at day 4 (48%) and day 14 (44%), relative to cells on polystyrene (). Compared to 3T3-L1 cells on polystyrene, cells grown on Matrigel® expressed lower mRNA levels of LAM at day 0 (39%) and day 14 (56%) ().
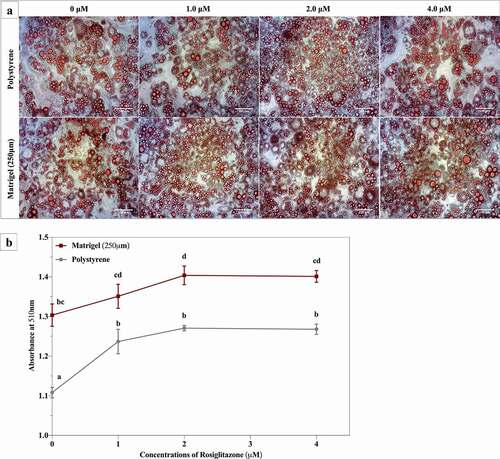
Matrigel® enhanced rosiglitazone-mediated lipid accumulation in 3T3-L1 cells
We evaluated the concentration dependence of rosiglitazone, added only during the differentiation period, on lipid accumulation over 14 days following the initiation of differentiation. represents lipid accumulation assessed in 3T3-L1 cells cultured on polystyrene and on Matrigel® at day 14 post-differentiation. At day 14, all cells were imaged and harvested for an Oil Red O assay (). 3T3-L1 cells cultured on polystyrene displayed an increase in lipid accumulation of ~18% upon treatment with 1 μM of rosiglitazone, relative to untreated cells (0 μM rosiglitazone) (). There was no significant change in lipid accumulation with increasing concentrations of rosiglitazone (2 μM and 4 μM) in cells cultured on polystyrene, compared to cells treated with 1 μM of rosiglitazone on polystyrene (). 3T3-L1 cells cultured and differentiated on Matrigel® showed no significant change in lipid accumulation when treated with 1 μM or 4 μM rosiglitazone, compared to untreated cells (). However, when treated with 2 μM rosiglitazone, 3T3-L1 cells on Matrigel® demonstrated an increase in lipid accumulation relative to untreated cells. In general, growth Matrigel® resulted in significantly greater lipid accumulation over the 14 days in culture, relative to polystyrene. Interestingly, even in the absence of rosiglitazone, 3T3-L1 cells grown on Matrigel® demonstrated significantly higher levels of lipid accumulation (18% greater than cells cultured on polystyrene) and comparable to what was observed in the cells cultured on polystyrene following 14 days of maturation ().
Figure 6. Matrigel® enhances lipid accumulation in 3T3-L1 in the absence or presence of rosiglitazone compared to cells on polystyrene. 3T3-L1 cells were cultured and differentiated on Matrigel® and polystyrene with various concentrations of rosiglitazone. While cells were cultured for 14 days, only the differentiation media (the first 3 days) was supplemented with rosiglitazone. A) Phase-contrast images of Oil Red O stained 3T3-L1 cells cultured and differentiated on polystyrene and Matrigel® and treated with various concentrations of rosiglitazone at differentiation. Stained 3T3-L1 cells were imaged at 20x magnification using phase-contrast microscope. B) At day 14,three3 biological replicates of 3T3-L1 cells on polystyrene and Matrigel®, separated by passage and time, were harvested for Oil Red O analysis. Results are expressed as the mean quantity of absorbance (510 nm), ± SEM, and compared using two-way ANOVA. P ≤ .05 was considered significant and statistical changes between data points are indicated with distinct letters
3T3-L1 cells differentiated on Matrigel® in the presence of and/or absence of rosiglitazone displayed enhanced expression of key adipogenic markers
While treatment with rosiglitazone enhanced lipid accumulation over 14 days in cells cultured on polystyrene, the mRNA levels of PPARγ, FAS or ADIPOQ were not observed to be elevated 14 days following differentiation (). The 3T3-L1 cells differentiated on Matrigel® and treated with 1 μM and 2 μM rosiglitazone did not demonstrate any change in mRNA levels PPARγ or FAS relative to untreated cells on Matrigel® (). However, gene expression of ADIPOQ and LEP was significantly higher in 3T3-L1 cells treated with 1 μM and 2 μM rosiglitazone on Matrigel®, compared to untreated cells on Matrigel® ().
Figure 7. 3T3-L1 cells differentiated on Matrigel® and treated with rosiglitazone display enhanced expression of PPARγ, FAS, ADIPOQ, C/EBPα, FABP4 and LEP. 3T3-L1 cells were cultured and differentiated on Matrigel® and polystyrene, and treated with various concentration of rosiglitazone at differentiation. Three biological replicates, separated by passage and time, were harvested at day 14 for RT-qPCR. Results were referenced to RPL37a and L32, expressed as mean ± SEM, and compared using two-way ANOVA. Statistical differences are represented by distinct letters on data points
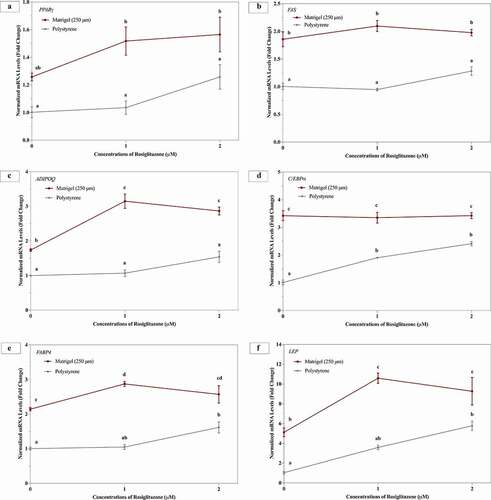
3T3-L1 cells differentiated on polystyrene with 1 μM and 2 μM of rosiglitazone displayed significantly increased mRNA levels of C/EBPα (). In contrast, cells on Matrigel® did not display any change in C/EBPα gene expression upon treatment with rosiglitazone. Treatment of 3T3-L1 cells, cultured on polystyrene, with 2 μM of rosiglitazone resulted in increased FABP4 and LEP gene expression (). However, 3T3-L1 cells on Matrigel® showed increased mRNA levels of FABP4 with 1 μM rosiglitazone treatment only. Cells on Matrigel® demonstrated increased LEP gene expression with 1 μM and 2 μM rosiglitazone treatment as compared to the untreated cells grown on Matrigel®. Between the two growth surfaces, similar to the trends observed with lipid accumulation, 3T3-L1 cells grown on Matrigel® demonstrated an overall increase in gene expression of C/EBPα, FAS, FABP4, LEP and ADIPOQ when subjected to 0 μM, 1 μM and 2 μM rosiglitazone, relative to cells cultured on polystyrene (). Growth on Matrigel® resulted in increased PPARγ gene expression in 3T3-L1 cells treated with 1 μM and 2 μM rosiglitazone only, relative to cells on polystyrene ().
DISCUSSION
Majority of in vitro studies aimed at understanding adipocyte differentiation utilize committed preadipocyte cell lines, such as the 3T3-L1 cells [Citation11,Citation19,Citation56]. These studies assess cellular behaviour and function by culturing cells in monolayers directly on polystyrene tissue culture plates. 3T3-L1 cells differentiated using conventional protocols (i.e., differentiation with insulin, dexamethasone and 3-isobutyl-1-methylxanthine) display low differentiation efficiency and display decline in differentiation with increased passage number [Citation28,Citation45]. Furthermore, providers of the 3T3-L1 cell line, such as the European Collection of Authenticated Cell Cultures (ECACC), have reported that differentiation of the 3T3-L1 cells may take 2–5 weeks and the proportion of the cells that differentiate can be limited [Citation57]. ECACC also declare that they are working on sourcing a new stock of the cell line for a higher rate of adipocyte differentiation [Citation57]. There is growing appreciation for novel cell culture models, such as three-dimensional (3D) models, that provide a more physiologically representative environment for experimentation [Citation25,Citation58]. 3T3-L1 cells cultured in a 3D agarose gel culture model undergo adipogenesis, as demonstrated by PPARγ induction without the inclusion of a hormonal cocktail (insulin, IBMX or DEX) to induce differentiation [Citation59]. The 3D environments, created by cells cultured on hydrogel matrices, allow cells to take advantage of spatial properties, which lead to changes in cell shape and morphology, and subsequently to modified cell signalling and gene expression profiles [Citation60].
Adipocytes, in vivo, expand in a 3D environment that allows for cell growth along all axis [Citation61], which is not observed in conventional cell culture [Citation62]. Furthermore, the stromal vascular fraction (SVF) of the WAT contributes towards development of the ECM, along with the adipocytes, and therefore the ECM produced by adipocytes alone in vitro may not be sufficient [Citation22]. Finally, the native stiffness of the WAT is found to be 2 kilopascal (kPa) [Citation63], compared to the stiffness of the polystyrene tissue culture plates that is in the gigapascal (GPa) range [Citation64]. Importantly, the stiffness of the ECM can impact the biology of the cells; a process that involves cells sensing mechanical stimuli in their extracellular environment and translating it into biochemical signals [Citation65]. Adipose-derived stem cells (ASCs) cultured on polyacrylamide gels, which mimic the native stiffness of WAT (2kPa), demonstrated upregulation of adipogenic markers in the absence of adipogenic differentiation factors [Citation63]. Taken together, this evidence demonstrates that the adipocyte ECM contributes to its ability to differentiate. Furthermore, the ECM provides spatial flexibility so that cells can adapt by taking on a rounded morphology which would allow for the accumulation of greater amounts of intracellular lipids.
In this study, Matrigel® was chosen as the substrate for 3T3-L1 cells since its composition resembles that of the BM of adipocytes in vivo [Citation34,Citation66]. Hydrogels are reported to have stiffness in the range of 1kPa to 50kPa, depending on the thickness of the layer of hydrogel on the tissue culture surface [Citation63,Citation67,Citation68]. The stiffness of an ECM, quantified using Young’s elastic modulus, E (Pa; newtons/m2) [Citation69], is inversely proportional to its thickness [Citation29]. Previously, our group has demonstrated significant changes in gene expression in BeWo cells (trophoblasts) cultured on 250 μm Matrigel® [Citation29]. Our research group demonstrated that BeWo cells (trophoblasts) respond to growth on Matrigel® of varying thickness (a thick [250 μm] and thin [50 μm] layer of Matrigel®) and stiffnesses. In this case, a fivefold difference in thickness corresponded to more than a twofold difference in matrix stiffness [Citation29]. ASCs demonstrated a response to increasing ECM stiffness by exhibiting a more spread out and flattened phenotype, losing their rounded morphology, and failing to upregulate adipogenic markers [Citation63]. Altogether these findings led to our decision of using the thicker (250 μm) layer of Matrigel® in this study.
3T3-L1 cells were cultured and differentiated directly on polystyrene tissue culture plates and on a 250 μm layer of Matrigel® coated on the tissue culture plates, and differentiated over 21 days. Growth on Matrigel® significantly enhanced lipid levels in 3T3-L1 preadipocytes prior to differentiation (day 0), as well as increased lipid levels in differentiated 3T3-L1 cells at day 4, day 14, and day 21 following differentiation, relative to cells cultured on a 2D-polystyrene surface (). Furthermore, we observed increased cell clustering on the Matrigel® surface (), possibly resulting from cells experiencing lower matrix, as compared to cells grown in polystyrene cell culture plates [Citation70]. Taken together, this model supports the shift to a cellular environment for adipocytes, which favours triglyceride storage. These associations paralleled what has been reported in 3T3F44A cells [Citation38]. However, Kawaguchi et al. (1999) did not characterize gene expression changes associated with lipid accumulation [Citation38]. Our study expands on these findings by providing 1) changes in lipid levels and gene expression of key adipogenic markers over 21 days in 3T3-L1 cells differentiated on polystyrene and Matrigel®; 2) changes in gene expression of ECM markers in 3T3-L1 cells differentiated on polystyrene and Matrigel®; and 3) changes in lipid levels and gene expression of adipogenic markers in 3T3-L1 cells treated with rosiglitazone at differentiation on polystyrene and Matrigel®.
Growth on Matrigel® resulted in a small but statistically significant increase in lipid accumulation in 3T3-L1 cells prior to initiation of the differentiation protocol (day 0) (). In part, this may be due to the increased clustering of cells resulting from the influences of growth factors that are inherent in commercial preparations of the Matrigel® [Citation71]. This results in regions of the culture where there are visible increases in lipid accumulation and adjacent areas where ORO staining is comparable to that seen in cells grown on polystyrene. It has been previously reported that 3T3 cells in 3D culture do spontaneously differentiate [Citation59]. However, when the heterogeneous regions of the culture are considered, prior to initiation of differentiation, it is clear the genes associated with lipid accumulation and markers of adipocyte differentiation are not significantly different between the cells grown on Matrigel® and polystyrene (). This is may result from signal averaging due to localized areas of differentiation. While our results support the ability of Matrigel® to enhance lipid accumulation, the addition of adipogenic differentiation factors, are still required to differentiate these cells in adipocytes.
Day 1 to day 14 of 3T3-L1 cell differentiation represent early-to-late stages of adipogenesis, accompanied by a range of gene expression changes [Citation10]. The ability of Matrigel® to enhance adipocyte differentiation [Citation38] is supported by our findings shown in , where expressed level of transcription factors (PPARγ, C/EBPα, SREBP1) important for adipogenesis is significantly elevated at day 14 of adipocyte differentiation, which is considered the point of terminal differentiation and maturation in 3T3-L1 adipocytes [Citation10]. Since gene expression levels of adipogenic markers level out from day 14 to day 21, gene expression experiments were conducted with samples collected at days 0, 4 and 14 only. PPARγ and C/EBPα are involved in growth arrest required for adipocyte differentiation. They act cooperatively to activate and regulate expression of adipocyte-specific genes, including FABP4 [Citation72,Citation73]. PPARγ is a master regulator of adipogenesis, and its gene expression is positively correlated with adipocyte differentiation and lipid accumulation [Citation7]. Turner et al. (2015) established an adipocyte spheroid model in which 3T3-L1 cells displayed significantly increased mRNA levels of PPARγ, relative to cells in monolayer culture [Citation62]. While in this study we did not observe the prototypical spheroid structure, we did observe increased cellular aggregation in the cells cultured on Matrigel®. In this study, after 14 days of differentiation, the cells grown on Matrigel® exhibit increased mRNA levels of PPARγ (), relative to cells grown on polystyrene. Changes in levels of differentiation markers, as a consequence of ECM, have also been observed by Gross-Steinmeyer et al., who demonstrated that primary hepatocytes overlaid with Matrigel® displayed enhanced expression of genes involved in hepatocyte differentiation [Citation74]. Studies that report other novel in vitro models of adipocyte cell culture have commonly utilized the increased degree of adipogenesis and lipolysis, evaluated through assessing lipid accumulation, as a phenotype which is more representative of in vivo mature adipocytes [Citation62,Citation75,Citation76]. We also demonstrate that changes in the gene transcription for the critical transcription factors as well as the genes thought to be representative of mature adipocytes are more robustly supported when 3T3-L1 cells are cultured on a Matrigel® surface.
The mRNA levels of SREBP1 were increased in cells grown on Matrigel®, relative to cells on polystyrene 14 days following differentiation. SREBP1 is reported to activate gene expression of FAS and LPL, two key genes involved in regulating fatty acid metabolism [Citation77]. Our results demonstrate that 14 days following differentiation cells grown on Matrigel® exhibited elevated mRNA levels of FAS and LPL, compared to 3T3-L1 cells differentiated on polystyrene (). The mRNA levels of LPL are considered as an early sign of adipocyte differentiation [Citation78]. Terminal differentiation of adipocytes is characterized by increased lipid accumulation and increase in mRNA and protein levels of enzymes involved in TG metabolism, including FAS [Citation79] and LPL [Citation51], as well as markers of adipocyte maturity such as PLIN1 [Citation53,Citation54].
Among the many genes regulated by PPARγ and C/EBPα, two are FABP4 [Citation80] and LEP [Citation81]. FABP4 is the predominant fatty acid-binding protein found in adipocytes and plays an important role in metabolism and transport of fatty acids intracellularly [Citation82]. In this study, a significant increase in the mRNA levels of FABP4 was found in 3T3-L1 cells differentiated on Matrigel®, compared to polystyrene (). The presence of FABP4 mRNA is also linked with early to intermediate adipocyte differentiation [Citation80,Citation82]. The elevated increase in FABP4 mRNA levels at day 4 may contribute to the more robust maturation of 3T3-L1 adipocytes on Matrigel®. Leptin is an adipocyte-derived hormone that functions as a signalling molecule in a feedback loop regulating adipose tissue mass [Citation83], and its expression is normally increased in mature adipocytes as compared to preadipocytes [Citation83]. In this study, Matrigel® increased the mRNA levels of LEP in 3T3-L1 cells by ~1200%, compared to cells on polystyrene 14 days following differentiation (). Genome-wide analysis of gene expression during adipocyte differentiation demonstrates that adipogenic markers, such as PPARγ and C/EBPα, are significantly elevated day 14 onwards [Citation10]. Furthermore, genes involved in fatty acid biosynthesis, storage and transport are reported to level out in their expression from day 14 to day 21 [Citation10]. Thus, day 14 represents an important timepoint for adipocyte maturity. The increased mRNA levels of transcription factors, markers of lipogenesis and adipocyte maturity, along with increased intracellular lipid levels suggest that 3T3-L1 cells grown on Matrigel® exhibit an enhanced differentiated state and increased maturity.
We also investigated whether culturing and differentiating 3T3-L1 cells on Matrigel® resulted in any differences in the gene expression of ECM proteins. During adipocyte differentiation, changes in cellular morphology, cytoskeletal components and mRNA/protein levels of ECM components lead to development of the mature adipocyte phenotype [Citation84]. Cells cultured in vitro are removed from highly complex tissues, surrounded by various molecules and ECM proteins, and are placed into polystyrene tissue culture plates [Citation85]. Naturally these cells begin to rebuild their in vivo environment by secreting their own ECM during differentiation [Citation66]. During adipocyte differentiation, gene and protein expression levels of fibronectin and collagen I decrease [Citation55,Citation84] while the levels of collagen IV, collagen VI and laminin increase [Citation86,Citation87]. Following 14 days of differentiation, 3T3-L1 cells grown on Matrigel® exhibited significantly decreased mRNA levels of FN1, COL1A1, COL4A1, COL6 and LAM, compared to cells cultured on polystyrene. Streuli and Bissel (1990) demonstrated that mammary epithelial cells expressed lower mRNA and protein levels of ECM markers (LAM, COL4A1 and FN1) when cultured on type 1 collagen gels, compared to cells cultured on tissue culture plates [Citation88]. Streuli and Bissel (1990) suggested that pre-existing ECM provides a negative feedback for their mammary epithelial cells resulting in decreased mRNA and protein expression of ECM components [Citation88]. Therefore, it can be speculated that decreased mRNA levels of ECM markers in 3T3-L1 cells on Matrigel® are a result of the pre-existing ECM, which provides negative feedback, especially at day 14, which is considered the peak differentiation point for 3T3-L1 cells. The decrease in mRNA levels of ECM proteins is accompanied by an increase in levels of lipogenic and adipogenic markers in 3T3-L1 cells differentiated on Matrigel®, along with increased lipid levels, which is an interesting observation recorded in this study.
Often, researchers utilize a treatment with rosiglitazone to increase 3T3-L1 differentiation efficiency [Citation28]. As a PPARγ agonist, rosiglitazone stimulates 3T3-L1 cell differentiation and lipid accumulation [Citation89]. Although, rosiglitazone treatment results in enhanced adipogenesis of 3T3-L1 cells, PPARγ is a very promiscuous receptor that binds to various other agonists, including other thiazolidinediones (TZDs) [Citation9], bisphenol A (BPA) [Citation90,Citation91] and tetrahydrocannabinol (THC) [Citation92]. This raises the possibility that rosiglitazone treatment can interfere with the response of 3T3-L1 cells to other pharmaceutical agents that impact adipocyte function through PPARγ. As a result, impact of such drugs on adipocyte differentiation and function may not be clearly elucidated in the presence of rosiglitazone. However, the elimination of rosiglitazone in the differentiation mixture results in poor differentiation and lower lipid accumulation in 3T3-L1 cells [Citation28]. We treated 3T3-L1 cells cultured on the Matrigel® to various concentrations of rosiglitazone, selected from studies that use this molecule as a positive control for lipid accumulation [Citation28,Citation93]. demonstrates that 3T3-L1 cells differentiated on Matrigel® accumulate greater amounts of triglycerides, even in the absence of rosiglitazone (). Interestingly, treatment of cells grown on polystyrene tissue culture surfaces with a range of rosiglitazone concentrations (1 μM to 4 μM) is required to increase lipid accumulation to the same levels as seen in cells cultured on Matrigel® in the absence of rosiglitazone treatment (). These results demonstrate that the use of rosiglitazone for effective differentiation of 3T3-L1 cells may not be required when 3T3-L1 cells are differentiated on Matrigel®.
Interestingly, when gene expression of adipocyte differentiation, lipid synthesis, and adipocyte maturity markers were evaluated at day 14 following differentiation with various concentrations of rosiglitazone, the cells grown polystyrene did not demonstrate an increase in mRNA levels of PPARγ, FAS and ADIPOQ (). While the mRNA levels of CEBPγγγFABP4 and LEP () increased with 2 μM of rosiglitazone treatment in cells on polystyrene. However, gene expression patterns of these markers in 3T3-L1 cells on Matrigel® were different, such that levels of PPARγγγADIPOQ, FABP4 and LEP increased significantly with rosiglitazone treatment, compared to untreated cells on Matrigel®. Thus, Matrigel® consistently demonstrates higher gene expression of adipogenic markers. The mechanism of action for rosiglitazone suggests that it increases the activity of PPARγ by enhancing its binding to target genes rather than by increasing its expression [Citation94]. In fact, rosiglitazone can potentially repress the expression of PPARγ mRNA [Citation95,Citation96], which may suggest that lack of increase in the mRNA levels of PPARγ does not necessarily mean there will be decreased adipocyte maturity and function.
Hamamoto et al. (2010) demonstrated that Matrigel® promoted β-cell differentiation in two pancreatic progenitor-like cell lines and cultured ductal epithelial cells [Citation97]. Furthermore, they reported that Matrigel® exerted its effects on β-cell differentiation through induction of Pax6, a key transcription factor; an effect that was reproduced partly by an individual ECM component, laminin-1 [Citation97]. Taken together, our results demonstrate that Matrigel® enhances adipocyte differentiation and lipid accumulation in 3T3-L1 cells. In fact, our data support the view that Matrigel enhances the capacity of 3T3-L1 cells to accumulate lipid even in the absence of agents, such as rosiglitazone, to induce cellular differentiation. Our gene expression analysis also supports the view that adipocytes grown on Matrigel® more robustly express the genes linked to adipocyte maturity and this may, in part, be linked to stiffness of the ECM. These effects may arise from components of the Matrigel® or through the increased cell–cell interaction, which can be visually observed in cells cultured on this matrix. These observations clearly underscore the need to more clearly understand the mechanism for how ECM may impact the response of adipocytes to environmental and hormonal cues.
MATERIALS and METHODS
Cell Culture
3T3-L1 cells (American Type Culture Collection®, CL-173) were cultured in Dulbecco’s Modification of Eagle’s Medium (DMEM) with 1 g/L glucose (Corning®, 10–014-CV), supplemented with 10% foetal bovine serum (FBS) (Thermo Fisher Scientific, 12,483,020), 1% Penicillin-Streptomycin (GibcoTM, 15,140,122), and 1% L-glutamine (GibcoTM, 25,030,081), at 37°C in a humidified CO2 incubator. For differentiation, 3T3-L1 cells were seeded at 30,000 cells/cm2 in the media described above, placed in the incubator for 48 hours, to reach 100% confluence, and differentiated with DMEM 1X with 4.5 g/L glucose (Corning®, 10–013-CV), supplemented with 10% FBS, 1% Penicillin-Streptomycin, 1% L-glutamine, 1 μg/ml insulin (insulin solution from bovine pancreas in 25 mM HEPES, Sigma-Aldrich, I0516-5ML), 0.25 μM dexamethasone (DEX) (Sigma-Aldrich, D4902-100 MG) and 0.5 mM isobutyl-methyl-xanthine (IBMX) (Sigma-Aldrich, I5879-250 MG) (). 48 hours following initiation of differentiation, the media was replaced with maintenance media (DMEM with 4.5 g/L glucose, 10% FBS, 1% penicillin streptomycin, 1% L-glutamine, and 1 µg/ml insulin), and the cells were re-supplemented with maintenance media every 48 hours until day 21 ().
Matrigel® Coating
Corning® Matrigel® Basement Membrane Matrix (High Concentration and Growth Factor Reduced, 18 mg/ml) (Corning®, 354,263) was thawed overnight in ice at 4°C and diluted to 10 mg/ml with DMEM, 1X serum-free and without phenol red (Corning®, 17205CV). Matrigel® volume was determined based on a predetermined thickness/height of Matrigel® (250 μm) using the formula ‘volume = (area of the base) x (height)’. Therefore, the volume for 250 μm layer of Matrigel® for 12-well plates (3.9cm2 surface area) was 98 μL. This method has been previously used by our laboratory and the volume to height ratios for this surface area has been confirmed [Citation29]. The coated plates were stored at 37°C for 2 hours and then used for cell culture experiments.
Oil Red O Assay: Staining and Quantification
Lipid accumulation of adipocytes was visualized and quantified using an Oil Red O (ORO) Assay, a method that has been well characterized for staining and quantifying lipids in fat cells [Citation98]. 3T3-L1 cells were washed with PBS and then fixed with a mixture of 1% Glutaraldehyde (Sigma-Aldrich®, G7526-10 mL) and 0.5% Paraformaldehyde (Sigma-Aldrich®, P6148-500 g). Once fixed, the cells were incubated in 60% isopropanol (Sigma-Aldrich®, 67–63-0), stained with the ORO solution (Sigma-Aldrich®, O1391-500 mL). The dye was extracted using 100% Butanol (Sigma-Aldrich®, B7906-500 mL) and quantified using a spectrophotometer (Multiskan Spectrum, Thermo Electron Corporation) at 510 nm.
Gene Expression: Harvest, RNA isolation, cDNA prep, RT-qPCR
At day 0 (prior to differentiation) and days 4, 14 and 21 (post initiation of differentiation), 3T3-L1 cells were extracted from Matrigel® by shaking for an hour at 4°C in cell recovery solution (Corning®, 354,253). The cells were then centrifuged at 800xg for 5 minutes (repeated three times); initially to separate the cell pellet from Matrigel® and then twice with PBS to wash off Matrigel® residue. After the final wash, the supernatant was removed, and the cell pellet was resuspended in TrizolTM (Thermo Fisher Scientific, 15,596,026). For high-quality RNA isolation, the 3T3-L1 cells in TrizolTM were lysed by passage through a 20 G syringe needle (BD PrecisionGlideTM, Z118044) for up to 70 times, then supplemented with chloroform and filtered through the Zymo-SpinTM IIC Columns using the Direct-zolTM RNA MiniPrep kit (Zymo Research, Cedarlane Labs, R2050). The cDNA was prepared using 1 μg of RNA, with the High-Capacity cDNA Reverse Transcription Kit (Applied BiosystemsTM, 4,368,813). RT-qPCR was performed at the following conditions: polymerase activation (95°C for 10 minutes); 39 cycles of denaturing (95°C for 10 seconds), denaturing (60°C for 10 seconds), elongation (72°C for 15 seconds) {Bio-Rad C1000 Thermal Cycler (CFX384 TouchTM Real-Time PCR Detection System)}. The threshold cycle (Ct) values were used to calculate relative gene expression, using the ΔΔCT method, with Ribosomal Protein L37a (RPL37a) and Ribosomal Protein L32 (RPL32) as housekeeping genes. Primer sequences of all the genes investigated in this study, including the housekeeping genes, are outlined in .
Table 1. Forward and reverse sequences for the primers used for RT-qPCR
Statistics
Statistical analysis was performed using the GraphPad Prism software (Prism 8 for Mac OS X, Version 5.0a, GraphPad Software, Inc.). All data points were expressed as mean ± SEM and analysed using either one-way analysis of variance (ANOVA) or two-way ANOVA, with Tukey’s post-test, as appropriate for the experiment. Results represent data collected from three biological replicates, which were separated by passage and time of culturing. P ≤ 0.05 was considered significant, and statistical changes were denoted by differing letters on data figures. Different letters (a, b, etc) indicate statistically significant difference between the two data points. A mix of letters indicate statistically significant difference between two data points that have different set of letters (i.e., ab and cd are statistically different). Meanwhile, a mix of letters that have at least one same letter in the combination indicate no significant difference between data points (i.e., ab and bc are not statistically different).
Author contributions
C.J. and S.R. designed the project. C.J. and S.K. performed the experiments. The manuscript was written by C.J. and S.R. with editing by all authors.
Disclosure statement
No potential conflict of interest was reported by the authors.
Additional information
Funding
References
- Birsoy K, Festuccia WT, Laplante M. A comparative perspective on lipid storage in animals. J Cell Sci. 2013;126(7):1541–1552.
- Gallagher EJ, LeRoith D. Insulin, insulin resistance, obesity, and cancer. Curr Diab Rep. 2010;10(2):93–100.
- Makki K, Froguel P, Wolowczuk I. Adipose Tissue in Obesity-Related Inflammation and Insulin Resistance: cells, Cytokines, and Chemokines. ISRN Inflamm. 2013;2013:1–12.
- Wronska A, Kmiec Z. Structural and biochemical characteristics of various white adipose tissue depots. Acta Physiol. 2012;205(2):194–208.
- Ailhaud G, Grimaldi P, Négrel R. Cellular and molecular aspects of adipose tissue development. Annu Rev Nutr. 1992;12(1):207–233. Internet.
- Miettinen S, Sarkanen JR, Ashammakhi N. Adipose Tissue and Adipocyte Differentiation: molecular and Cellular Aspects and Tissue Engineering Applications. Top Tissue Eng. 2008;4:1–26.
- Shao X, Wang M, Wei X, et al. Peroxisome Proliferator-Activated Receptor-γ: master Regulator of Adipogenesis and Obesity. Curr Stem Cell Res Ther. Internet. 2016;11(3):282–289.
- Ma X, Wang D, Zhao W, et al. Deciphering the roles of PPARγ in adipocytes via dynamic change of transcription complex. Front Endocrinol (Lausanne). 2018;9. DOI:https://doi.org/10.3389/fendo.2018.00473
- Ahmadian M, Suh JM, Hah N, et al. PPARgamma signaling and metabolism: the good, the bad and the future. Nat Med. Internet. 2013;19(5):557–566.
- Ambele MA, Dessels C, Durandt C, et al. Genome-wide analysis of gene expression during adipogenesis in human adipose-derived stromal cells reveals novel patterns of gene expression during adipocyte differentiation. Stem Cell Res. 2016.
- Ntambi JM, Kim Y-C, Adipocyte differentiation and gene expression. J Nutr. Internet. 2000;130(12):3122–3126.
- Lefterova MI, Lazar MA. New developments in adipogenesis. Trends Endocrinol Metab. 2009;20(3):107–114.
- Wu Z, Rosen ED, Brun R, et al. Cross-regulation of C/EBPα and PPARγ controls the transcriptional pathway of adipogenesis and insulin sensitivity. Mol Cell. 1999;3(2):151–158. .
- Eberlé D, Hegarty B, Bossard P, et al. SREBP transcription factors: master regulators of lipid homeostasis. Biochimie. 2004;86(11):839–848.
- Thompson GM, Trainor D, Biswas C, et al. A high-capacity assay for PPARγ ligand regulation of endogenous aP2 expression in 3T3-L1 cells. Anal Biochem. 2004;330(1):21–28.
- Garin-Shkolnik T, Rudich A, Hotamisligil GS, et al. FABP4 attenuates PPARγ and adipogenesis and is inversely correlated with PPARγ in adipose tissues. Diabetes. 2014;63(3):900–911.
- Laplante M, Sell H, MacNaul KL, et al. PPAR-γ activation mediates adipose depot-specific effects on gene expression and lipoprotein lipase activity: mechanisms for modulation of postprandial lipemia and differential adipose accretion. Diabetes. 2003;52(2):291–299.
- Ku BJ, Shong M, Kim JM, et al. The Roles of Adipokines, Proinflammatory Cytokines, and Adipose Tissue Macrophages in Obesity-Associated Insulin Resistance in Modest Obesity and Early Metabolic Dysfunction. PLoS One. 2016.
- Green H, Meuth M. An established pre-adipose cell line and it’s differentation in culture. Cell. 1974;3(2):127–133.
- Robenek H, Buers I, Hofnagel O, et al. Compartmentalization of proteins in lipid droplet biogenesis. Biochimica Et Biophysica Acta - Molecular and Cell Biology of Lipids. 2009;1791(6):408–418.
- Frantz C, Stewart KM, Weaver VM, The extracellular matrix at a glance. J Cell Sci. Internet. 2010;123(24):4195–4200.
- Nakajima I, Yamaguchi T, Ozutsumi K, et al. Adipose tissue extracellular matrix: newly organized by adipocytes during differentiation. Differentiation. 1998;63(4):193–200.
- Mariman ECM, Wang P, Adipocyte extracellular matrix composition, dynamics and role in obesity. Cell Mol Life Sci. Internet. 2010;67(8):1277–1292.
- Ruiz-Ojeda F, Rupérez A, Gomez-Llorente C, et al. Cell Models and Their Application for Studying Adipogenic Differentiation in Relation to Obesity: a Review. Int J Mol Sci. 2016;17(7):1040.
- Kokai LE, Marra KG, Kershaw EE. Three-dimensional adipocyte culture: the next frontier for adipocyte biology discovery. Endocrinology. 2015;156(12):4375–4376.
- Biosensors C, Edmondson R, Broglie JJ, et al. Three-dimensional cell culture systems and their applications in drug discovery and cell-based biosensors Internet. 2014;12(4):207–218. Available from. Assay Drug Dev Technol. http://www.ncbi.nlm.nih.gov/pubmed/24831787%5Cnhttp://www.pubmedcentral.nih.gov/articlerender.fcgi?artid=PMC4026212.
- Spiegelman BM, Farmer SR. Decreases in tubulin and actin gene expression prior to morphological differentiation of 3T3 Adipocytes. Cell. 1982;29(1):53–60.
- Zebisch K, Voigt V, Wabitsch M, et al. Protocol for effective differentiation of 3T3-L1 cells to adipocytes. Anal Biochem. 2012;425(1):88–90.
- Wong MK, Shawky SA, Aryasomayajula A, et al. Extracellular matrix surface regulates self-assembly of three-dimensional placental trophoblast spheroids. PLoS One. 2018.
- Jin Y, Lee JS, Kim J, et al. Three-dimensional brain-like microenvironments facilitate the direct reprogramming of fibroblasts into therapeutic neurons. Nat Biomed Eng. 2018;2(7):522–539. .
- Park KM, Lewis D, Gerecht S. Bioinspired Hydrogels to Engineer Cancer Microenvironments. Annu Rev Biomed Eng. 2017;19(1):109–133.
- Fang Y, Eglen RM. Three-Dimensional Cell Cultures in Drug Discovery and Development. SLAS Discov. Internet. 2017;2472555217696795. Available from; :. http://www.ncbi.nlm.nih.gov/pubmed/28314117
- Anton D, Burckel H, Josset E, et al. Three-dimensional cell culture: a breakthrough in vivo. Int J Mol Sci. 2015;16(12):5517–5527.
- Hughes CS, Postovit LM, Lajoie GA. Matrigel: a complex protein mixture required for optimal growth of cell culture. Proteomics. 2010;10(9):1886–1890.
- Pierleoni C, Verdenelli F, Castellucci M, et al. Fibronectins and basal lamina molecules expression in human subcutaneous white adipose tissue Internet. 1998;42(3):183–188. Available from. Eur J Histochem. http://www.ncbi.nlm.nih.gov/pubmed/9857243.
- Aratani Y, Kitagawa Y. Enhanced synthesis and secretion of type IV collagen and entactin during adipose conversion of 3T3-L1 cells and production of unorthodox laminin complex. J Biol Chem. 1988;263(31):16163–16169.
- O’Connor KC, Song H, Rosenzweig N, et al. Extracellular matrix substrata alter adipocyte yield and lipogenesis in primary cultures of stromal-vascular cells from human adipose. Biotechnol Lett. 2003;25(23):1967–1972.
- Kawaguchi N, Toriyama K, Nicodemou-Lena E, et al. Reconstituted basement membrane potentiates in vivo adipogenesis of 3T3-F442A cells. Cytotechnology. 1999;31(3):215–220.
- Hausman GJ, Wright JT, Richardson RL. The Influence of Extracellular Matrix Substrata on Preadipocyte Development in Serum-Free Cultures of Stromal-Vascular Cells. J Anim Sci. 1996;74(9):2117.
- Kawaguchi N, Toriyama K, Nicodemou-Lena E, et al. De novo adipogenesis in mice at the site of injection of basement membrane and basic fibroblast growth factor. Proc Natl Acad Sci U S A. 1998;95(3):1062–1066.
- Sadowski HB, Wheeler TT, Young DA. Gene expression during 3T3-L1 adipocyte differentiation. Characterization of initial responses to the inducing agents and changes during commitment to differentiation. J Biol Chem. 1992;267(7):4722–4731.
- Poulos SP, Dodson MV, Hausman GJ, Cell line models for differentiation: preadipocytes and adipocytes. Exp Biol Med (Maywood, NJ). Internet. 2010;235(10):1185–1193.
- Morrison S, McGee SL. 3T3-L1 adipocytes display phenotypic characteristics of multiple adipocyte lineages. Adipocyte. 2015;4(4):295–302.
- Rubin CS, Hirsch A, Fung C, et al. Development of hormone receptors and hormonal responsiveness in vitro. Insulin receptors and insulin sensitivity in the preadipocyte and adipocyte forms of 3T3-L1 cells. J Biol Chem. 1978;253(20):20.
- Mehra A, Macdonald I, Pillay TS. Variability in 3T3-L1 adipocyte differentiation depending on cell culture dish. Anal Biochem. 2007;362(2):281–283.
- Zeigerer A, Rodeheffer MS, McGraw TE, et al. Insulin regulates leptin secretion from 3T3-L1 adipocytes by a PI 3 kinase independent mechanism. Exp Cell Res. 2008;314(11–12):11–12.
- Sheng X, Tucci J, Malvar J, et al. Adipocyte differentiation is affected by media height above the cell layer. Int J Obes. 2014;38(2):315–320.
- Kawada T, Aoki N, Kawai R, et al. Proliferation of 3T3-L1 preadipocytes in a completely defined serum-free medium. Cell Biol Int Rep. 1990;14(6):567–574.
- Russell TR. Growth and Cytodifferentiation of 3T3-L1 Preadipocytes into Adipocytes. Methods Enzymol. 1981;72(C):720–723.
- Guo L, Li X, Tang QQ. Transcriptional regulation of adipocyte differentiation: a central role for CCAAT/ enhancer-binding protein (C/EBP) β. J Biol Chem. 2015;290(2):755–761.
- Payne VA, Au WS, Lowe CE, et al. C/EBP transcription factors regulate SREBP1c gene expression during adipogenesis. Biochem J. 2010;425(1):215–224. .
- Berndt J, Kovacs P, Ruschke K, et al. Fatty acid synthase gene expression in human adipose tissue: association with obesity and type 2 diabetes. Diabetologia. 2007;50(7):1472–1480. .
- Hickenbottom SJ, Kimmel AR, Londos C, et al. Structure of a lipid droplet protein: the PAT family member TIP47. Structure. 2004;12(7):1199–1207.
- Takahashi Y, Shinoda A, Furuya N, et al. Perilipin-Mediated Lipid Droplet Formation in Adipocytes Promotes Sterol Regulatory Element-Binding Protein-1 Processing and Triacylglyceride Accumulation. PLoS One. 2013;8(5):e64605. .
- Weiner FR, Shah A, PJ S, et al. Regulation of collagen gene expression in 3T3-L1 cells. Effects of adipocyte differentiation and tumor necrosis factor alpha. Biochemistry. 1989;28(9):4094–4099.
- Ali AT, Hochfeld WE, Myburgh R, et al. Adipocyte and adipogenesis. Eur J Cell Biol. 2013;92(6–7):229–236.
- ECACC General Cell Collection: 3T3 L1 [Internet] [Access date: 23 June 2021]. Available from: https://www.phe-culturecollections.org.uk/products/celllines/generalcell/detail.jsp?refId=86052701&collection=ecacc_gc
- Edmondson R, Broglie JJ, Adcock AF, et al. Three-dimensional cell culture systems and their applications in drug discovery and cell-based biosensors. Assay Drug Dev Technol. 2014;12(4):207–218.
- Aulthouse AL, Freeh E, Newstead S, et al. Part 1: a Novel Model for Three-Dimensional Culture of 3T3-L1 Preadipocytes Stimulates Spontaneous Cell Differentiation Independent of Chemical Induction Typically Required in Monolayer. Nutr Metab Insights. 2019;12:117863881984139.
- Huh D, Hamilton GA, Ingber DE. From 3D cell culture to organs-on-chips. Trends Cell Biol. 2011;21(12):745–754.
- Christiaens V, Lijnen HR. Angiogenesis and development of adipose tissue. Mol Cell Endocrinol. 2010;318(1–2):2–9.
- Turner PA, Tang Y, Weiss SJ, et al., Three-dimensional spheroid cell model of in vitro adipocyte inflammation. Tissue Eng Part A. Internet. 2015;21(11–12):1837–1847.
- Young DA, Choi YS, Engler AJ, et al. Stimulation of adipogenesis of adult adipose-derived stem cells using substrates that mimic the stiffness of adipose tissue. Biomaterials Internet. 2013 Nov;34(34):8581–8588. Available from. http://www.sciencedirect.com/science/article/pii/S0142961213009319
- Buxboim A, Rajagopal K, Brown AEX, et al. How deeply cells feel: methods for thin gels. J Phys Condens Matter. 2010;22(19):19.
- d’Angelo M, Benedetti E, Tupone MG, et al. The Role of Stiffness in Cell Reprogramming: a Potential Role for Biomaterials in Inducing Tissue Regeneration. Cells. 2019;8(9):1036. .
- Ojima K, Oe M, Nakajima I, et al. Dynamics of protein secretion during adipocyte differentiation. FEBS Open Bio. 2016;6(8):816–826.
- Sunyer R, Jin AJ, Nossal R, et al. Fabrication of Hydrogels with Steep Stiffness Gradients for Studying Cell Mechanical Response. PLoS One. 2012;7(10):e46107.
- Chaudhuri O, Koshy ST, Branco Da Cunha C, et al. Extracellular matrix stiffness and composition jointly regulate the induction of malignant phenotypes in mammary epithelium. Nat Mater. 2014;13(10):970–978. .
- Wells RG. The role of matrix stiffness in regulating cell behavior. Hepatology. 2008;47(4):1394–1400.
- Gilbert PM, Havenstrite KL, Magnusson KEG, et al. Substrate elasticity regulates skeletal muscle stem cell self-renewal in culture. Science. 2010;329(5995):1078–1081. .
- Vukicevic S, Kleinman HK, Luyten FP, et al. Identification of multiple active growth factors in basement membrane matrigel suggests caution in interpretation of cellular activity related to extracellular matrix components. Exp Cell Res. 1992;202(1):1–8.
- Mandrup S, Lane MD. Regulating adipogenesis. J Biol Chem. 1997;272(9):5367–5370.
- Lefterova MI, Zhang Y, Steger DJ, et al. PPAR and C/EBP factors orchestrate adipocyte biology via adjacent binding on a genome-wide scale. Genes Dev. 2008;22(21):21. .
- Gross-Steinmeyer K, Stapleton PL, Tracy JH, et al. Influence of Matrigel-overlay on constitutive and inducible expression of nine genes encoding drug-metabolizing enzymes in primary human hepatocytes. Xenobiotica Internet. 2008. Available from: http://www.tandfonline.com/doi/abs/10.1080/00498250500137427
- Brännmark C, Paul A, Ribeiro D, et al. Increased adipogenesis of human adipose-derived stem cells on polycaprolactone fiber matrices. PLoS One. 2014;9(11):e113620. .
- Turner PA, Harris LM, Purser CA, et al. A surface-tethered spheroid model for functional evaluation of 3T3-L1 adipocytes. Biotechnol Bioeng. 2014;111(1):174–183.
- Kim JB, Spiegelman BM. ADD1/SREBP1 promotes adipocyte differentiation and gene expression linked to fatty acid metabolism. Genes Dev. 1996;10(9):1096–1107.
- MacDougald OA, Lane MD. Transcriptional regulation of gene expression during adipocyte differentiation. Annu Rev Biochem. 1995;64(1):345–373.
- Paulauskis JD, Sul HS. Cloning and expression of mouse fatty acid synthase and other specific mRNAs. Developmental and hormonal regulation in 3T3-L1 cells. J Biol Chem. 1988;263(15):15.
- Moseti D, Regassa A, Kim WK. Molecular regulation of adipogenesis and potential anti-adipogenic bioactive molecules. Int J Mol Sci. 2016;17(1):124.
- Hollenberg AN, Susulic VS, Madura JP, et al. Functional antagonism between CCAAT/enhancer binding protein-α and peroxisome proliferator-activated receptor-γ on the leptin promoter. J Biol Chem. 1997;272(8):5283–5290. .
- Ribarik Coe N, Bernlohr DA. Physiological properties and functions of intracellular fatty acid- binding proteins. Biochimica Et Biophysica Acta - Lipids and Lipid Metabolism. 1998;1391.
- Hynes GR, Jones PJ, Leptin and its role in lipid metabolism. Curr Opin Lipidol. Internet. 2001;12(3):321–327.
- Spiegelman BM, Ginty CA. Fibronectin modulation of cell shape and lipogenic gene expression in 3t3-adipocytes. Cell. 1983;35(3 PART 2):657–666.
- Lareu RR, Subramhanya KH, Peng Y, et al. Collagen matrix deposition is dramatically enhanced in vitro when crowded with charged macromolecules: the biological relevance of the excluded volume effect. FEBS Lett. 2007;581(14):2709–2714. .
- Ono M, Aratani Y, Kitagawa I, et al. Ascorbic acid phosphate stimulates type IV collagen synthesis and accelerates adipose conversion of 3T3-L1 cells. Exp Cell Res. 1990;187(2):309–314.
- Kuri-Harcuch W, Argüello C, Marsch-Moreno M. Extracellular matrix production by mouse 3T3-F442A cells during adipose differentiation in culture. Differentiation. 1984;28(2):173–178.
- Streuli CH, Bissell MJ, Expression of extracellular matrix components is regulated by substratum. J Cell Biol. Internet. 1990;110(4):1405–1415.
- Wolffenbuttel BH, Sels JP, Huijberts MS. Rosiglitazone. Expert Opin Pharmacother. 2001;2(3):467–478.
- Ahmed S, Atlas E. Bisphenol S- and bisphenol A-induced adipogenesis of murine preadipocytes occurs through direct peroxisome proliferator-activated receptor gamma activation. Int J Obes. 2016;40(10):1566–1573.
- Atlas E, Pope L, Wade MG, et al., Bisphenol A increases aP2 expression in 3T3L1 by enhancing the transcriptional activity of nuclear receptors at the promoter. Adipocyte. Internet. 2014;3(3):170–179.
- Teixeira D, Pestana D, Faria A, et al. Modulation of adipocyte biology by Δ9-tetrahydrocannabinol. Obesity. 2010;18(11):2077–2085.
- Pomatto V, Cottone E, Cocci P, et al. Plasticizers used in food-contact materials affect adipogenesis in 3T3-L1 cells. J Steroid Biochem Mol Biol. 2018;178:322–332.
- Haakonsson AK, Madsen MS, Nielsen R, et al. Acute genome-wide effects of rosiglitazone on PPARγ transcriptional networks in adipocytes. Mol Endocrinol. 2013;27(9):1536–1549.
- Camp HS, Whitton AL, Tafuri SR. PPARγ activators down-regulate the expression of PPARγ in 3T3-L1 adipocytes. FEBS Lett. 1999;447(2–3):186–190.
- Perrey S, Ishibashi S, Yahagi N, et al. Thiazolidinedione- and tumor necrosis factor alpha-induced downregulation of peroxisome proliferator-activated receptor gamma mRNA in differentiated 3T3-L1 adipocytes. Metabolism. 2001;50(1):36–40. .
- Hamamoto K, Yamada S, Hara A, et al. Extracellular matrix modulates insulin production during differentiation of AR42J cells: functional role of Pax6 transcription factor. J Cell Biochem. 2011;112(1):318–329.
- Ramírez-Zacarías JL, Castro-Muñozledo F, Kuri-Harcuch W. Quantitation of adipose conversion and triglycerides by staining intracytoplasmic lipids with oil red O. Histochemistry. 1992.