
ABSTRACT
Obesity is a complex medical condition that affects multiple organs in the body. However, the underlying mechanisms of obesity, as well as its treatment, are largely unexplored. The focus of this research was to use bioinformatics to discover possible treatment targets for obesity. To begin, the GSE133099 database was used to identify 364 differentially expressed genes (DEGs). Then, DEGs were subjected to tissue-specific analyses and enrichment analyses, followed by the creation of a protein-protein interaction (PPI) network and generation of a drug-gene interaction database to screen key genes and potential future drugs targeting obesity. Findings have illustrated that the tissue-specific expression of neurologic markers varied significantly (34.7%, 52/150). Among these genes, Lep, ApoE, Fyn, and FN1 were the key genes observed in the adipocyte samples from obese patients relative to the controls. Furthermore, nine potential therapeutic drugs (dasatinib, ocriplasmin, risperidone, gemfibrozil, ritonavir, fluvastatin, pravastatin, warfarin, atorvastatin) that target the key genes were also screened and selected. To conclude the key genes discovered (Lep, ApoE, Fyn, and FN1), as well as 9 candidate drugs, could be used as therapeutic targets in treating obesity.
Introduction
Obesity is a major global public health concern and is considered the most common and costly nutritional problem [Citation1,Citation2]. Affecting around 2.1 billion people worldwide, the number of people with obesity only continues to rise. Moreover, it is estimated that over 3 million people succumb to obesity-related diseases every year [Citation3–5]. Obesity has been linked to high morbidity and mortality rates, with consequences leading to many diseases and comorbidities, such as liver disease, cardiovascular disease, type 2 diabetes, stroke, osteoarthritis, obstructive sleep apnoea, and cancer [Citation6–9].
Obesity is characterized by increased mass in the adipose tissue, which is linked to the persistent activation of inflammatory pathways in both adipocytes and macrophages living in or invading the adipose tissues [Citation10–12]. A previous study has revealed that the adipocyte’s p62 is a critical regulator of energy balance and adiposity in vivo [Citation13]. Moreover, Trayhurn P. demonstrated that adipose hypoxia might be a causative factor for adipose dysfunction in obesity [Citation14]. Despite the new knowledge and theories regarding adipose and obesity, current research methods fall short in providing personalized therapies for obese patients. As this condition may lead to multiple diseases if left untreated, urgent interventions are therefore highly imperative. Thus, specific therapeutic targets for obesity are needed to alleviate the consequences and curb the growing population of obese patients worldwide.
With the development of molecular technology and bioinformatics, more and more highly differentially expressed candidates’ genes are screened. Gene Expression Omnibus (GEO), an online dataset comprised of gene profiles produced primarily utilizing DNA microarray technology [Citation15,Citation16]. In this research, we analysed the DEGs that participate in obesity through microarray and bioinformatic analysis to screen for disease-associated genes, gain a new understanding concerning the mechanisms that underlie obesity, and contribute to the development of a more strategized approach for controlling obesity.
Materials & methods
Data acquisition and processing
The microarray dataset GSE133099 was acquired from the Gene Expression Omnibus (GEO) database (www.ncbi.nlm.nih.gov/geo/). The dataset was based on the GPL16791 platform comprising six obese and six healthy (control) adipocyte samples excised from a slice of subcutaneous tissue, and the six obese patients were all female, and the mean age was 55 (range 41–79) years with BMI >27 kg/m2.
The R (version 4.0.2) was utilized to process and analyse raw data. The raw GSE133099 dataset was preprocessed using the same programme. DEGs involved in obesity were validated utilizing the criteria: FDR <0.05 and |log2 Fold Change| >1 [Citation17]. Genes were further processed and plotted into volcano plots using ggplot2.
Gene ontology and pathway of DEGs
Obesity-related GO terms and pathways were obtained through the web-based platform DAVID (ver. 6.8) (https://david.ncifcrf.gov/) [Citation18]. Gene enrichment was analysed using GO [Citation19] and KEGG [Citation20] analysis to predict the potential biological value of DEGs. P value of <0.05 was defined as significant.
Tissue-specific gene expression analysis
The information about gene functions can be obtained from tissue-specific genes. The BioGPS database (http://biogps.org/#goto=welcome) was utilized to screen for tissue-specific DEGs [Citation21]. Transcripts that were extremely tissue-specific and mapped to a single tissue were considered for inclusion if the median expression of the transcript is more than 10 times that of all other tissues.
PPI network construction and analysis
STRING (https://string-db.org/) database was utilized to create the PPI networks [Citation22]. A confidence score of ≥ 0.4 was adjusted as the cut-off for this program. The Cytoscape software (version 3.7.2) and the CytoHubba plugin (version 0.1) were then utilized for visualizing and identifying the PPI network. Next, the 20 highest-ranking hub genes were determined by employing three calculation methods, Degree, Stress, and EcCentricity, based on a filtering algorithm. This is followed by the construction of a Venn diagram to validate the significance of principal genes in obesity and look for the intersecting genes between the tissue-specific genes and hub genes as key genes.
Screening of candidate drugs
The drug-gene interaction database (DGIdb, http://www.dgidb.org/) is an online resource that presents drug-gene interactions from different sources such as databases and web resources [Citation23,Citation24]. Drug candidates that were selected from the detected drug-gene interactions were all approved by the Food and Drug Administration (FDA). Lastly, drugs with more than two dataset sources and/or PubMed references supportive of the drug-gene interaction were considered as candidate drugs.
Results
Differential expression analysis
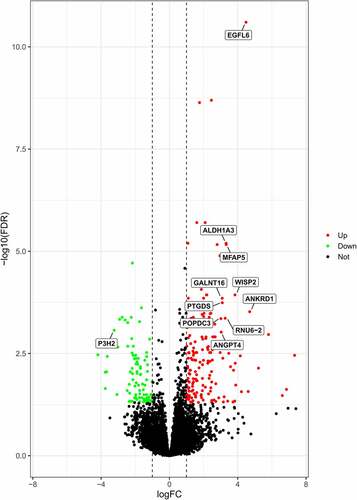
The microarray data from 6 obese patients and 6 normal subjects were gathered and analysed for this study. A total of 364 obesity-specific DEGs were recognized with criteria of FDR at <0.05 and |log2 Fold Change| >1 (). The 11 considerably expressed genes between the 2 cohorts were retrieved utilizing thresholds at |log2 (FC)| >3 and FDR <0.001 ().
Figure 1. Differentially expressed genes (DEGs) between the obesity and control cohorts. Volcano plot of GSE133099 and 11 substantially expressed genes were detected. Black, green, and red dots represent unchanged, downregulated, and upregulated genes, in that order
Enrichment analysis of DEGs
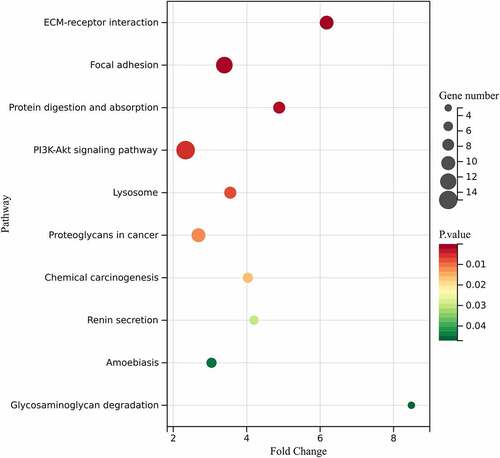
GO functional analysis was separated into 3 cohorts, including Molecular function (MF), Cellular Component (CC), and Biological Process (BP). Based on the analysis, DEGs were primarily enriched in ‘Integrin binding’, ‘Proteinaceous extracellular matrix’, and ‘Extracellular matrix organization’ with Sanger Box ( and ). KEGG pathway enrichment analysis further revealed that the genes are primarily enriched in ‘ECM-receptor interaction’, ‘Protein digestion and absorption’, and ‘Focal adhesion’ ( and ).
Table 1. Significantly enriched GO terms in obesity-related DEGs
Table 2. Significantly enriched pathways in obesity-related DEGs
Figure 2. Biological functions based on Gene Ontology (GO) analysis of obesity-related DEGs
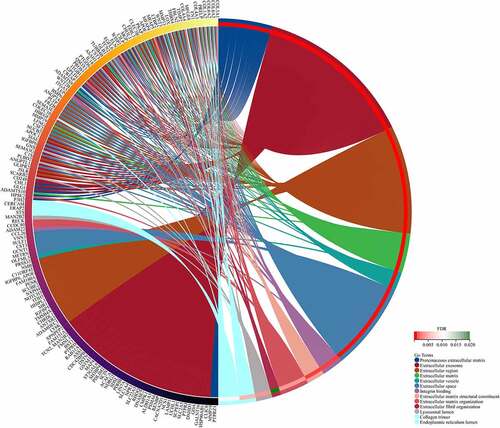
Figure 3. KEGG pathway analysis of obesity-related DEGs
DEGs specificity in tissue expression
Utilizing BioGPS, we identified an aggregate of 150 DEGs that were expressed preferentially in specific tissues. The expression of tissue-specific markers of the neurologic system varied significantly (34.7%, 52/150), followed by the immune system (34%, 51/150), genital system (25.3%, 38/150), respiratory system (18.7%, 28/150), digestive system (18%, 27/150), circulatory system (17.3%, 26/150), skeletal muscle system (17.3%, 25/150), endocrine system (16%, 24/150), urinary system (9.3%, 14/150), and the haematological system (8%, 12/150) ().
Table 3. Tissue-specific genes identified using BioGPS
Key gene identification and analysis
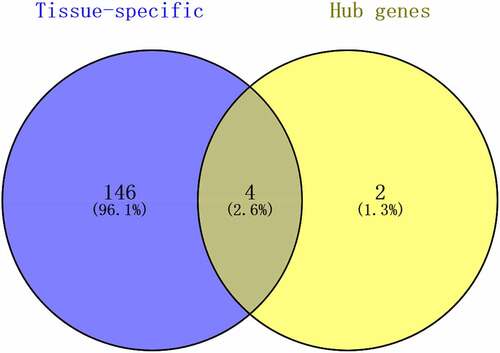
Using the Cytohubba plugin, the top 20 connected proteins from the PPI network were gathered together with the rank of each hub gene. From this list, common hub genes were identified (). Then, the Venn diagram shows the intersecting genes between common hub genes and tissue-specific genes, referred to as the key genes ().
Figure 4. Common hub genes based on Degree, Stress, and EcCentricity algorithm
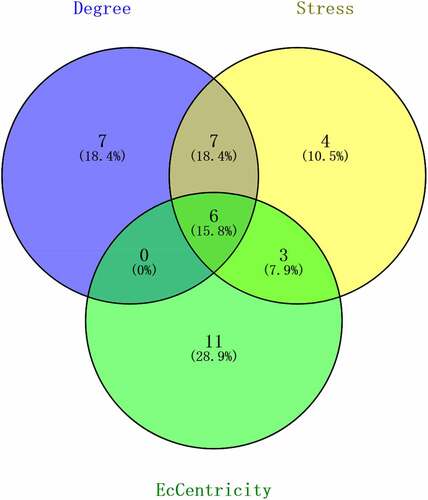
Figure 5. Venn diagram showing the key genes involved in obese adipocyte samples
Candidate drugs screening
In the present study, nine FDA-approved medications that possibly target the protein products of the four key genes were identified using DGIdb. Results show that the promising targets for potential anti-obesity drugs include the APOE (55.6%, 5/9), LEP (22.2%, 2/9), FYN, and FN1 (11.1%, 1/9) genes ().
Table 4. Nine FDA-approved drugs potentially targeting the four key genes
Discussion
Obesity is a growing health problem worldwide, with cases tripling in developing countries [Citation25]. Epidemiological data from the Framingham Heart Study has demonstrated that obesity is contagious, with the probability of obesity increases with a family history of the disease [Citation26]. Moreover, obesity is also considered a significant risk factor for a variety of chronic diseases. Previous studies have indicated that brown adipocytes have a responsibility of balancing heat production and energy metabolism and are crucial for suppressing metabolic diseases and weight gain, both in mice and in humans [Citation27,Citation28]. To present, weight reduction research has mostly concentrated on diets, exercise, food supplementation, medications, and even surgical weight loss, which has the propensity to have negative health consequences [Citation29,Citation30]. Since obesity is a risk variable for numerous diseases, this calls for the urgency of developing a personalized approach to clinical management to avoid or hinder the development of obesity complications.
As a prediction tool, the bioinformatics tool (BioGPS, David and PPI network) and the drug-gene interaction database (DGIdb) database was utilized to confirm the potential genes and therapeutic drugs. However, the bioinformatics tool and the DGIdb itself also has several limitations (Predicting the potential core genes and drugs only). In the present study, 6 obese adipocytes samples and 6 normal adipocytes samples were included. The results indicated that 150 obesity-specific DEGs are involved in the body’s multiple organ systems. DEGs enrichment analysis illustrated that they were predominantly implicated in the extracellular matrix organization, proteinaceous extracellular matrix, and integrin binding. Four key genes (Lep, ApoE, Fyn, and FN1) were screened and analysed to identify potential therapeutic agents for obesity.
Fyn is an SRC family kinase (SFK) that comprises 11 members. It has been previously reported that Fyn performs a function in different biological functions including cell growth, metabolism, and adipogenesis [Citation31,Citation32]. Several studies showed that Fyn is correlated with the regulation of insulin signalling and metabolic diseases [Citation33,Citation34]. In this study, we also identified Fyn as one of the key genes with a potential role in the immune system. Yamada et al. found that mice lacking Fyn kinase had an increased metabolism of fatty acids, consumed more energy, and were thinner than mice with functional Fyn kinases [Citation35]. Alternatively, the selective lack or suppression of Fyn might eradicate inflammation during pro-inflammatory processes and autoimmune [Citation36].
Fibronectin 1 (FN1), on the other hand, is presented in the extracellular matrix and performs a key function in maintaining cell morphology, differentiation, migration, and growth [Citation37]. Berger et al. demonstrated that FN1 is one of the adipocyte-specific dysregulated genes in obese adipose tissues [Citation38]. Similar findings were implied by Yang et al. when they found that FN1 is strongly associated with metabolic syndrome (MetS) and insulin resistance (IR) [Citation39].
Leptin (LEP) is another key gene that codes for a hormone that is predominantly produced and secreted by adipose tissues and functions mainly by regulating food intake, energy expenditure, and lipid metabolism by binding with the LEP receptor (LEPR) [Citation40,Citation41]. LEP is associated with insulin signalling, as well as with inflammatory and immune response [Citation42]. The DNA location of Lnc-Leptin interfaces directly with LEP in mature adipocytes to sustain protein expression in vitro and in vivo, hence supporting adipogenesis [Citation43]. In addition, previous studies have indicated that the concentration of LEP in the blood increases with improved adipose tissue mass [Citation44,Citation45]. Our study also showed that LEP is tightly linked with the genital system, consistent with research conducted by Sun et al. [Citation46].
APOE is a gene situated in chromosome 19q13.2. This gene has three isoforms namely APOE epsilon2 (APOE2), APOE epsilon3 (APOE3) and APOE epsilon4 (APOE4) [Citation47]. The APOE gene product, APOE, is an apolipoprotein that is known to bind lipids and participates in cholesterol metabolism [Citation48]. Previous studies show that the ApoE e2 allele is associated with insulin resistance and increases the risk of type 2 diabetes mellitus diabetes mellitus (T2DM) [Citation49–51].
With the use of the DGIdb database, nine candidate drugs targeting obese-related complications were identified. Among them, lipid-modifying drugs (Gemfibrozil, fluvastatin, pravastatin, and atorvastatin) have functionally significant values in improving insulin function in the body and in ameliorating insulin resistance [Citation52]. Although previous studies have demonstrated that the treatment of insulin resistance benefits the bodyweight, relevant clinical studies about bodyweight with nine of the candidate drugs are rare. Prospective clinical trials and the specific molecular mechanisms are warranted to prove its efficacy in obese is required.
Limitation
First, the study employed a relatively small sample size; hence, future research will be warranted to validate these findings using larger sample sizes and other databases. Second, to better understand the functions of these key genes, more large-scale validation studies and elucidation of the molecular processes of obesity ought to be conducted. Third, obese-related comorbidities should be considered well. Fourth, future studies are warranted to validate these potential candidate drugs for obese therapy and explore the underlying mechanisms.
Conclusion
In summary, this research demonstrates that FYN, FN1, LEP, and APOE are closely related to the occurrence and progression of obesity. These four genes and their associated signalling pathways and candidate drugs are excellent potential candidates for targeted anti-obesity therapy. Additional investigations involving multi-centre and large populations sizes are warranted to verify these findings.
Author statement
Yun Yu and Yu-han Zhang: Statistical Analysis, Manuscript Preparation. Liang Liu: Data Collection, Statistical Analysis. Ling-ling Yu, Jun-pei Li and Ling-juan Zhu: Data Interpretation. Jing-an Rao and Feng Hu: Data Collection. Hui-hui Bao and Xiao-shu Cheng: Study Design and Manuscript revision.
Data availability
The GSE133099 dataset was retrieved from the GEO database.
Disclosure statement
No potential conflict of interest was reported by the author(s).
Additional information
Funding
References
- Zylke JW, Bauchner H. The unrelenting challenge of obesity. JAMA. 2016;315(21):2277–2278.
- Cheng Z, Almeida FA. Mitochondrial alteration in type 2 diabetes and obesity: an epigenetic link. Cell Cycle. 2014;13(6):890–897.
- American Diabetes Association. 8. Obesity management for the treatment of type 2 diabetes: standards of medical care in diabetes-2019. Diabetes Care. 2019;42(Suppl 1):S81–S89.
- Zheng W, McLerran DF, Rolland B, et al. Association between body-mass index and risk of death in more than 1 million Asians. N Engl J Med. 2011;364(8):719–729.
- Ogden CL, Carroll, MD, Curtin, LR, et al. Prevalence of high body mass index in US children and adolescents, 2007-2008. JAMA. 2010;303(3):242–249.
- Ortega FB, Lavie CJ, Blair SN. Obesity and cardiovascular disease. Circ Res. 2016;118(11):1752–1770.
- Upadhyay J, Farr O, Perakakis N, et al. Obesity as a disease. Med Clin North Am. 2018;102(1):13–33.
- Yang Y, Fu M, Li MD, et al. O-GlcNAc transferase inhibits visceral fat lipolysis and promotes diet-induced obesity. Nat Commun. 2020;11(1):181.
- Finkelstein EA, Trogdon JG, Cohen JW, et al. Annual medical spending attributable to obesity: payer-and service-specific estimates. Health Aff (Millwood). 2009;28(5):w822–831.
- Xu H, Barnes GT, Yang Q, et al. Chronic inflammation in fat plays a crucial role in the development of obesity-related insulin resistance. J Clin Invest. 2003;112(12):1821–1830.
- Sun K, Kusminski CM, Scherer PE. Adipose tissue remodeling and obesity. J Clin Invest. 2011;121(6):2094–2101.
- Baker RG, Hayden MS, Ghosh S. NF-κB, inflammation, and metabolic disease. Cell Metab. 2011;13(1):11–22.
- Huang J, Linares JF, Duran A, et al. NBR1 is a critical step in the repression of thermogenesis of p62-deficient adipocytes through PPARγ. Nat Commun. 2021;12(1):2876.
- Trayhurn P. Hypoxia and adipose tissue function and dysfunction in obesity. Physiol Rev. 2013;93(1):1–21.
- Barrett T, D.b T, S.e W, et al. Ncbi geo: archive for functional genomics data sets—10 years on. Nucleic Acids Res. 2011;39(Database):1005–1010.
- Wang J, Zhang C. Identification and validation of potential mRNA- microRNA- long-noncoding RNA (mRNA-miRNA-lncRNA) prognostic signature for cervical cancer. Bioengineered. 2021;12(1):898–913.
- Bolstad BM, Irizarry RA, Astrand M, et al. A comparison of normalization methods for high den sity oligonucleotide array data based on variance and bias. Bioinformatics. 2003;19(2):185–193.
- Huang DW, Sherman BT, Lempicki RA. Systematic and integrative analysis of large gene lists using DAVID bioinformatics resources. Nat Protoc. 2009;4(1):44–57.
- Ashburner M, Ball CA, Blake JA, et al. Gene ontology: tool for the unification of biology. the gene ontology consortium. Nat Genet. 2000;25(1):25–29.
- Kanehisa M. Kyoto encyclopedia of genes and genomes. Nucleic Acids Res. 2000;28(1):27–30.
- Saavedra PHV, Huang L, Ghazavi F, et al. Apoptosis of intestinal epithelial cells restricts Clostridium difficile infection in a model of pseudomembranous colitis. Nat Commun. 2018;9(1):4846.
- Szklarczyk D, Gable AL, Lyon D, et al. STRING v11: protein-protein association networks with increased coverage, supporting functional discovery in genome-wide experimental datasets. Nucleic Acids Res. 2019;47(D1):607–613.
- Griffith M, Griffith OL, Coffman AC, et al. DGIdb: mining the druggable genome. Nat Methods. 2013;10(12):1209–1210.
- Cotto KC, Wagner AH, Feng YY, et al. DGIdb 3.0: a redesign and expansion of the drug-gene interaction database. Nucleic Acids Res. 2018;46(D1):D1068–D1073.
- Christakis NA, Fowler JH. The spread of obesity in a large social network over 32 years. N Engl J Med. 2007;357(4):370–379.
- Hossain P, Kawar B, El Nahas M. Obesity and diabetes in the developing world–a growing challenge. N Engl J Med. 2007;356(3):213–215.
- Ahfeldt T, Schinzel RT, Lee YK, et al. Programming human pluripotent stem cells into white and brown adipocytes. Nat Cell Biol. 2012;14(2):209–219.
- Harms M, Seale P. Brown and beige fat: development, function and therapeutic potential. Nat Med. 2013;19(10):1252–1263.
- Ebenegger V, Marques-Vidal P, Kriemler S, et al. Differences in aerobic fitness and lifestyle characteristics in pre-schoolers according to their weight status and sports club participation. Obes Facts. 2012;5(1):23–33.
- Lopes AL, Ap TF, De Souza Campos LG, et al. The effects of diet- and diet plus exercise-induced weight loss on basal metabolic rate and acylated ghrelin in grade 1 obese subjects. Diabetes Metab Syndr Obes. 2013;6:469–475.
- Ren J, Cheng Y, Ming ZH, et al. Intrauterine hyperglycemia exposure results in intergenerational inheritance via DNA methylation reprogramming on F1 PGCs. Epigenetics Chromatin. 2018;11(1):20.
- Resh MD. Fyn, a Src family tyrosine kinase. Int J Biochem Cell Biol. 1998;30(11):1159–1162.
- Bastie CC, Zong H, Xu J, et al. Integrative metabolic regulation of peripheral tissue fatty acid oxidation by the SRC kinase family member Fyn. Cell Metab. 2007;5(5):371–381.
- Mastick CC, Saltiel AR. Insulin-stimulated tyrosine phosphorylation of caveolin is specific for the differentiated adipocyte phenotype in 3T3-L1 cells. J Biol Chem. 1997;272(33):20706–20714.
- Yamada E, Pessin JE, Kurland IJ, et al. Fyn-dependent regulation of energy expenditure and body weight is mediated by tyrosine phosphorylation of LKB1. Cell Metab. 2010;11(2):113–124.
- Mkaddem SB, Murua A, Flament H, et al. Lyn and Fyn function as molecular switches that control immunoreceptors to direct homeostasis or inflammation. Nat Commun. 2017;8(1):246.
- Chen Z, Tao Q, Qiao B, et al. Silencing of LINC01116 suppresses the development of oral squamous cell carcinoma by up-regulating microRNA-136 to inhibit FN1. Cancer Manag Res. 2019;11:6043–6059.
- Berger E, Héraud S, Mojallal A, et al. Pathways commonly dysregulated in mouse and human obese adipose tissue: FAT/CD36 modulates differentiation and lipogenesis. Adipocyte. 2015;4(3):161–180.
- Yang S, Dai H, Hu W, et al. Association between circulating follistatin-like-1 and metabolic syndrome in middle-aged and old population: a cross-sectional study. Diabetes Metab Res Rev. 2020;37(2):e3373.
- Münzberg H, Morrison CD. Structure, production and signaling of leptin. Metab Clin Exp. 2015;64(1):13–23.
- Zhang F, Chen Y, Heiman M, et al. Leptin: structure, function and biology. Vitam Horm. 2005;71:345–372.
- Rehman K, Akash MSH, Alina Z. Leptin: a new therapeutic target for treatment of diabetes mellitus. J Cell Biochem. 2018;119(7):5016‐5027.
- Lo KA, Huang S, Walet ACE, et al. Adipocyte long-noncoding RNA transcriptome analysis of obese mice identified Lnc-Leptin, which regulates Leptin. Diabetes. 2018;67(6):1045–1056.
- Izquierdo AG, Crujeiras AB, Casanueva FF, et al. Leptin, obesity, and leptin resistance: where are we 25 years later? Nutrients. 2019;11(11):2704.
- Szyszka M, Paschke L, Tyczewska M, et al. Analysis of transcriptome, selected intracellular signaling pathways, proliferation and apoptosis of LNCaP cells exposed to high leptin concentrations. Int J Mol Sci. 2019;20(21):5412.
- Sun P, Zhang Y, Wei Z, et al. Effect of Qing’e Decoction on Leptin/Leptin receptor and bone metabolism in naturally Aging Rats. Evid Based Complement Alternat Med. 2020;2020:2532081.
- Weisgraber KH, Rall SC, Mahley RW. Human E apoprotein heterogeneity. Cysteine-arginine interchanges in the amino acid sequence of the apo-E isoforms. J Biol Chem. 1981;256(17):9077–9083.
- Wilkins HM, Wang X, Menta BW, et al. Bioenergetic and inflammatory systemic phenotypes in Alzheimer’s disease APOE ε4-carriers. Aging Cell. 2021;20(5):e13356.
- Gonzalez-Aldaco K, Roman S, Torres-Reyes LA, et al. Association of apolipoprotein e2 Allele with Insulin resistance and risk of type 2 diabetes mellitus among an admixed population of Mexico. Diabetes Metab Syndr Obes. 2020;13:3527–3534.
- Yang W, Lu J, Weng J, et al. Prevalence of diabetes among men and women in China. N Engl J Med. 2010;362(12):1090–1101.
- Mooyaart AL, Valk EJ, van Es LA, et al. Genetic associations in diabetic nephropathy: a meta-analysis. Diabetologia. 2011;54(3):544–553.
- Taylor F, Huffman MD, Macedo AF, et al. Statins for the primary prevention of cardiovascular disease. Cochrane Database Syst Rev. 2013; (1):CD004816. DOI:10.1002/14651858.CD004816.pub5.