
ABSTRACT
Obesity is a severe disease worldwide. Mitochondrial autophagy (mitophagy) may be related to metabolic abnormalities in obese individuals, but the mechanism is still unclear. We aimed to investigate whether nuclear receptors NR1D1 and ULK1 influence obesity by affecting mitophagy. In vitro model was established by inducing 3T3-L1 cells differentiation. MTT was detected cell viability. ELISA was tested triglyceride (TG). Oil red O staining was performed to detect lipid droplets. Flow cytometry was measured mtROS. ChIP and Dual-luciferase reporter assay were verified NR1D1 bind to ULK1. LC3 level was detected by IF. After differentiation medium treatment, cell viability was decreased, TG content and lipid droplets were increased Moreover, NR1D1 expression was reduced in Model group. NR1D1 overexpression was increased cell viability, reduced TG content and lipid droplets. Subsequently, NR1D1 inhibited TOM20 and mtROS, whereas, Parkin and PINK1 were accelerated. NR1D1 overexpression facilitated LC3 expression, whereas ULK1 knockdown was reversed the effect of NR1D1 overexpression. Liensinine also reversed the effect of NR1D1 overexpression, that is, cell viability was reduced, mtROS, TG content and lipid droplets were increased. The combination of nuclear receptor NR1D1 and ULK1 promoted mitophagy in adipocytes to alleviate obesity, which provided new target and strategy for obesity treatment.
Abbreviations: Mitochondrial autophagy (mitophagy), triglyceride (TG), Uncoordinated-51 like autophagy activating kinase 1 (ULK1), Nuclear receptor subfamily 1 group D member 1 (NR1D1), American Type Culture Collection (ATCC), fetal bovine serum (FBS), 3-isobutyl-1-methylxanthine (IBMX), dexamethasone (DEX), short hairpin RNA ULK1 (sh-ULK1), wild-type (WT), mutant (MUT), Enzyme-linked immunosorbent assay (ELISA), mitochondrial reactive oxygen species (mtROS), Chromatin immunoprecipitation (ChIP), Quantitative real-time PCR (qRT-PCR), Immunofluorescence (IF), standard deviation (SD).
Introduction
Obesity is a severe disease worldwide, resulting from energy imbalance caused by the increase in the ratio of calorie intake and energy consumption, and is closely related to dyslipidemia [Citation1,Citation2]. Long-term excessive consumption of foods, those are high in sugar, calories and fat could promote the differentiation of adipocytes. Accumulation of lipids will lead to obesity, which will lead to functional changes of various organs, such as endocrine disorders, substance metabolism disorders, etc., and is related to the development of type 2 diabetes, cancer and heart failure [Citation3,Citation4]. Treatment of obesity depends on lifestyle changes. Bariatric drugs and bariatric surgery are additional tools to achieve weight loss, but they bring many harms to the body [Citation5]. Therefore, understanding the molecular mechanisms of obesity development is crucial, as this may lead to anti-obesity targets and early obesity biomarkers.
Mitochondrial autophagy (mitophagy) is a core cell viability, which refers to the process of cells selectively removing excess or damaging mitochondria through the mechanism of autophagy [Citation6,Citation7]. It is a cellular repair process and an essential aspect of maintaining mitochondrial health, related to metabolic abnormalities in obese individuals [Citation8]. It has been reported that a long-term high-fat diet causes lipid accumulation, which inhibits mitophagy and aggravates mitochondrial damage. Inhibition of mitophagy could exacerbate obesity and triglyceride (TG) accumulation in mice induced by high fat [Citation9]. Shao D. et al. showed that targeting Parkin-dependent mitophagy could effectively combat the development of obesity-induced cardiomyopathy [Citation10]. Wang SH, et al. also showed that during obesity, lncRNA H19 regulates mitophagy through Pink1/Parkin signal pathway and resumes cardiac mitochondrial respiration [Citation11]. The above studies have proved that mitophagy plays an essential role in obesity disease, inhibition or activation of mitophagy or a new way to treat obesity.
Uncoordinated-51-like autophagy activating kinase 1 (ULK1) is an unc-51-like kinase 1 in adipocytes. The ULK1 complex initiates the formation of autophagosomes, linking cellular trophic status to downstream events of autophagy [Citation12]. It has been reported that loss of ULK1 in skeletal muscle could inhibit mitophagy [Citation13]. In obesity-associated cardiomyopathy, cardiac autophagy decreased significantly with decreased levels of ULK1 protein. ULK1 prevents cardiac dysfunction in obese patients through autophagy-mediated regulation of lipid metabolism [Citation14]. In mature adipocytes, it has been reported that overexpression of SIRT3 activates mitophagy of lipid droplets by activating ULK1, resulting in smaller lipid droplets and decreased lipid accumulation [Citation15]. Nuclear receptor subfamily 1 group D member 1 (NR1D1) is a member of the 1D group of the Nuclear receptor subfamily and a steroid hormone-related receptor involved in the regulation of steroid metabolism in adipocytes. Obesity has been reported to inhibit NR1D1 expression [Citation16]. NR1D1 has also been proposed as a drug target for the treatment of obesity [Citation17]. It was reported that NR1D1 binds to the ULK1 promoter and upregulates ULK1 expression to promote autophagy [Citation18]. However, the combination of NR1D1 and ULK1 to activate mitophagy has rarely been reported in obesity diseases.
Therefore, in this study, we attempted to explore that whether the nuclear receptor NR1D1 promotes ULK1 expression through binding to ULK1 promoter and thus mediates mitochondrial autophagy, so as to achieve the purpose of alleviating obesity. This research could improve the understanding of the pathogenesis of obesity and provide new targets and strategies for the treatment of obesity.
Results
NR1D1 expression was decreased in adipocytes
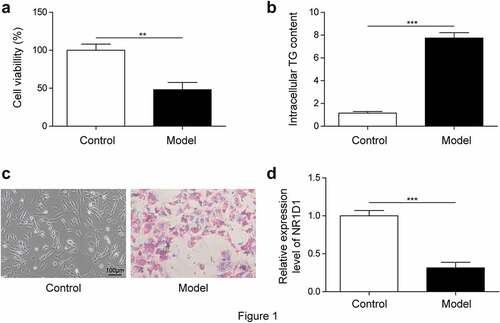
First, we constructed a cell model of obesity and detected cell viability with MTT assay. Results showed that cell viability was decreased in the Model group compared with the Control group ()). ELISA detection of TG content showed that compared with the Control group, TG content was significantly increased in the Model group ()). In addition, the oil red O staining results showed that compared with the Control group, the lipid droplets in the Model group were significantly increased ()). These results showed that the model construction was successful. Next, we examined NR1D1 expression. As shown in ), in 3T3-L1 cells, NR1D1 expression was significantly downregulated in the Model group compared with the Control group.
Figure 1. NR1D1 expression was decreased in adipocytes. a. Cell viability was detected by MTT. b. ELISA was used to detect TG. c. Detection of lipid droplets by oil red O staining. NR1D1. d. qRT-PCR detected NR1D1 expression. ** P < 0.01, *** P < 0.001.
Overexpression of NR1D1 reduced lipid droplets
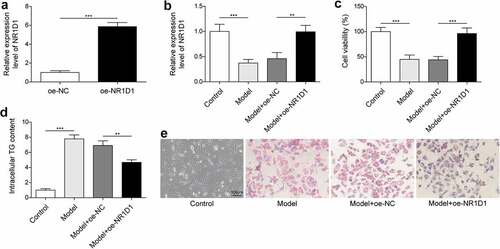
We already know that the NR1D1 expression was significantly reduced in the Model group. Therefore, to explore the effect of NR1D1 on lipid droplets, we overexpressed NR1D1. In 3T3-L1 cells, overexpression of NR1D1 significantly promoted NR1D1 expression was higher than that in the oe-NC group (>5.8-flod, )). Compared with the Control group, NR1D1 expression was significantly downregulated in the Model group, and upregulated in the Model + oe-NR1D1 group ()). Cell viability was detected by MTT assay. Results showed that cell viability was decreased in the Model group compared with the Control group, while cell viability was increased by overexpression of NR1D1 ()). ELISA detection of TG content showed that compared with the Control group, the content of TG was significantly increased in the Model group. In contrast, the overexpression of NR1D1 could reduce the content of TG ()). In addition, the results of oil red O staining showed that compared with the Control group, lipid droplets were significantly increased in the Model group, while overexpression of NR1D1 decreased lipid droplets ()). These results suggested that overexpression of NR1D1 reduced lipid droplets.
Figure 2. Overexpression of NR1D1 reduced lipid droplets. a-b. qRT-PCR measured NR1D1 expression. c. Cell viability was detected by MTT. d. ELISA was used to detect TG. e. Oil-red O staining detected lipid droplets. ** P < 0.01, *** P < 0.001.
NR1D1 bound to the priming region of ULK1
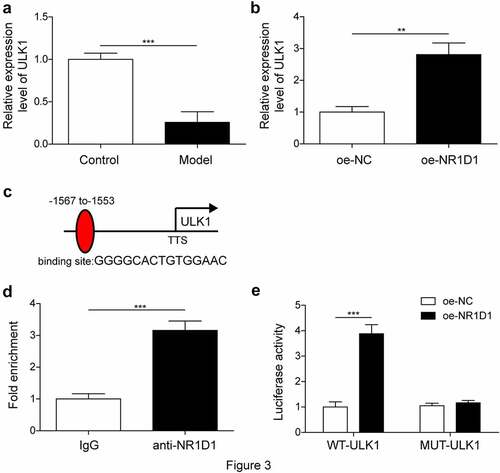
It has been reported that NR1D1 could bind to the ULK1 promoter [Citation18]. Therefore, we wanted to confirm the relationship between NR1D1 and ULK1 in obesity diseases. First, the expression of ULK1 was detected by qRT-PCR. Compared with the Control group, ULK1 expression was significantly decreased in the Model group, and ULK1 expression was increased in the Model + oe-NR1D1 group compared with the oe-NC group ()). The results of ChIP experiment showed that the binding of ULK1 was very seldom in the IgG group, while the binding of ULK1 was high level in the anti-NR1D1 group, indicating that NR1D1 could bind to ULK1 ()). Dual-luciferase reporter assay showed that overexpression of ULK1 promoted luciferase activity of WT-NR1D1, but had no effect on luciferase activity of MUT-NR1D1 ()). These results indicated that NR1D1 bound to the priming region of ULK1
Figure 3. NR1D1 bound to the priming region of ULK1. a-b. qRT-PCR measured ULK1 expression. c. ChIP confirmed that NR1D1 could bind to ULK1. d. Dual-luciferase reporter assay verified the binding of NR1D1 to ULK1. ** P < 0.01, *** P < 0.001.
NR1D1 upregulated ULK1 to activate mitophagy and reduce lipid droplets
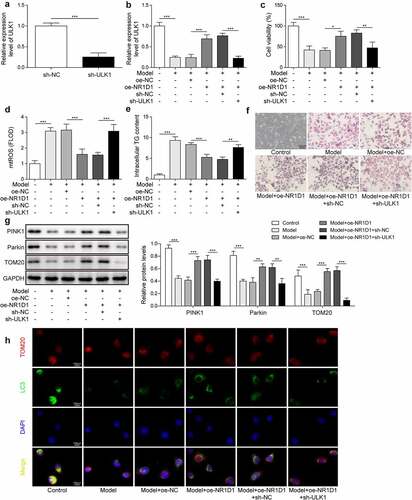
Studies have shown that the upregulation of ULK1 expression could promote autophagy [Citation18], while the combination of NR1D1 and ULK1 to activate mitophagy signal has rarely been reported in obesity diseases. Therefore, we will study the role of NR1D1 combined with ULK1 in obesity disease. First, we knocked down the expression of ULK1. Compared with the sh-NC group, ULK1 expression in the sh-ULK1 group was significantly decreased, indicating successful knockdown ()). Furthermore, compared with the Control group, ULK1 expression was lessened in the Model group. ULK1 expression was raised after overexpression of NR1D1. When ULK1 was knocked down, the effect of overexpressed NR1D1 was reversed, and ULK1 expression was reduced ()). Compared with the Control group, the cell viability in the Model group was decreased, the content of mtROS, TG content and lipid droplets were increased. After the overexpression of NR1D1, the cell viability was increased, the content of mtROS, TG and lipid droplets were decreased. However, knockdown of ULK1 reversed the effect of overexpression of NR1D1, decreased cell viability, increased mtROS, TG content, and of lipid droplets ()). Finally, we detected the expression of Parkin, PINK1 and TOM20, which are the mitophagy-related proteins. As shown in ), compared with the Control group, Parkin and PINK1 expression in the Model group were depressed, while TOM20 expression was increased. After the overexpression of NR1D1, the expression of Parkin and PINK1 were upregulated, while TOM20 expression was depressed. When ULK1 was knocked down, the effect of overexpressed NR1D1 was reversed, that is, Parkin and PINK1 expression were downregulated, while TOM20 expression was elevated. Then we verified the level of mitophagy by IF staining of LC3 and TOM20. As shown in ), LC3 expression in the Model group was significantly decreased and overexpression of NR1D1-induced LC3 expression; however, the appearance was reversed by ULK1 knockdown. These results indicated that NR1D1 upregulated ULK1 to activate mitophagy and thereby reduce lipid droplets.
Figure 4. NR1D1 upregulated ULK1 to activate mitophagy and reduce lipid droplets. a-b. qRT-PCR measured ULK1 expression. c. MTT assay detected cell viability. d. Detection of mtROS. e. TG content was detected by ELISA. f. Detection of lipid droplets by oil red O staining. g. Western blot measured Parkin, PINK1 and TOM20 expression. H. Immunofluorescence staining for LC3.* P < 0.05, ** P < 0.01, *** P < 0.001.
Upregulation of NR1D1 promoted mitophagy and reduced lipid droplets
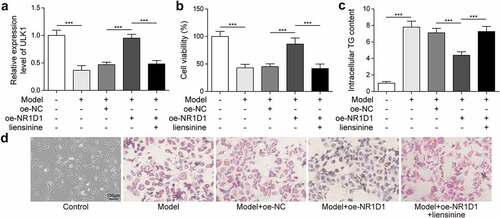
To further study the role of mitophagy in lipid droplets, we added liensinine, a mitophagy inhibitor, which was grouped as Control, Model, Model + oe-NC, Model + oe-NR1D1, Model + oe-NR1D1 + liensinine group. Compared with the Control group, ULK1 expression was diminished in the Model group, and ULK1 expression was accelerated after the overexpression of NR1D1. However, after liensinine treatment, the effect of overexpression of NR1D1 was reversed, and ULK1 expression was downregulated ()). Compared with the Control group, the cell viability in the Model group was decreased, the TG content and lipid droplets were increased. After the overexpression of NR1D1, the cell viability was increased, the TG content and lipid droplets were decreased. However, with the liensinine treatment that reversed the effect of overexpression of NR1D1, reduced cell viability, increased TG content, and lipid droplets ()). These results demonstrated that NR1D1 upregulation promoted mitophagy and thereby reduced lipid.
Figure 5. Upregulation of NR1D1 promoted mitophagy and reduced lipid droplets. a. qRT-PCR measured ULK1 expression. b. Cell viability was detected by MTT. c. ELISA was used to detect TG. d. Oil-red O staining detected lipid droplets. *** P < 0.001.
Discussion
Despite advances in the medical community, obesity remains a significant health hazard worldwide, accounting for 2.8 million adult deaths per year [Citation19]. Most chronic diseases, such as diabetes, high blood pressure, heart disease, are largely related to obesity, a major global health care problem. With the worldwide epidemic of obesity, it is crucial to understand the mechanisms that lead to adipose tissue dysfunction. NR1D1 could bind to the ULK1 promoter and upregulate ULK1 expression to promote autophagy [Citation18]. But whether nuclear receptors NR1D1 and ULK1 affect obesity by affecting autophagy remains unclear. Therefore, we constructed a cell model of obesity in vitro in this study. We found that the combination of nuclear receptor NR1D1 and ULK1 promotes mitophagy in adipocytes and thus ameliorates obesity.
Autophagy is a highly conserved eukaryotic cell recycling process, and the dysfunction of this process leads to the pathogenesis of many diseases [Citation20]. Mitophagy is a process of selective mitochondrial degradation, which plays an important role in maintaining mitochondrial quality control and homoeostasis [Citation21]. It has been reported that mitophagy could promote mitochondrial fatty acid oxidation, inhibit fatty acid accumulation in liver, and improve liver insulin resistance [Citation22]. In obesity diseases, oxidative damage, reduced mitochondrial content, reduced oxidative phosphorylation rate and excessive reactive oxygen species (ROS) production have also been reported [Citation23]. Autophagy and mitophagy play a vital role in the process from beige to white fat [Citation24]. Mitophagy is different from general autophagy in regulating adipose tissue and whole-body energy metabolism. In recent studies, autophagy is overactive in white adipose tissue in obese and diabetic patients, and inhibition of fat autophagy by targeted deletion of mouse autophagy genes improves anti-obesity phenotypes in mice [Citation25]. Mitophagy deficiency will increase NLRP3 to induce brown fat dysfunction in mice [Citation26]. Therefore, inhibition or activation of mitophagy may be a new way to treat obesity.
A critical initial event in autophagy is the formation of autophagosomes, which is mediated by ULK1 [Citation27]. It was reported that ULK1 could translocate to mitochondria and phosphorylate FUNDC1 to regulate mitophagy [Citation28]. MAPK1/3 kinase-dependent ULK1 degradation attenuated mitophagy [Citation29]. Moreover, antioxidant therapy induced elevated ROS levels to activate ULK1 pathway to promote protective autophagy and ULK1-dependent mitophagy [Citation30]. However, how the ULK1 complex is regulated to trigger mitophagy induction is not clear. In this study, our results revealed that a targeting relationship between NR1D1 and ULK1, NR1D1 upregulation of ULK1 activates mitophagy to reduce lipid.
NR1D1 is a crucial regulator of clock output in metabolic tissues such as liver and brown adipose tissue [Citation31]. NR1D1 has been shown to regulate adipogenesis and lipid metabolism and link the circadian rhythm system to systemic metabolic homoeostasis [Citation32]. It was found that light exposure affects lipid and lipid composition, possibly due to increased period 2 expression, which in turn enhances gene expression regulated by NR1D1 [Citation33]. In addition, NR1D1 regulates pancreatic β-cell function through the regulation of leptin and a high-fat diet [Citation34]. In this study, we overexpressed NR1D1 with pcDNA3.1-NR1D1 and transfected this plasmid into 3T3-L1 cells. We found that the expression of NR1D1 was upregulated by nearly 5.8 times in the oe-NR1D1 group than in the oe-NC group. Therefore, we successfully transfected 3T3-L1 cells with NR1D1 overexpression vector. According to the previous study, CETP gene was only expressed in 3T3-L1 cells transfected with pcDNA3.1-CETP compared with the control or non-transfected vector [Citation35]. And studies have shown that the pcDNA3.1-LI2 plasmids were transfected into 3T3-L1 cells, the expression of LI2 was 4 times [Citation36]. Furthermore, we found that increased triglycerides and decreased NR1D1 expression in an in vitro model of adipogenesis in mouse precursor adipocytes (3T3-L1 cells). NR1D1 upregulation promotes mitophagy to reduce lipid.
Taken together, our findings illuminated that the nuclear receptor NR1D1 binds to ULK1 to promote adipocyte mitophagy, thereby ameliorating obesity. Our study provided a theoretical basis for the pathogenesis of obesity and offered new targets and strategies for treating obesity.
Methods
Cell culture and treatment
Mouse 3T3-L1 pre-adipocytes were purchased from American Type Culture Collection (ATCC Virginia, USA) and cultured with DMEM containing 10% foetal bovine serum (FBS) at 37°C and 5% CO2. Mouse 3T3-L1 pre-adipocytes were cultured in 10% FBS, 0.5 mmol/L 3-isobutyl-1- methylxanthine (IBMX, HY-12318, MedChemExpress, New Jersey, USA), 1 mmol/L dexamethasone (DEX, HY-14648, MedChemExpress) and 5 mg/mL insulin differentiation medium to induce differentiation of 3T3-L1 pre-adipocytes. After two days, the differentiation medium was replaced with a maintenance medium containing 10% FBS, 5 mg/mL insulin and DMEM, grouped into the Control and Model groups. To investigate the role of mitophagy in lipid droplets, we added mitophagy inhibitor liensinine (HY-N0484, MedchemExpress).
Cell transfection
To investigate the effect of NR1D1 on lipid droplets, we overexpressed NR1D1 (oe-NR1D1). The NR1D1 sequence was linked to the pcDNA3.1 vector. To further investigate the role of NR1D1 combined with ULK1 in obesity disease, Oe-NR1D1, short hairpin RNA ULK1 (sh-ULK1) and their negative control(oe-NC, sh-NC) were synthesized from Sangon Biotech (Shanghai, China). According to the instructions, the sh-RNA sequence and the recombinant vector were transfected into the cells (Cells were seeded in 6-well plates at 2 × 10⁵/well, and the cells were 80% confluent for transfection) using a Lipofectamine 3000 reagent (Thermo Fishier Scientific, USA). After transfection for 48 h, cells were used for subsequent detection.
MTT assay
MTT assay was used to evaluate the cell viability. The cells in the logarithmic growth phase were digested and counted. The cells were seeded into 96-well plates at the density of 1 × 10⁴ cells/well, 100 μL per well. Then 10 μL MTT (5 mg/mL) were added to each well and the cells were incubated at 37°C and 5% CO2 for 4 h. Then take out the 96-well plates and suck off the medium containing MTT. We added 150 μL DMSO to each well. After shaking slowly at room temperature for 10 min, absorbance (OD) values at 490 nm were analysed by Bio-Tek microplate analyser (MB-530, Heales, China).
Chromatin immunoprecipitation (ChIP)
According to the instructions of the ChIP kit (Milipore, Temecula, CA), we verified whether NR1D1 has a targeting relationship with ULK1. The groups were: IgG and anti-NR1D1. The cells were fixed with 1% formalin for 10 min, and then the DNA was randomly fragmented to 200–800 bp by ultrasound. The DNA was immunoprecipitated with a specific antibody to the target protein of ULK1. Finally, 100 μL H2O was used for purification and elution of ChIP DNA, and 2.5 μL ChIP DNA was used for qRT-PCR detection. Different primers were used to detect the enrichment of ULK1 gene promoter. The primer sequences are as follows:
ULK1: F:5’ GGTGTGGTGCAATCTTTCTCTCT3’; R:5’ GGAAGGGGACAAGAGGTCTCC3’
Dual-luciferase reporter assay
The NR1D1-binding site in the promotor of ULK1 identified using JASPAR database. The wild-type (WT) ULK1 (GGGGCACTGTGGAAC) or mutant (MUT) ULK1(GGGGCAAAAAAGA AC) were constructed and inserted into pGL3-Basic vectors (Promega, Wisconsin, USA) and then co-transfected with NR1D1 expression plasmid into 293 T cells. According to the instructions, the recombinant vector was transfected into the cells using a Lipofectamine 3000 reagent (Thermo Fishier Scientific, USA). Both oe-NC and oe-NR1D1 were transferred into the cells simultaneously. Finally, the Dual luciferase reporter assay (Promega) was used to measure luciferase activity.
Enzyme-linked immunosorbent assay (ELISA)
The levels of TG content were measured in cells. According to the instructions, TG concentration was determined by a quantitative ELISA kit (#A110-2-1, Nanjing Jiancheng Bioengineering Institute, China). Specifically, the sample was first processed, and the protein concentration was measured according to the BCA protein assay kit. The blank tube, standard tube and sample tube were set. 10 μL distilled water was added to the blank tube, 10 μL calibrator was added to the standard tube, and 10 μL sample was added to the sample tube. 1000 μL of working solution was added to each of the three tubes, mixed, and incubated at 37°C for 10 min. The absorbance value of each tube was determined at a wavelength of 510 nm.
Oil-red O staining
Oil-red O staining was used to detect lipid droplets. Remove the slipper and wash it with PBS 2 ~ 3 times; The slices were fixed with 4% paraformaldehyde for 30 min; Rinse with PBS for 5 min × 3 times; Each sample was added 100 μL of oil-red O solution, and incubated at room temperature for 20 min. After the solution was dropped, 70% alcohol was differentiated to clear particles, and distilled water was added to stop the differentiation. Dyed with haematoxylin for 1–3 min, washed with distilled water, and returned to blue with PBS. The tablets were sealed with buffered glycerine and observed under a microscope.
Detection of mitochondrial reactive oxygen species (mtROS)
To detect the production of mtROS, as recommended by the manufacturer, cells were stained with 5 µM MitoSox™ Red mitochondrial superoxide indicator (#M36008, Life Technologies Corporation, California, USA). Fluorescence intensity of MitoSox™ red was measured at 580 nm using FACS Calibur flow cytometry (Becton Dickinson, Franklin Lake, NJ, USA) and FlowJo software (Treestar, Ashland, OR, USA).
Quantitative real-time PCR (qRT-PCR)
The expressions of NR1D1 and ULK1 were detected by qRT-PCR PCR. To put it simply, total RNA was extracted by Trizol method. The concentration and purity (OD260/OD280) of RNA were determined by Ultraviolet-visible Spectrophotometer (NP80, NanoPhotometer, Germany). cDNA reverse transcription kit (#4,368,814, ThermoFisher Scientific™, USA) was used to reverse transcription RNA into cDNAs. Power SYBR™ Green RNA-to-CT ™1-Step kit (Applied Biosystems™, USA) was used to test the relative expression of the genes on the ABI 7900 system. β-actin was used as the reference gene, and the relative gene level was calculated by 2−ΔΔCT method. Primer sequences used in this study are as follows:
NR1D1-F: 5ʹGCTTCCGTGACCTTTCTCAG 3’,
R: 5’ CAGCTCCTCCTCGGTAAGTG 3’;
ULK1-F: 5’ GTGCACAATTACCAGCGCAT 3’,
R: 5’ GAGAAGGTGTGTAGGGACGG 3’;
β- actin- F: 5ʹTGGCACCACACCTTCTACAA 3’,
R: 5ʹCCAGAGGCGTACAGGGATAG 3’.
Western blot (WB) analysis
According to the instructions, total proteins were extracted from cells and tissues using RIPA lysis buffer (#P0013B, Beyotime Biotechnology), and protein quantification was performed on each group of samples according to the BCA protein assay kit. Loading Buffer (MA0003-D, Meilunbio) was mixed with SDS-PAGE loading buffer. The mixture was heated in a boiling water bath at 100°C for 5 min. Proteins were adsorbed on the PVDF membrane through gel electrophoresis. The samples were sealed with 5% skim milk solution at room temperature for 90 min, and washed with PBST for 3 times, 15 min each time. The primary antibody was incubated at 4°C overnight. The primary antibodies used included Parkin (ab77924, 1:2000, Abcam, Cambridge, UK), PINK1 (ab23707, 1:1000, Abcam), TOM20 (ab186735, 1: 1000, Abcam) and GAPDH (60,004-1-Ig, 1:20,000, Proteintech, Chicago, USA). HRP-labelled HRP Goat Anti-Mouse IgG (SA00001-1, 1:10,000, Proteintech) were inculcated at room temperature for 90 mins. The protein bands were detected by the Odyssey Infrared Imaging System (Li-Cor Biosciences, Lincoln, NE, USA) and GAPDH was used as the internal reference to detect the expression level.
Immunofluorescence (IF)
The 3T3-L1 cells were cultured in 24-well plates. After incubationthe cells were fixed with 4% paraformaldehyde for 30 min. The slides were permeabilized with 0.5% TritonX-100 at 37°C for 30 min to permeabilize the cell membrane and then washed with PBS for 10 min. Whereafter, the cells were blocked with 5% BSA at 37°C for 1 h, and incubated with primary antibody anti-TOM20 (1: 200, 11,802-1-AP, Proteintech) and anti-LC3 (1: 400, L7543, Sigma-Aldrich, Missouri, USA) overnight at 4°C. Diluted fluorescent secondary antibody Goat Anti-Mouse IgG H&L (Alexa Fluor® 594) preadsorbed (1:200, ab150120, Aabcam) and Goat Anti-Rabbit IgG H&L (Alexa Fluor® 488) (1: 400, ab150077, Abcam) was added and incubated at 37°C for 90 min. Nuclear staining was performed at 37°C in DAPI working solution for 10 min. The cells were sealed with buffered glycerine and observed under fluorescence microscope.
Statistical analysis
Statistical analysis was performed using GraphPad 8.0, and the data of three independent experiments were expressed as mean ± standard deviation (SD). T-test was used for data comparison between the two groups, and one-way ANOVA was used for data comparison between multiple groups. P < 0.05 was considered statistically significant.
Author contributions
BY: Conceptualization; Writing-original draft; Methodology; Formal analysis;
JBP: Supervision; Validation; Data curation; Resources;
FYY: Funding acquisition; Investigation; Project administration; Writing-review & editing.
All authors have read and approved the final version of this manuscript to be published.
Consent to Publish Statement
Not Applicable. This article does not contain any studies with human participants performed by any of the authors.
Declarations and ethics statements
Ethical approval
Not Applicable. This article does not contain any studies with human participants or animals performed by any of the authors.
Informed Consent from Participants
Not Applicable. This article does not contain any studies with human participants performed by any of the authors.
Acknowledgments
We would like to give our sincere gratitude to the reviewers for their constructive comments.
Disclosure statement
No potential conflict of interest was reported by the author(s).
Data Availability Statement for Publicly Available Data Sharing Policy
All data generated or analyzed during this study are included in this article. The datasets used and/or analyzed during the current study are available from the corresponding author on reasonable request.
Additional information
Funding
References
- Vekic J, Zeljkovic A, Stefanovic A, et al. Obesity and dyslipidemia. Metabolism. 2019;92:71–81. Epub 2018/11/18. PubMed PMID: 30447223.
- Shin S, Yoon M.Medicines for the treatment of obesity.Int J Mol Sci.2021;22(8):3866. Epub 2021/05/01. PubMed PMID: 33917992; PubMed Central PMCID: PMCPMC8068318.
- Nikolic I, Leiva M, Sabio G.The role of stress kinases in metabolic disease.Nat Rev Endocrinol.2020;16(12):697–716. Epub 2020/10/18. PubMed PMID: 33067545.
- Kiseleva OI, Arzumanian VA, Poverennaya EV, et al. Does proteomic mirror reflect clinical characteristics of obesity? J Pers Med. 2021;11(2):64. Epub 2021/01/27. PubMed PMID: 33494491; PubMed Central PMCID: PMCPMC7912072.
- Tchang BG, Saunders KH, Igel LI.Best practices in the management of overweight and obesity.Med Clin North Am.2021;105(1):149–174. Epub 2020/11/29. PubMed PMID: 33246516.
- Yamashita SI, Kanki T.How autophagy eats large mitochondria: autophagosome formation coupled with mitochondrial fragmentation.Autophagy.2017;13(5):980–981. Epub 2017/05/20. PubMed PMID: 28521613; PubMed Central PMCID: PMCPMC5446078.
- Wu H, Wang Y, Li W, et al. Deficiency of mitophagy receptor FUNDC1 impairs mitochondrial quality and aggravates dietary-induced obesity and metabolic syndrome. Autophagy. 2019;15(11):1882–1898. Epub 2019/03/23. PubMed PMID: 30898010; PubMed Central PMCID: PMCPMC6844496.
- Bhansali S, Bhansali A, Dhawan V.Favourable metabolic profile sustains mitophagy and prevents metabolic abnormalities in metabolically healthy obese individuals.Diabetol Metab Syndr.2017;9(1):99. Epub 2017/12/20. PubMed PMID: 29255491; PubMed Central PMCID: PMCPMC5728047.
- Fu T, Xu Z, Liu L, et al. Mitophagy directs muscle-adipose crosstalk to alleviate dietary obesity. Cell Rep. 2018;23(5):1357–1372. Epub 2018/05/03. PubMed PMID: 29719250.
- Shao D, Kolwicz SC Jr., Wang P, et al. Increasing fatty acid oxidation prevents high-fat diet-induced cardiomyopathy through regulating parkin-mediated mitophagy. Circulation. 2020;142(10):983–997. Epub 2020/07/01. PubMed PMID: 32597196; PubMed Central PMCID: PMCPMC7484440.
- Wang SH, Zhu XL, Wang F, et al. LncRNA H19 governs mitophagy and restores mitochondrial respiration in the heart through Pink1/Parkin signaling during obesity. Cell Death Dis. 2021;12(6):557. Epub 2021/05/30. PubMed PMID: 34050133; PubMed Central PMCID: PMCPMC8163878.
- Lin MG, Hurley JH.Structure and function of the ULK1 complex in autophagy. Curr Opin Cell Biol. 2016;39:61–68. Epub 2016/02/28. PubMed PMID: 26921696; PubMed Central PMCID: PMCPMC4828305.
- Laker RC, Drake JC, Wilson RJ, et al. Ampk phosphorylation of Ulk1 is required for targeting of mitochondria to lysosomes in exercise-induced mitophagy. Nat Commun. 2017;8(1):548. Epub 2017/09/17. PubMed PMID: 28916822; PubMed Central PMCID: PMCPMC5601463.
- An M, Ryu DR, Won Park J, et al. ULK1 prevents cardiac dysfunction in obesity through autophagy-meditated regulation of lipid metabolism. Cardiovasc Res. 2017;113(10):1137–1147. Epub 2017/04/22. PubMed PMID: 28430962.
- Zhang T, Liu J, Tong Q, et al. SIRT3 acts as a positive autophagy regulator to promote lipid mobilization in adipocytes via activating AMPK. Int J Mol Sci. 2020;21(2). Epub 2020/01/16. PubMed PMID: 31936019; PubMed Central PMCID: PMCPMC7013837.
- Crew RC, Waddell BJ, Mark PJ.Obesity-induced changes in hepatic and placental clock gene networks in rat pregnancy.Biol Reprod. 2018;98(1):75–88. Epub 2017/12/01. PubMed PMID: 29186286.
- Wang S, Li F, Lin Y, et al.Targeting REV-ERBα for therapeutic purposes: promises and challenges.Theranostics.2020;10(9):4168–4182. Epub 2020/04/01. PubMed PMID: 32226546; PubMed Central PMCID: PMCPMC7086371.
- Ferder IC, Fung L, Ohguchi Y, et al. Meiotic gatekeeper STRA8 suppresses autophagy by repressing Nr1d1 expression during spermatogenesis in mice. PLoS Genet. 2019;15(5):e1008084. Epub 2019/05/07. PubMed PMID: 31059511; PubMed Central PMCID: PMCPMC6502318.
- Masood W, Annamaraju P, Uppaluri KR. Ketogenic Diet. StatPearls. Treasure Island (FL): StatPearls Publishing Copyright © 2021, StatPearls Publishing LLC; 2021.
- Parzych KR, Klionsky DJ.An overview of autophagy: morphology, mechanism, and regulation.Antioxid Redox Signal.2014;20(3):460–473. Epub 2013/06/04. PubMed PMID: 23725295; PubMed Central PMCID: PMCPMC3894687.
- Um JH, Yun J.Emerging role of mitophagy in human diseases and physiology.BMB Rep.2017;50(6):299–307. Epub 2017/04/04. PubMed PMID: 28366191; PubMed Central PMCID: PMCPMC5498140.
- Su Z, Nie Y, Huang X, et al. Mitophagy in hepatic insulin resistance: therapeutic potential and concerns. Front Pharmacol. 2019;10:1193. Epub 2019/10/28. PubMed PMID: 31649547; PubMed Central PMCID: PMCPMC6795753.
- Wada J, Nakatsuka A.Mitochondrial dynamics and mitochondrial dysfunction in diabetes. Acta Med Okayama. 2016;70(3):151–158. Epub 2016/06/25. PubMed PMID: 27339203.
- Ferhat M, Funai K, Boudina S.Autophagy in adipose tissue physiology and pathophysiology.Antioxid Redox Signal.2019;31(6):487–501. Epub 2018/09/21. PubMed PMID: 30234364; PubMed Central PMCID: PMCPMC6653805.
- Ro SH, Jang Y, Bae J, et al. Autophagy in adipocyte browning: emerging drug target for intervention in obesity. Front Physiol. 2019;10:22. Epub 2019/02/13. PubMed PMID: 30745879; PubMed Central PMCID: PMCPMC6360992.
- Ko MS, Yun JY, Baek IJ, et al. Mitophagy deficiency increases NLRP3 to induce brown fat dysfunction in mice. Autophagy. 2021;17(5):1205–1221. Epub 2020/05/14. PubMed PMID: 32400277; PubMed Central PMCID: PMCPMC8143238.
- Zachari M, Ganley IG, Lane JD.The mammalian ULK1 complex and autophagy initiation.Essays Biochem.2017;61(6):585–596. Epub 2017/12/14. PubMed PMID: 29233870; PubMed Central PMCID: PMCPMC5869855.
- Wu W, Tian W, Hu Z, et al. ULK1 translocates to mitochondria and phosphorylates FUNDC1 to regulate mitophagy. EMBO Rep. 2014;15(5):566–575. Epub 2014/03/29. PubMed PMID: 24671035; PubMed Central PMCID: PMCPMC4210082.
- Deng R, Zhang HL, Huang JH, et al. MAPK1/3 kinase-dependent ULK1 degradation attenuates mitophagy and promotes breast cancer bone metastasis. Autophagy. 2020;16(1):1–19. Epub 2020/11/21. PubMed PMID: 33213267.
- Chen Y, Xie X, Wang C, et al. Dual targeting of NUAK1 and ULK1 using the multitargeted inhibitor MRT68921 exerts potent antitumor activities. Cell Death Dis. 2020;11(8):712. Epub 2020/09/03. PubMed PMID: 32873786; PubMed Central PMCID: PMCPMC7463258.
- Everett LJ, Lazar MA.Nuclear receptor Rev-erbα: up, down, and all around.Trends Endocrinol Metab. 2014;25(11):586–592. Epub 2014/07/30. PubMed PMID: 25066191; PubMed Central PMCID: PMCPMC4252361.
- Goumidi L, Grechez A, Dumont J, et al. Impact of REV-ERB alpha gene polymorphisms on obesity phenotypes in adult and adolescent samples. Int J Obes (Lond). 2013;37(5):666–672. Epub 2012/07/26. PubMed PMID: 22828941.
- Kopp R, Billecke N, Legradi J, et al.Bringing obesity to light: rev-erbα, a central player in light-induced adipogenesis in the zebrafish?Int J Obes (Lond).2016;40(5):824–832. Epub 2015/11/27. PubMed PMID: 26607039.
- Vieira E, Marroquí L, Batista TM, et al. The clock gene Rev-erb α regulates pancreatic β-cell function: modulation by leptin and high-fat diet. Endocrinology. 2012;153(2):592–601. Epub 2011/12/15. PubMed PMID: 22166979.
- Ju X, Cui Q, Zhang M, et al. Human cholesteryl ester transfer protein enhances insulin-mediated glucose uptake in adipocytes. Life Sci. 2011;89(13–14):479–484. Epub 2011/08/06. PubMed PMID: 21816162.
- Ma X, Ding W, Wang J, et al. LOC66273 isoform 2, a novel protein highly expressed in white adipose tissue, induces adipogenesis in 3T3-L1 cells. J Nutr. 2012;142(3):448–455. Epub 2012/01/27. PubMed PMID: 22279136.