
ABSTRACT
Adipose-derived stem cells (ADSCs) represent an ideal stem cell population for regenerative medicine. ADSC adipogenic differentiation is controlled by the activation of a specific transcriptional program, including epigenetic factors and key adipogenic genes. Under certain conditioned media, ADSCs can differentiate into several phenotypes. We previously demonstrated that bioactive molecules could counteract lipid accumulation and regulate adipogenesis, acting on inflammation and vitamin D metabolism. In the present paper, we aimed at evaluating the effect of metformin and vitamin D in targeting ADSC differentiation towards an intermediate phenotype, as beige adipocytes. We exposed ADSCs to different conditioned media and then we evaluated the levels of expression of main markers of adipogenesis, aP2, LPL and ACOT2. We also analysed the gene and protein expression of thermogenic UCP1 protein, and the expression of PARP1 and the beige specific marker TMEM26. Our results showed a novel effect of metformin and vitamin D not only in inhibiting adipogenesis, but also in inducing a specific ‘brown-like’ phenotype. These findings pave the way for their possible application in the control of de novo lipogenesis useful for the prevention of obesity and its related metabolic disorders.
Introduction
Adipose-derived stem cells (ADSCs) represent a promising source of mesenchymal stem cells (MSCs) for tissue repair and regeneration [Citation1]. ADSCs show high plasticity and immunomodulatory properties, being able to differentiate into several phenotypes, thus representing an excellent candidate in regenerative medicine approaches [Citation2–4]. ADSC adipogenic differentiation is controlled by the activation of a specific transcriptional program, involving several transcription and epigenetic factors, including miRNAs [Citation5]. There are several adipocyte-specific genes that are activated during adipogenesis [Citation6]. Fatty acid binding protein (FABP) [Citation4], also known as aP2, is a lipid binding protein that acts as an adipokine in regulating systemic metabolism [Citation7,Citation8]. Lipoprotein lipase (LPL) is the primary enzyme involved in fatty acid uptake from lipoproteins and de novo lipogenesis [Citation9]. In addition, LPL is closely related to cell growth and seems to be important for brown adipose tissue activation [Citation10–12]. Also Acyl-CoA thioesterase 2 (ACOT2) plays a role as an auxiliary enzyme supporting efficient fat burning by a thermogenic mechanism [Citation13–15]. Adipose tissue plays a key role in regulating metabolism and insulin sensitivity [Citation16]. White adipose tissue (WAT) stores energy as fat depots and produces adipokines and prostaglandins [Citation17,Citation18]. Brown adipose tissue (BAT) dissipates heat as a result of fat metabolism and high mitochondrial activity [Citation19]. Beige or brite adipose tissue shows strong mitochondrial activity, and derives from de novo adipocyte differentiation of stem and progenitor cells, or from a transdifferentiation of white adipocytes following a process called ‘browning’ [Citation20,Citation21]. Uncoupling protein 1 (UCP1) expressed by thermogenic adipocytes is critical for adaptive thermogenesis [Citation22]. Elevated UCP1 levels contribute to the enhancement of basal glucose uptake in adipocytes [Citation23]. Furthermore, manipulation of UCP1 expression has been shown to reduce obesity improving insulin sensitivity [Citation24]. As well as brown adipocytes, beige cells respond to adrenergic stimuli through mitochondrial biogenesis, UCP1 expression, fatty acid degradation and heat generation [Citation25]. In addition, beige adipocytes can be distinguished from other cell types thanks to specific markers, including PAT2 and TMEM26 [Citation26,Citation27]. By regulating adipocyte function and body energy balance, also Poly(ADP-Ribose)Polymerase-1 (PARP1) plays a role in obesity and obesity-related disorders [Citation28]. PARP enzymes, upregulated during adipocyte development, are involved in the regulation of inflammation, increasing SIRT1 activity, and modulating PPARγ expression [Citation29,Citation30]. A surplus in energy storage, as in obese patients, leads to the release of inflammatory cytokines and adipokines, degenerating into a wide range of disorders, as cardiovascular diseases [Citation31]. Several signalling pathways and epigenetic factors contribute to the regulation of MSC differentiation into specific phenotypes [Citation32]. Moreover, it is largely demonstrated that many bioactive molecules regulate adipogenic differentiation and expression of key transcription factors [Citation33]. Vitamin D is well-known for its ability to counteract adipogenesis while inducing osteogenesis [Citation34,Citation35]. Moreover, overweight and obesity are often associated with Vitamin D deficiency [Citation36]. Within this context, we previously demonstrated that the combination of vitamin D and metformin is able to counteract ADSC adipogenic differentiation, modulating vitamin D metabolism and the expression of specific epigenetic factors [Citation37,Citation38]. In the present paper, we aimed at evaluating the capability of these two molecules in orchestrating stem cell differentiation towards the beige phenotype, with particular attention to the main adipogenic markers and UCP1 expression, as a potential therapeutic strategy to counteract obesity.
Materials and methods
Cell isolation and culturing
ADSCs were isolated from abdominal subcutaneous adipose tissue of men and women (n = 6, age = 45 ± 15 years, BMI: 22 ± 3 kg/m2) after acceptance and signing of informed consent. The study was approved by the Review Board of the Human Studies Ethics Committee of Sassari. Briefly, the tissue was washed in PBS (Euroclone, Milan, Italy; ref. ECB4004L) and digested by Collagenase type I solution (Gibco Life Technologies, Grand Island, NY, USA, ref. 17,010–029) as previously described [Citation34]. Cells were then resuspended in a basic culture medium consisting of Dulbecco’s modified Eagle’s Medium (DMEM) (Life Technologies Grand Island, NY, USA; ref. 21,885–025) supplemented with 20% foetal bovine serum (FBS) (Life Technologies, Grand Island, NY, USA; ref. 10,270–106), 200 mM L-glutamine (Euroclone, Milan, Italy; ref. ECB3000D), and 200 U/mL penicillin 0. 1 mg/mL streptomycin (Euroclone, Milan, Italy; ref. ECB3001D). The culture medium was changed every 3 days. After reaching the confluence, cells were immunomagnetically separated using a primary monoclonal anti-c/kit (CD117) antibody (Miltenyi Biotec, Minneapolis, MN, USA) and labelled in the columns with a secondary antibody directly conjugated to MicroBeads (MACS Miltenyi Biotec, Bologna, Italy). Cells were then characterized by flow cytometry as previously described [Citation34]. Briefly, cells were fixed at room temperature for 10 min using 1% formaldehyde and then permeabilized using a permeabilization buffer (eBioscienceMilano, Italy) for 30 min at 4°C. After a washing step, cells were incubated 1 h at 4°C, with primary antibodies directed against CD73, CD90 (BD Biosciences, San Jose, CA, USA), CD105 (Santa Cruz Biotechnology, Heidelberg, Germany), CD45 and CD31 (Sigma-Aldrich, Munich, Germany) and with fluorescein isothiocyanate (FITC)-conjugated secondary antibody for 1 h at 4°C in the dark. After washing, cells were analysed on a flow cytometer (CytoFlex, Beckman Coulter, Milan, Italy) by collecting 10,000 events. ADSCs positive for CD73, CD90 and CD105 at passage 5 were used for experiments. All experiments started at day 0, when cells reached the confluence and were performed twice (in three technical replicates) for a total of 21 days. Cells used as untreated control cells were maintained in normal growing medium (CTRL). A group of cells, used as positive control of adipogenic differentiation was cultured in a specific conditioned differentiation medium (DM) (StemPro Adipocyte Differentiation Medium, Gibco Life Technologies, Grand Island, NY, USA). Finally, a group of cells was cultured in DM in the presence of 10−6 M vitamin D (Sigma Aldrich Chemie GmbH, Munich, Germany, cod. C9765) (DM+VIT) or 5 mM metformin (Sigma Aldrich Chemie GmbH, Munich, Germany, cod. PHR1084) (DM+MET) or both (DM+VIT+MET).
Gene expression analysis
Gene expression analysis was performed after 7, 14, and 21 d of culturing under the above described conditions. Approximately 1 µg of total RNA was extracted using the ChargeSwitch kit (Thermo Fisher Scientific, Grand Island, NY, USA; ref. CS14010) according to the manufacturer’s instructions, quantified by the NanoDrop™ One/OneC Microvolume UV-Vis spectrophotometer (Thermo Fisher Scientific, Grand Island, NY, USA) and reverse transcribed using the high-capacity cDNA reverse transcription kit (Thermo Fisher Scientific, Grand Island, NY, USA; ref.4368814). Real-time quantitative PCR was performed with Platinum® Quantitative PCR SuperMix-UDG Kit (Thermo Fisher Scientific, Grand Island, NY, USA; ref. 11,730–017) in triplicate using a CFX Thermal Cycler (Bio-Rad, Hercules, CA, USA). Amplification cycling was setted as specified in the protocol: 50°C for 2 min, 95°C for 2 min, and then cycled at 95°C for 15s, 55–59°C for 30s, and 60°C for 1 min, for a total of 40 cycles. Target Ct values of each sample were normalized to hGAPDH, which was considered as a reference gene. The relative values of the genes of interest were expressed as fold of change (2−∆∆Ct) of mRNA levels observed in undifferentiated ADSCs, used as control cells. The primers used (Thermo Fisher Scientific, Grand Island, NY, USA), are described in .
Table 1. Primers sequences.
Immunoblotting
Cells were cultured in the above described conditions for 21 days. Protein extraction was performed by RIPA Lysis and Extraction Buffer (Thermo Fisher Scientific, Grand Island, NY, USA; ref. 89,900) according to the manufacturer’s instructions and run by electrophoresis on 10% Novex Trisglycine polyacrylamide gels (Thermo Fisher Scientific, Grand Island, NY, USA; ref.NW00100BOX) in 4-morpholinepropanesulfonic acid, sodium dodecyl sulphate (MOPS SDS) Running Buffer (Thermo Fisher Scientific, Grand Island, NY, USA; ref. NP0001), using the XCell SureLock™ Mini-Cell (Thermo Fisher Scientific, Grand Island, NY, USA). Proteins were then transferred into polyvinylidene difluoride (PVDF) membranes (0.2 µm pore size) (Thermo Fisher Scientific, Grand Island, NY, USA; ref. IB301002) using iBlot® Dry Blotting System (Thermo Fisher Scientific, Grand Island, NY, USA). The membrane was saturated in non-fat dry milk (Bio-Rad Laboratories, California, USA; ref. 210,007,070) blocking buffer for 1 h at room temperature and incubated overnight in the presence of rabbit polyclonal anti-GAPDH(Santa Cruz Biotechnology, Texas, USA) and rabbit monoclonal anti-UCP1 (Cell Signalling, Massachusetts, USA) primary antibodies. At the end of incubation, membranes were washed and incubated with anti-rabbit peroxidase (HRP)-conjugated secondary antibody (Abcam, Cambridge, UK) for 2 h at RT. Protein expression was assessed by SuperSignal Chemiluminescent HRP Substrates (Thermo Fisher Scientific, Grand Island, NY, USA; ref. 34,096). Data from treated cells were reported as relative to the expression of untreated control cells and normalized to the expression level of GAPDH.
Immunostaining
After 21 days of culture in the above described conditions, ADSCs were fixed for 30 min at RT with 4% paraformaldehyde (Sigma Aldrich Chemie GmbH, Germany; ref. 16,005) and permeabilized with 0.1% Triton X-100 (Thermo Fisher Scientific, Grand Island, NY, USA; ref. T8787)-PBS. Cells were then washed three times in PBS and incubated for 30 min with 3% bovine serum albumin (BSA)-0. 1% Triton X-100 in PBS (Thermo Fisher Scientific, Grand Island, NY, USA). A Double-Label Immunohistochemical procedure was carried out. Anti-Poly[ADP-ribose]polymerase (PARP1)(Cell Signalling, Massachusetts, USA), anti-transmembrane protein 26 (TMEM26) (Abcam, Cambridge, UK), proton-coupled amino acid transporter (PAT2) (Santa Cruz Biotechnology, Texas, USA), mTor (Abcam, United Kingdom) and cytochrome c (Cell Signalling, Massachusetts, USA) primary antibodies were incubated overnight at 4°C. At the end of incubation, cells were washed twice in PBS for 5 min and incubated with fluorescence-conjugated secondary antibodies (Life Technologies, USA) at 37°C for 1 h in the dark. Nuclei were labelled with 1 µg/mL 4,6-diamidino-2-phenylindole (DAPI) (Thermo Fisher Scientific, Grand Island, NY, USA). Fluorescence was acquired with a confocal microscope (TCS SP5, Leica, Nussloch, Germany).
Statistical analysis
Statistical analysis was performed using GraphPad Prism 9.0 software (GraphPad, San Diego, CA, USA). The experiments were performed two times with three technical replicates for each treatment. For this study, Kruskal–Wallis rank sum, two-way analysis-of-variance ANOVA tests with Tukey’s correction and Wilcoxon signed-rank test were used, assuming a p value < 0.05 as statistically significant. We considered *p < 0.05, **p < 0.01, ***p < 0.001, ****p ≤ 0.0001.
Results
The combination of metformin and vitamin D modulates the expression of adipogenesis specific markers
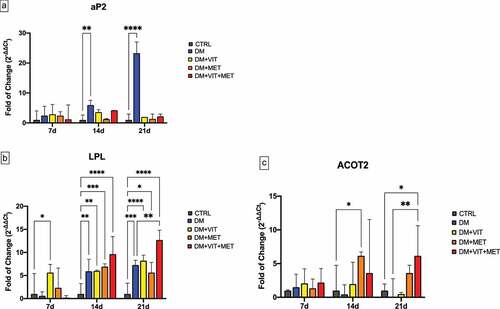
shows the expression of key adipogenesis regulatory genes, adipocyte Protein 2 (aP2) (Panel A), Lipoprotein lipase (LPL) (Panel B) and acyl-CoA thioesterase 2 (ACOT2) (Panel C) in ADSCs cultured in the presence of different conditioned media. aP2 expression was significantly increased in cell exposed to differentiation medium alone (DM)(blue bar), while in the presence of the other conditioned media (DM+VIT; DM+MET; DM+VIT+MET) its expression was comparable to that observed in control untreated cells (Panel A), exhibiting an opposite trend to that observed for LPL and ACOT2 expression. In fact, LPL expression was induced in ADSCs cultured in the presence of different conditioned media after 14 days in culture (Panel B), being significantly increased in ADSCs cultured in the presence of both metformin and vitamin D after 21 days (DM+VIT+MET) (red bar), as compared to both control untreated cells and ADSCs cultured in the presence of DM alone. Similarly, ACOT2 expression (Panel C) was significantly upregulated in ADSCs exposed to metformin (DM+MET) (orange bar) after 14 days in culture and in ADSCs cultured in the presence of both metformin and vitamin D (DM+VIT+MET) (red bar) after 21 days, as compared to both control untreated cells and ADSCs cultured in the presence of DM alone.
Figure 1. Expression of key adipogenesis regulatory genes. The expression of the adipogenesis orchestrating genes aP2 (Panel A), LPL (Panel B) and ACOT2 (Panel C) was evaluated after 7, 14 and 21 days in ADSCs cultured in the presence of adipogenic differentiation medium (DM) (blue bars), or in DM in the presence of vitamin D (DM+VIT) (yellow bars), or in DM in the presence of metformin (DM+MET) (Orange bars), or in DM with both metformin and vitamin D (DM+VIT+MET) (red bars), as compared to control untreated cells (grey bars). The mRNA levels for each gene were normalized to Glyceraldehyde-3-Phosphate-Dehydrogenase (GAPDH) and expressed as fold of change (2−∆∆Ct) of the mRNA levels observed in undifferentiated control ADSCs defined as 1 (mean ±SD; n = 6). Kruskal–Wallis rank sum, two-way analysis-of-variance ANOVA tests with Tukey’s correction and Wilcoxon signed-rank test were used. Data are expressed as mean ± SD referred to the control (* p ≤ 0.05; **p ≤ 0.01; ***p ≤ 0.001; ****p ≤ 0.0001).
The combination of metformin and vitamin D induces the acquisition of a beige/brown adipogenic phenotype
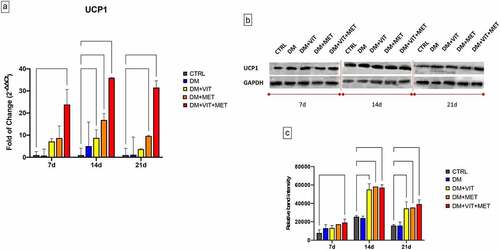
The presence of metformin alone (DM+MET) or in combination with vitamin D (DM+VIT+MET) in the adipogenic differentiation medium, was able to induce the acquisition of beige/brown phenotype, through the upregulation of Uncoupling Protein 1 (UCP1) (). The gene expression of UCP1 was significantly increased in ADSCs exposed to DM+MET (orange bars) (* p ≤ 0.05) and to DM+VIT+MET (red bars) (***p ≤ 0.001) since the first days of culturing, as compared to both untreated controls and ADSCs cultured in the presence of DM alone (Panel A). Western blotting analysis confirmed this trend, showing higher protein levels in ADSCs exposed to DM+MET and DM+VIT+MET, as compared to untreated control cells (Panel B).
Figure 2. Expression of brown adipocyte specific UCP1 gene. A) The levels of UCP1 mRNA expression were evaluated after 7, 14 and 21 days in ADSCs cultured in the presence of adipogenic differentiation medium (DM) (blue bars), or in DM in the presence of vitamin D (DM+VIT) (yellow bars), or in DM in the presence of metformin (DM+MET) (Orange bars), or in DM with both metformin and vitamin D (DM+VIT+MET) (red bars), as compared to control untreated cells (grey bars). The mRNA levels were normalized to Glyceraldehyde-3-Phosphate-Dehydrogenase (GAPDH) and expressed as fold of change (2−∆∆Ct) of the mRNA levels observed in undifferentiated control ADSCs defined as 1 (mean ±SD; n = 6). Kruskal–Wallis rank sum, two-way analysis-of-variance ANOVA tests with Tukey’s correction and Wilcoxon signed-rank test were used. Data are expressed as mean ± SD referred to the control (* p ≤ 0.05; **p ≤ 0.01; ***p ≤ 0.001; ****p ≤ 0.0001). B) The protein levels were analysed after 7, 14 and 21 days by Western blot, using monoclonal antisera against UCP1 and GAPDH. The sizes of the bands were determined using pre-stained marker proteins. The data presented are representative of different independent experiments. C) Relative band intensity was measured with ImageJ software. Data are expressed as mean ± SD referred to the control (* p ≤ 0.05; **p ≤ 0.01; ***p ≤ 0.001; ****p ≤ 0.0001).
Metformin and vitamin D orchestrate ADSC terminal differentiation
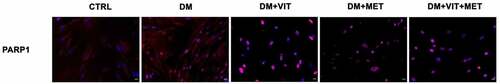
Immunohistochemical analysis confirmed that the presence of metformin alone or together with vitamin D is able to modulate ADSC adipogenic commitment (). In particular, PARP1, clearly evident during adipocyte development, is significantly inhibited when ADSCs were cultured in the presence of metformin (DM+MET) or both metformin and vitamin D (DM+VIT+MET).
Figure 3. Immunohistochemistry analysis of adipogenic differentiation after 21 days in culture. Immunohistochemical analysis of the expression of PARP1 (AF594-labelled, red) was performed in ADSCs cultured in the presence of adipogenic differentiation medium (DM), or in DM in the presence of vitamin D (DM+VIT), or in DM in the presence of metformin (DM+MET), or in DM with both metformin and vitamin D (DM+VIT+MET), as compared to control untreated cells (CTRL). The figures are representative of different independent experiments. For each differentiation marker, fields with the highest yield of positively stained cells are shown. Relative intensity was measured with ImageJ software. Nuclei are labelled with 4,6-diamidino-2-phenylindole (DAPI, blue). Scale bars: 40 µm.
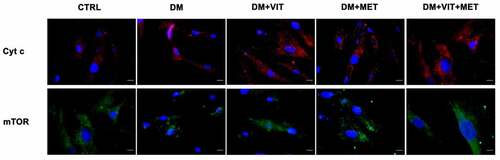
At the same time, also cytochrome c and mTor expression was significantly increased when ADSCs were cultured in the presence of vitamin D (DM+VIT) or metformin (DM+MET) or both metformin and vitamin D (DM+VIT+MET), while it was poorly expressed in ADSCs cultured in adipogenic differentiation medium alone (DM)().
Figure 4. Immunohistochemistry analysis of adipogenic differentiation after 21 days in culture. Immunohistochemical analysis of the expression of Cyt c (AF594-labelled, red) and mTor (AF488-labelled, green) was performed in ADSCs cultured in the presence of adipogenic differentiation medium (DM), or in DM in the presence of vitamin D (DM+VIT), or in DM in the presence of metformin (DM+MET), or in DM with both metformin and vitamin D (DM+VIT+MET), as compared to control untreated cells (CTRL). The figures are representative of different independent experiments. For each differentiation marker, fields with the highest yield of positively stained cells are shown. Relative intensity was measured with ImageJ software. Nuclei are labelled with 4,6-diamidino-2-phenylindole (DAPI, blue). Scale bars: 40 µm.
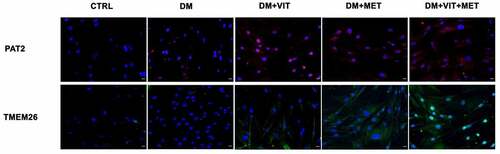
On the other hand, PAT2 and TMEM26 expression () was increased in cells exposed to differentiation medium in the presence of vitamin D (DM+VIT) or metformin (DM+MET) or both (DM+VIT+MET), while it was completely undetectable in ADSCs cultured in adipogenic differentiation medium alone (DM).
Figure 5. Immunohistochemistry analysis of adipogenic differentiation after 21 days in culture. Immunohistochemical analysis of the expression of PAT2 (AF594-labelled, red) and TMEM26 (AF488-labelled, green) were performed in ADSCs cultured in the presence of adipogenic differentiation medium (DM), or in DM in the presence of vitamin D (DM+VIT), or in DM in the presence of metformin (DM+MET), or in DM with both metformin and vitamin D (DM+VIT+MET), as compared to control untreated cells (CTRL). The figures are representative of different independent experiments. For each differentiation marker, fields with the highest yield of positively stained cells are shown. Relative intensity was measured with ImageJ software. Nuclei are labelled with 4,6-diamidino-2-phenylindole (DAPI, blue). Scale bars: 40 µm.
Discussion
ADSCs are mesenchymal stem cells with a great plasticity for application in regenerative medicine [Citation39]. Adipogenesis is a complex multi-step process finely regulated by genes, signalling pathways and epigenetic modifications [Citation40]. We have recently demonstrated that different bioactive molecules can be used in the attempt to counteract ADSC adipogenic differentiation and lipid accumulation in the adipose tissue. For example, the combination of melatonin and vitamin D was able to induce the appearance of osteogenic phenotype by inhibiting the PPAR-γ expression and activating the epigenetic modulators SIRT and HDAC [Citation33,Citation34]. In addition, also metformin, well known for inducing weight loss in overweight or obesity patients [Citation41], when combined with vitamin D, modulates the expression of CYP450 enzymes and miRNAs, blocking adipogenesis [Citation37]. It has been demonstrated that vitamin D plays a key role in the regulation of metabolism, modulating white adipocyte differentiation and energy expenditure [Citation42,Citation43]. Vitamin D deficiency has been linked to oxidative stress, inflammation, ageing, cardiovascular disease, and diabetes. Optimal serum levels of vitamin D are ≥ 30 ng/mL, while levels between 20–30 ng/mL indicate ‘insufficiency’, and levels < 20 ng/mL indicate ‘deficiency’ [Citation44]. Vitamin D influences most of the risk factors and molecular mechanisms associated with cerebrovascular disease, preventing their onset, progression, and severity [Citation45]. In addition, supplementation in patients with T2DM under standard metformin therapy attenuates the risk of oxidative stress, metabolic syndrome and related cardiovascular events [Citation46,Citation47]. Moreover, 1,25(OH)2D3/VDR signalling suppressed differentiation of 3T3-L1 white adipocytes together with increased expression of uncoupling proteins (Ucp1 and Ucp2) and development of BAT [Citation48]. Within this context, we previously evaluated the ability of the two molecules to modulate adipogenic differentiation, finely tuning the inflammatory response, cytokines secretion and autophagy [Citation38] In the present paper we evaluated for the first time, the effect of these molecules in inducing a different phenotype during ADSC adipogenic differentiation. In addition to white and brown adipose tissue, beige or brite adipocytes also have a role in body glucose regulation and thermogenesis [Citation49]. These ‘brown-like’ cells express an increased mitochondrial activity and oxidative metabolism and high levels of UCP1 and other fat specific markers, as PAT2 and TMEM 26 [Citation26,Citation27,Citation50]. mTOR, is a Ser/Thr protein kinase regulating protein and lipid synthesis, cell proliferation and metabolism, and autophagy [Citation51]. Recently, mTOR-related signalling pathways have been reported to play pivot roles in the regulation of adipose tissue browning and chemical energy dissipation through thermogenesis [Citation52] but the precise mechanisms are still poorly understood. Inhibition of mTOR completely blocks BAT expansion, reducing oxygen consumption and mitochondrial biogenesis [Citation53]. Indeed, as already shown by other authors, the mTOR pathway is crucial for the early stages of brown preadipocytes differentiation, enhancing glucose uptake through the GLUT1 transporter [Citation52]. Our results show that metformin, alone or in combination with vitamin D, is able to induce mTOR expression, probably activating AMPK, which in turn also induces increased expression of UCP1.
Adipocytes terminal differentiation is characterized by increased expression of PPARγ and PARP1 proteins and lipid accumulation [Citation28]. In particular, PARP1 knockout mice, show a reduced lipid deposition with induction of UCPs, and increased energy expenditure [Citation54]. Deletion or pharmacological inhibition of PARP1 supports mitochondrial biogenesis and function, providing protection against metabolic disease [Citation55]. According to other Authors’ findings obtained in knockout mice, our results show that ADSC exposure to metformin, alone or in combination with vitamin D, was able to downregulate PARP1 expression, increasing thermogenic activity through upregulation of mitochondrial UCP1, PAT2 and TMEM26 [Citation28,Citation56]. Furthermore, several drug can be used for their anti-obesity effects [Citation57]. Some studies demonstrated the effect of beta(3)-adrenergic agonist in decreasing expression levels of aP2 and PPARγ, affecting fat deposition in WAT and promoting thermogenesis [Citation58]. The same effect was observed by other Authors in 3T3-L1 adipogenesis after treatment with raspberry ketone, that revealed the inhibition of adipogenic markers by the proper regulation of autophagy [Citation59].
Here, we observed a downregulation of aP2 in the presence of metformin and vitamin D, accompanied by an induction of thermogenic protein UCP1 and browning differentiation. Opposite trend what observed in LPL and ACOT2 expression. These genes were significantly upregulated when cells were cultured in the presence of metformin alone or in combination with vitamin D. In fact, regulation of mitochondrial ACOT2 occurs mainly in the late phase of adipocyte differentiation, and its expression increases with increasing of β-oxidation [Citation60,Citation61]. ACOT2 expression may be upregulated in brown adipocyte to support the fat storage and thermogenic activity of this cells [Citation15]. LPL is a major triglyceride transporter and increases lipid absorption [Citation9]. In white adipose tissue, increased LPL activity is related with increased fat mass, chronic inflammation and insulin resistance [Citation62,Citation63]. Conversely, in brown adipose tissue LPL upregulation exerts positive effects on metabolic disease by burning excess calories through activation of mitochondrial thermogenesis [Citation64]. Human studies currently show that activation of thermogenic adipose tissue is associated with a small and negligible loss of fat mass [Citation65]. Moreover, no dietary intervention has yet been shown to affect Ucp1 expression, which is only expressed at extremely low levels in subcutaneous fat depots [Citation66,Citation67]. Several authors demonstrated the effect of 5 mM metformin in the modulation of cell behaviour [Citation68–70], as well as of vitamin D, involved in osteogenic differentiation [Citation34,Citation71]. The combination of the two molecules could therefore open new therapeutic approaches for in vivo evaluation of the physiological response. Our results describe for the first time the ability of metformin and vitamin D to promote ADSC differentiation towards beige phenotype, suggesting their possible direct application in prevention of obesity and metabolic disorders, driving adipogenesis towards metabolically active brown adipose tissue.
Author contributions
Conceptualization, S.C. and M.M.; methodology, S.C., G.G., R.P. and D.C.; formal analysis, S.C. G.G., software, S.C., validation, C.V. and M.M.; investigation, S.C. and M.M; resources, G.C.G., M.L.C; data curation, S.C.; writing—original draft preparation, S.C.; writing—review and editing, S.C., C.V, M.M; visualization G.C, S.D,; supervision, M.M; funding acquisition S.D, G.C., M.M. All authors have read and agreed to the published version of the manuscript.
Institutional review board statement
The study was conducted according to the guidelines of the Declaration of Helsinki and approved by the Ethics Committee Review Boards for Human Studies in Sassari n_ ETIC 240I/CE 26 July 2016, Ethical committee, ASL Sassari.
Informed consent statement
Informed consent was obtained from all subjects involved in the study.
Disclosure statement
No potential conflict of interest was reported by the author(s).
Data availability statement
The authors confirm that the data supporting the findings of this study are available within the article [and/or] its supplementary materials (http://dx.doi.org/10.1080/21623945.2022.2085417).
Additional information
Funding
References
- Tsuji W. Adipose-derived stem cells: implications in tissue regeneration. World J Stem Cells. 2014;6:312.
- Maioli M, Rinaldi S, Santaniello S, et al. Radioelectric asymmetric conveyed fields and human adipose-derived stem cells obtained with a nonenzymatic method and device: a novel approach to multipotency. Cell Transplant. 2014;23(12):1489–1500.
- Strem BM, Hicok KC, Zhu M, et al. Multipotential differentiation of adipose tissue-derived stem cells. Keio J Med. 2005; 54: 132–141.
- Han Y, Li X, Zhang Y, et al. mesenchymal stem cells for regenerative medicine. Cells. 2019;8:886.
- de Sá PM, Richard AJ, Hang H, et al. Transcriptional regulation of adipogenesis. Compr Physiol. 2017;7(2):635–674.
- Gerhold DL, Liu F, Jiang G, et al. Gene expression profile of adipocyte differentiation and its regulation by peroxisome proliferator-activated receptor-γ agonists. Endocrinology. 2002;143:2106–2118.
- Ertunc ME, Sikkeland J, Fenaroli F, et al. Secretion of fatty acid binding protein aP2 from adipocytes through a nonclassical pathway in response to adipocyte lipase activity. J Lipid Res. 2015;56:423–434.
- Coe NR, Simpson MA, Bernlohr DA, et al. Targeted disruption of the adipocyte lipid-binding protein (aP2 protein) gene impairs fat cell lipolysis and increases cellular fatty acid levels. J Lipid Res. 1999;40:967–972.
- Goldberg IJ, Eckel RH, Abumrad NA. Regulation of fatty acid uptake into tissues: lipoprotein lipase- And CD36-mediated pathways. J Lipid Res. 2009;50:S86–S90.
- Song Z, Xiaoli AM, Yang F. Regulation and metabolic significance of De Novo lipogenesis in adipose tissues. Nutrients. 2018;10:1383.
- Bartelt A, Weigelt C, Cherradi ML, et al. Effects of adipocyte lipoprotein lipase on de novo lipogenesis and white adipose tissue browning. Biochim Biophys Acta - Mol Cell Biol Lipids. 2013;1831:934–942.
- Garcia-Arcos I, Hiyama Y, Drosatos K, et al. Adipose-specific lipoprotein lipase deficiency more profoundly affects brown than white fat biology. J Biol Chem. 2013;288:14046–14058.
- Liu L, Wu J, Gao Y, et al. The effect of Acot2 overexpression or downregulation on the preadipocyte differentiation in Chinese Red Steppe cattle. Adipocyte. 2020;9:279–289.
- Ohtomo T, Hoshino A, Yajima M, et al. Expression and distribution of acyl-CoA thioesterases in the white adipose tissue of rats. Histochem Cell Biol. 2013;140:223–232.
- Momose A, Fujita M, Ohtomo T, et al. Regulated expression of acyl-CoA thioesterases in the differentiation of cultured rat brown adipocytes. Biochem Biophys Res Commun. 2011;404:74–78.
- Smith U, Kahn BB. Adipose tissue regulates insulin sensitivity: role of adipogenesis, de novo lipogenesis and novel lipids. J Intern Med. 2016;280:465–475.
- Lee M-W, Lee M, Oh K-J. Adipose tissue-derived signatures for obesity and type 2 diabetes: adipokines, batokines and microRNAs. J Clin Med. 2019;8(6):854.
- Gómez-Hernández A, Beneit N, Díaz-Castroverde S, et al. Differential role of adipose tissues in obesity and related metabolic and vascular complications. Int J Endocrinol. 2016;2016:1–15.
- Ravussin E, Galgani JE. The implication of brown adipose tissue for humans. Annu Rev Nutr. 2011;31:33–47.
- Bartelt A, Heeren J. Adipose tissue browning and metabolic health. Nat Rev Endocrinol. 2014;10:24–36.
- Harms M, Seale P. Brown and beige fat: development, function and therapeutic potential. Nat Med. 2013;19:1252–1263.
- Okamatsu-Ogura Y, Fukano K, Tsubota A, et al. Thermogenic ability of uncoupling protein 1 in beige adipocytes in mice. PLoS One. 2013;8:e84229.
- Kozak LP, Anunciado-Koza R. UCP1: i ts involvement and utility in obesity. Int J Obesity. 2008;32:S32–S38.
- Stanford KI, Middelbeek RJW, Townsend KL, et al. Brown adipose tissue regulates glucose homeostasis and insulin sensitivity. J Clin Invest. 2013;123:215–223.
- Shapira SN, Seale P. Transcriptional control of brown and beige fat development and function. Obesity. 2019;27:13–21.
- Wu J, Boström P, Sparks L, et al. Beige adipocytes are a distinct type of thermogenic fat cell in mouse and human. Cell. 2012;150:366–376.
- Sidossis L, Kajimura S. Brown and beige fat in humans: thermogenic adipocytes that control energy and glucose homeostasis. J Clin Investig. 2015;125:478–486.
- Szántó M, Bai P. The role of ADP-ribose metabolism in metabolic regulation, adipose tissue differentiation, and metabolism. Genes Dev. 2020;34:321–340.
- Luo X, Ryu KW, Kim D-S, et al. PARP-1 controls the adipogenic transcriptional program by PARylating C/EBPβ and modulating its transcriptional activity. Mol Cell. 2017;65:260–271.
- Erener S, Hesse M, Kostadinova R, et al. Poly(ADP-ribose)polymerase-1 (PARP1) controls adipogenic gene expression and adipocyte function. Mol Endocrinol. 2012;26:79–86.
- Makki K, Froguel P, Wolowczuk I. Adipose tissue in obesity-related inflammation and insulin resistance: cells, cytokines, and chemokines. ISRN Inflamm. 2013;2013:1–12.
- Nic-Can GI, Rodas-Junco BA, Carrillo-Cocom LM, et al. Epigenetic regulation of adipogenic differentiation by histone lysine demethylation. Int J Mol Sci. 2019;20:3918.
- Moseti D, Regassa A, Kim WK. Molecular regulation of adipogenesis and potential anti-adipogenic bioactive molecules. Int J Mol Sci. 2016;17:124.
- Basoli V, Santaniello S, Cruciani S, et al. Melatonin and vitamin D interfere with the adipogenic fate of adipose-derived stem cells. Int J Mol Sci. 2017;18:981.
- Santaniello S, Cruciani, S, Basoli, V, et al. Melatonin and vitamin D orchestrate adipose derived stem cell fate by modulating epigenetic regulatory genes. Int J Med Sci. 2018;15(14):1631–1639.
- Vranić L, Mikolašević I, Milić S. Vitamin D deficiency: consequence or cause of obesity? Medicina (Lithuania). 2019.
- Cruciani S, Garroni G, Balzano F, et al. Tuning adipogenic differentiation in adscs by metformin and vitamin d: involvement of mirnas. Int J Mol Sci. 2020;21:6181.
- Cruciani S, Garroni G, Pala R, et al. Metformin and vitamin d modulate inflammation and autophagy during adipose-derived stem cell differentiation. Int J Mol Sci. 2021;22:6686.
- Kern S, Eichler H, Stoeve J, et al. Comparative analysis of mesenchymal stem cells from bone marrow, umbilical cord blood, or adipose tissue. Stem Cells. 2006;24:1294–1301.
- Ambele MA, Dhanraj P, Giles R, et al. Adipogenesis: a complex interplay of multiple molecular determinants and pathways. Int J Mol Sci. 2020;21:4283.
- Hui F, Zhang Y, Ren T, et al. Role of metformin in overweight and obese people without diabetes: a systematic review and network meta-analysis. Eur J Clin Pharmacol. 2019;75:437–450.
- Bhat M, Noolu B, Qadri SS, et al. Vitamin D deficiency decreases adiposity in rats and causes altered expression of uncoupling proteins and steroid receptor coactivator3. J Steroid Biochem Mol Biol. 2014;144:304–312.
- Abbas MA. Physiological functions of vitamin D in adipose tissue. 2017;J Steroid Biochem Mol Biol. 165:369–381.
- Garland CF, Kim JJ, Mohr SB, et al. Meta-analysis of all-cause mortality according to serum 25-hydroxyvitamin D. Am J Public Health. 2014;104:e43–e50.
- Kim HA, Perrelli, A, Ragni, A, et al. Vitamin D deficiency and the risk of cerebrovascular disease. Antioxidants. 2020;9(4):327.
- Cojic M, Kocic R, Klisic A, et al. The effects of vitamin d supplementation on metabolic and oxidative stress markers in patients with type 2 diabetes: a 6-month follow up randomized controlled study. Front Endocrinol (Lausanne). 2021;12. DOI:10.3389/fendo.2021.610893
- Alkharfy KM, Al-Daghri NM, Sabico SB, et al. Vitamin D supplementation in patients with diabetes mellitus type 2 on different therapeutic regimens: a one-year prospective study. Cardiova Diabetol. 2013; 12: 113.
- Ricciardi CJ, Bae J, Esposito D, et al. 1,25-Dihydroxyvitamin D3/vitamin D receptor suppresses brown adipocyte differentiation and mitochondrial respiration. Eur J Nutr. 2015;54:1001–1012.
- Kaisanlahti A, Glumoff T. Browning of white fat: agents and implications for beige adipose tissue to type 2 diabetes. J Physiol Biochem. 2019;75:1–10.
- Lee JH, Park A, Oh KJ, et al. The role of adipose tissue mitochondria: regulation of mitochondrial function for the treatment of metabolic diseases. Int J Mol Sci. 2019;20(19):4924.
- Saxton RA, Sabatini DM. mTOR signaling in growth, metabolism, and disease. Cell. 2017;168:960–976.
- Ye Y, Liu H, Zhang F, et al., MTOR signaling in brown and beige adipocytes: implications for thermogenesis and obesity, Nutr Metab. 16 2019; DOI:10.1186/s12986-019-0404-1
- van der Vaart JI, Boon MR, Houtkooper RH. The role of AMPK signaling in brown adipose tissue activation. Cells. 2021;10:1122.
- Bai P, Cantó C, Oudart H, et al. PARP-1 inhibition increases mitochondrial metabolism through SIRT1 activation. Cell Metab. 2011;13:461–468.
- Vida A, Márton J, Mikó E, et al. Metabolic roles of poly(ADP-ribose) polymerases. Semin Cell Dev Biol. 2017;63:135–143.
- Karise I, Bargut TC, Del Sol M, et al. Metformin enhances mitochondrial biogenesis and thermogenesis in brown adipocytes of mice. Biomed Pharmacother. 2019;111:1156–1165.
- Ro SH, Jang Y, Bae J, et al. Autophagy in adipocyte browning: emerging drug target for intervention in obesity. Front Physiol. 2019;10. DOI:10.3389/fphys.2019.00022
- Margareto J, Larrarte E, Marti A, et al. Up-regulation of a thermogenesis-related gene (UCP1) and down-regulation of PPARγ and aP2 genes in adipose tissue: possible features of the antiobesity effects of a β3-adrenergic agonist. Biochem Pharmacol. 2001;61(12):1471–8.
- Leu SY, Chen Y-C, Tsai Y-C, et al. Raspberry ketone reduced lipid accumulation in 3T3-L1 cells and ovariectomy-induced obesity in Wistar rats by regulating autophagy mechanisms. J Agric Food Chem. 2017;65:10907–10914.
- Ohtomo T, Ino, K, Miyashita, R, et al. Chronic high-fat feeding impairs adaptive induction of mitochondrial fatty acid combustion-associated proteins in brown adipose tissue of mice. Biochem Biophys Rep. 2017; 10: 32–38.
- Moffat C, Bhatia, L, Nguyen, T, et al. Acyl-CoA thioesterase-2 facilitates mitochondrial fatty acid oxidation in the liver. J Lipid Res. 2015; 55(12):2458–70.
- Guilherme A, Virbasius JV, Puri V, et al. Adipocyte dysfunctions linking obesity to insulin resistance and type 2 diabetes. Nat Rev Mol Cell Biol. 2008;9:367–377.
- Jung UJ, Choi MS. Obesity and its metabolic complications: the role of adipokines and the relationship between obesity, inflammation, insulin resistance, dyslipidemia and nonalcoholic fatty liver disease. Int J Mol Sci. 2014:15(4);6184–223.
- Klingenspor M, Ebbinghaus C, Hülshorst G, et al. Multiple regulatory steps are involved in the control of lipoprotein lipase activity in brown adipose tissue. J Lipid Res. 1996;37:1685–1695.
- Yoneshiro T, Aita S, Matsushita M, et al. Recruited brown adipose tissue as an antiobesity agent in humans. J Clin Invest. 2013;123:3404–3408.
- Maurer SF, Dieckmann S, Lund J, et al. No effect of dietary fish oil supplementation on the recruitment of brown and brite adipocytes in mice or humans under thermoneutral conditions. Mol Nutr Food Res. 2021;65:2000681.
- Barquissau V, Léger B, Beuzelin D, et al. caloric restriction and diet-induced weight loss do not induce browning of human subcutaneous white adipose tissue in women and men with obesity. Cell Rep. 2018;22:1079–1089.
- Mieszek A, Basińska K, Chrząstek K, et al. In vitro and in vivo effects of metformin on osteopontin expression in mice adipose-derived multipotent stromal cells and adipose tissue. J Diabetes Res. 2015;2015:1–16.
- Yousef M, Tsiani E. Metformin in lung cancer: review of in vitro and in vivo animal studies. Cancers (Basel). 2017;9:45.
- Miyoshi H, Kato K, Iwama H, et al. Effect of the anti-diabetic drug metformin in hepatocellular carcinoma in vitro and in vivo. Int J Oncol. 2014;45:322–332.
- Lou YR, Toh TC, Tee YH, et al. 25-Hydroxyvitamin D3 induces osteogenic differentiation of human mesenchymal stem cells. Sci Rep. 2017;7:42816.