
ABSTRACT
Immune cell-mediated adipose tissue (AT) inflammation contributes to obesity-related metabolic disorders, but the precise underlying mechanisms remain largely elusive. In this study, we used the R software to screen key differentially expressed genes (DEGs) in AT from lean and obese individuals and conducted function enrichment analysis. We then analysed their PPI network by using the STRING database. Hub genes were screened by cytohubba plugin. Subsequently, CIBERSORTx was used to predict the proportion of immune cells in AT from lean and obese subjects. Finally, the correlation between hub genes and immune cell proportions was analysed. These studies identified 290 DEGs in the AT between lean and obese subjects. Among them, IL6, CCL19, CXCL8, CXCL12, CCL2, CCL3, CCL4, CXCL2, IL1B, and CXCL1 were proved to be hub genes in regulating the protein-protein interaction (PPI) network. We also found that CXCL8 is positively correlated with resting NK cells, monocytes, activated mast cells, and eosinophils, but negatively correlated with CD8+ T cells and activated NK cells in obese individuals. Taken together, our study identified key genes in AT that are correlated with immune cell infiltration, uncovering potential new targets for the prevention and treatment of obesity and its related complications via regulating the immune microenvironment.
Introduction
Obesity, which increases the risks for many metabolic dysfunctions including insulin resistance (IR) and type 2 diabetes mellitus (T2DM), has now become a global epidemic [Citation1]. Accumulating evidence has revealed that obesity-induced low-grade chronic inflammation in AT plays a vital role in the progression of obesity and its related metabolic complications [Citation2–4]. Numerous studies have shown that adipose-resident immune cells, such as T cells and macrophages, greatly contribute to adipose inflammation in obese humans and animals [Citation5–8], which highlights the importance of maintaining the immune homoeostasis of AT and provides a potential therapeutic target for preventing obesity-associated diseases. However, the precise molecular mechanisms in recruiting the immune cells in AT in the context of obesity are still waiting for a full elucidation.
In this study, we used bioinformatic analysis to screen genetic alternation in the subcutaneous AT of obese individuals and identified several top-changed differentially expressed genes (DEGs) whose role in obesity is not clear. The Gene Ontology (GO) and the Kyoto Encyclopaedia of Genes and Genomes (KEGG) enrichment analyses of DEGs suggested the vital role of pathways including immune response and extracellular matrix (ECM) organization in the progression of obesity. We also screened several hub genes and analysed their correlation with immune cell proportions in AT of obese subjects. Our study revealed potential key genes and molecular mechanisms underlying obesity.
Results
Identification of 290 DEGs in adipose tissue between lean and obese individuals
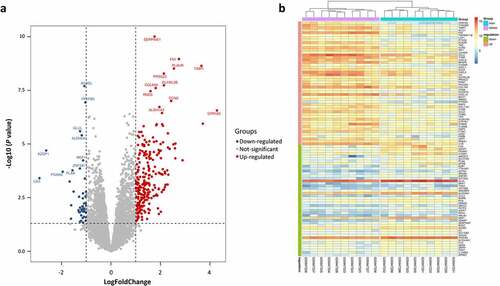
After normalization of the microarray data from GSE2508, DEGs were screened based on defined criteria. A total of 290 DEGs including 245 up-regulated genes and 45 down-regulated genes were detected in obese individuals compared with lean individuals. The most significantly up-regulated and down-regulated genes were GPR183 (logFC = 4.28) and CA3 (logFC = −2.89). GPR183 is a newly identified gene that dramatically increased in AT of obese patients whose role in obesity is unknown. The lower expression of CA3 in obese AT is consistent with previous findings [Citation9]. Other top changed DEGs such as SERPINE1, FN1, TIMP1, AZGP1, and ACADL were shown in ), and the expression of the top 50 up-regulated DEGs and all down-regulated DEGs in each sample was visualized in ).
Figure 1. Differentially expressed genes (DEGs) between lean and obese individuals. (a) Volcano plot of all DEGs. Data points in red are up-regulated genes, and in blue are down-regulated genes. The top up-regulated and down-regulated genes are shown. (b) A Heatmap of the top 50 up-regulated DEGs and all down-regulated DEGs are shown.
DEGs are highly enriched in pathways involved in inflammation and extracellular matrix organization
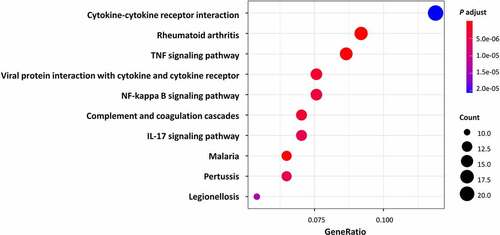
All DEGs were subjected to GO and KEGG pathway enrichment analysis. The results of GO enrichment indicated that for biological processes analysis, DEGs were mainly enriched in leukocyte migration, ECM organization, and extracellular structure organization ( and ). As for cellular components analysis, DEGs were enriched in the collagen-containing extracellular matrix, external side of the plasma membrane, and endoplasmic reticulum lumen ( and ). For molecular functions, DEGs were predominantly enriched in receptor-ligand activity, signalling receptor activator activity, and cell adhesion molecule binding ( and ). The results of KEGG pathway enrichment indicated that the DEGs were mainly enriched in cytokine-cytokine receptor interaction, IL-17 signalling pathway, TNF signalling pathway, and NF-kappa B signalling pathway, as well as pathways including Rheumatoid arthritis and some infective diseases, for instance, the Malaria, Pertussis, and Legionellosis. ( and ). Altogether, the DEGs of AT between lean and obese individuals are mostly enriched in the pathways associated with inflammation and ECM organization demonstrated by GO and KEGG analysis.
Table 1. Top Gene Ontology (GO) enrichment analysis of different genes expression.
Table 2. Top KEGG enrichment analysis of different genes expression.
Figure 2. Gene Ontology (GO) enrichment analysis of all DEGs. The bubble shows the top 10 significant items according to the adjust P-value. BP, biological processes; CC, cellular components; MF, molecular functions.
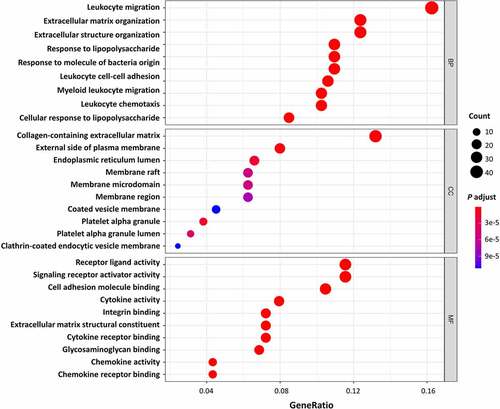
Figure 3. Kyoto Encyclopaedia of Genes and Genomes (KEGG) enrichment analysis of DEGs. Bubble shows the top 10 significant items according to the adjust P-value.
PPI network construction, module analysis and hub genes selection
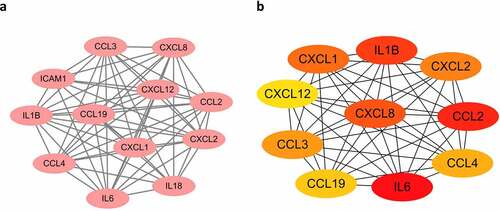
As shown in , the PPI network of DEGs was generated and visualized in Cytoscape software based on the results obtained from the STRING database, which includes 169 nodes (genes) and 458 edges (interactions). The top significant module was identified by MOCEDE, which contains 12 nodes (MOCEDE score = 11.273, )). The top 10 hub genes were selected by the MCC method in the Cytohubba plug-in, which are IL6, CCL19, CXCL8, CXCL12, CCL2, CCL3, CCL4, CXCL2, IL1B, and CXCL1 (). All of them are chemokines and cytokines, which highlight the immune dysfunction as a key point in obesity. Investigating the correlation between these hub genes and immune infiltration is necessary and requires further exploration.
Figure 4. Protein-protein international network. Red represents up-regulated genes, blue represents down-regulated genes.
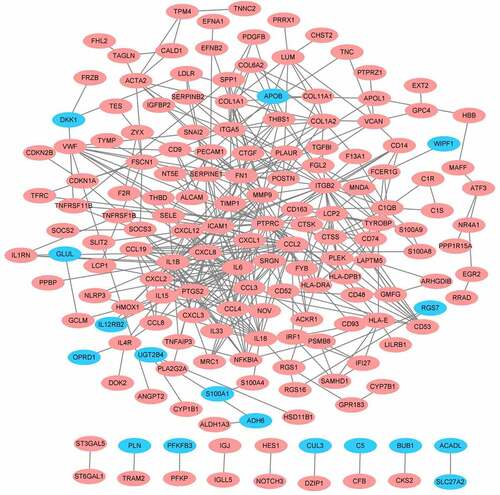
Figure 5. Modules and hub genes analysis. (a) Top 1 module of the PPI network is identified and visualized, all of them are up-regulated genes. (b) Top 10 hub genes of PPI network. Node colour reflects the degree of connectivity (Red colour represents a higher degree, and yellow colour represents a lower degree).
Analysis of immune cell proportion in adipose tissue
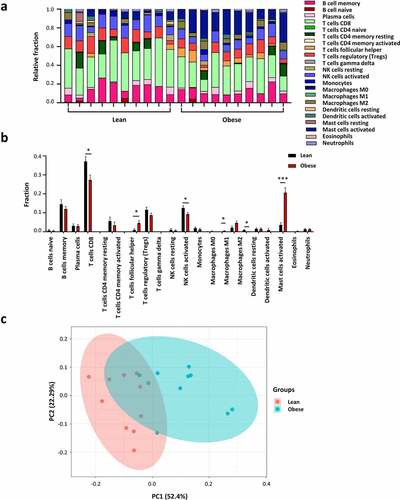
Adipose depots show high cellular heterogeneity [Citation10]. Over 15 populations of immune cells were identified in AT, and these immune cells participate in regulating the development and function of AT [Citation11]. Investigating the changes in immune cell proportions or functions will be helpful in understanding the role of AT immunity in obesity. Then, we analyzed the difference in immune cell populations in AT from lean and obese subjects by the CIBERSORTx algorithm (. To be noted, the 20 samples uploaded to CIBERSORTx did not match the generally accepted P-value <0.05. However, we consider the results drawn from CIBERSORTx to be reliable to some extent. Briefly, the quality of our data is high and PCA analysis exhibits distinct groups of integral gene expression (Fig. S1) and immune cell populations ()). Additionally, the results from CIBERSORTx are consistent with those from other studies [Citation8,Citation12,Citation13]. Obese individuals showed higher proportions of M1 macrophages, activated mast cells, and follicular helper CD4+ T (Tfh) cells. A negative correlation was observed between obesity and several cell types including CD8+ T cells, activated NK cells, and resting dendritic cells. However, our results showed no significant change in the proportion of M2 macrophages even though there is a trend of increase ()), which could attribute to the small sample size and the differences within the group.
Figure 6. Immune cell proportions in adipose tissue from lean and obese individuals. (a) The stacked bar chart shows the proportion of immune cell populations in each sample. (b) The bar chart exhibits the difference of immune cell proportions in lean and obese subjects. (c) Principal component analysis (PCA) is performed on all samples. *p < 0.05, **p < 0.01, and ***p < 0.001.
The correlation analysis of hub genes with immune cell populations in adipose tissues of obese individuals
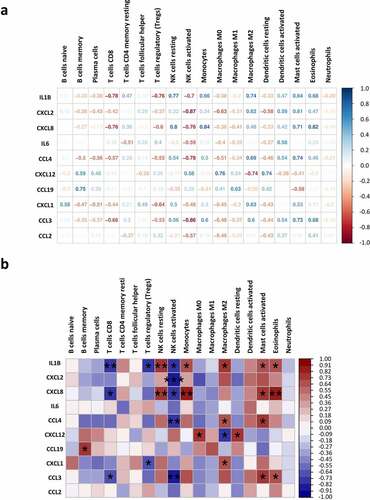
All of the hub genes identified in ) are higher expressed in the AT of obese individuals. The association between these hub genes and the proportions of immune cells in AT were analysed by correlation analysis (). We found that IL1B is negatively associated with the proportions of CD8+ T cells (r = −0.78, p < 0.01), regulatory T (Treg) cells (r = −0.76, p < 0.05) and activated NK cells (r = −0.7, p < 0.05), but positively related to resident NK cells (r = 0.77, p < 0.01), monocytes (r = 0.66, p < 0.05), M2 macrophages (r = 0.74, p < 0.05), activated mast cells (r = 0.64, p < 0.05) and eosinophils (r = 0.68, p < 0.05). CXCL2 showed a negative correlation with activated NK cells (r = −0.87, p < 0.001).CXCL8 is positively correlated with the proportions of resting NK cells (r = 0.8, p < 0.01), monocytes (r = 0.84, p < 0.01), activated mast cells (r = 0.71, p < 0.05), and eosinophils (r = 0.82, p < 0.01). CCL4 showed positive correlation with M2 macrophage (r = 0.66, p < 0.05) and activated mast cells (r = 0.74, p < 0.05), but negatively correlated with activated NK cells (r = −0.78, p < 0.01). Moreover, CXCL12 is positively correlated with M0 macrophage (r = 0.76, p < 0.05) and resting dendritic cells (r = 0.74, p < 0.05). The expression level of CXCL1 is positively correlated with M2 macrophage (r = 0.63, p < 0.05) and negatively with Tregs (r = −0.64, p < 0.05). Another hub gene negatively associated with CD8+ T cells (r = −0.66, p < 0.05) and activated NK cells (r = −0.86, p < 0.01) is CCL3. The negative regulation effect of several hub genes in CD8+ T cells and activated NK cells may contribute to the lower proportions of them in obese AT as exhibited before ()).
Figure 7. Correlation index between the expression of hub genes and proportions of immune cells in the obese group. (a) Numbers represent the correlation index. (b) Correlations represented by colour and statistic differences are shown. *p < 0.05, **p < 0.01, and ***p < 0.001.
Discussion
In this study, we identified and analysed 290 DEGs in AT between lean and obese subjects from the GSE2508 microarray dataset in GEO. As demonstrated by GO and KEGG enrichment analysis (), these DEGs were mainly correlated to immune responses, ECM organization, and infective diseases. We further identified IL6, CCL19, CXCL8, CXCL12, CCL2, CCL3, CCL4, CXCL2, IL1B, and CXCL1 as the hub genes that play vital roles in the pathogenesis of obesity. Moreover, our results suggested a negative correlation of CXCL8 with CD8 + T cells and activated NK cells, and a positive correlation between them with resting NK cells, monocytes, activated mast cells, and eosinophils. In this paper, we uncovered several genes that may play central roles in regulating the immune infiltration in AT during the progression of obesity, which suggests possible novel targets for the future research or treatment of obesity in humans.
Although the correlations between most of the DEGs we identified in this study and obesity are well-established, such as SERPINE1, PLAUR, CA3, and TIMP1 [Citation9,Citation14–16]. However, the function of other DEGs like GPR183 and PGAM2 in the progress of obesity is lacking and remains to be explored. GPR183 encodes G protein-coupled receptor 183, which is one of the receptors of oxysterols and has been reported to be induced in the liver by high-fat diet feeding [Citation17]. The well-known role of GPR183 is to regulate lymphoid cell migration and activity [Citation18,Citation19]. However, no one revealed its function in AT. We proposed the possibility that upregulated GPR183 may contribute to recruiting immune cells in AT under obesity conditions due to its crucial role in immune modulation. PGAM2 encodes the key enzyme that participates in the glycolytic pathway and is highly expressed in heart tissue. Since the glycolytic beige fat has been emphasized in promoting energy metabolism and thermogenesis [Citation20], regulating glycolysis in AT via targeting PGAM2 could be a potential approach for obesity treatment. But all these possibilities need to be validated by future studies.
Enrichment analysis showed that significantly changed pathways are associated with immune response and ECM organization, for example, leukocyte migration, cell chemotaxis, extracellular structure organization, and ECM structural constituent. Our results confirmed the vital role of immunity and inflammation in the pathogenesis of obesity [Citation21]. The dysregulation of immunity makes obese individuals suffer from persistent local and systematic low-grade inflammation. When these patients are faced with pathogens invasion, amounts of immune cells already existing in AT could trigger an excessive immune response and consequently induce the cytokine storm. These findings may partly explain why obesity is a risk factor for worse COVID-19 outcomes [Citation22] and other infective diseases like malaria, pertussis, and legionellosis as shown in KEGG results (). Meanwhile, we found ECM-related pathways occupies a large proportion in the results of GO analysis. During the obesity progression, AT undergoes dynamic remodelling which is composed of adipocyte expansion, immune cell accumulation, angiogenesis, collagen deposition, and fibrosis [Citation23], most of which required ECM reorganization. Extra and abnormal deposition of ECM components may cause adipocyte necrosis and damage-associated molecular patterns (DAMPs) release, which will subsequently induce adipose inflammation and insulin resistance [Citation23]. Hence, the regulation of ECM organization is essential for the treatment of chronic low-grade inflammation in obesity and its related complications.
AT is an energy-storage and endocrine organ, but also an immune organ [Citation24]. A wide range of immune cells is involved in AT development and homoeostasis. Although CD8+ T cells exert important roles in the initiation and propagation of AT inflammation and remodelling during obesity [Citation25], it is suggested that a high-fat diet reduces the total numbers and anti-tumour activities of CD8+ T cells in the tumour microenvironment [Citation26]. Our study showed a reduced proportion of CD8+ T cells in AT from obese individuals compared to lean individuals, which may result from less CD8+ T cell accumulation in the late stage of obesity. Our results also showed more mast cells in the AT of obese subjects. It’s interesting given that mast cells have previously been shown to affect ECM remodelling and promote inflammatory cell recruitment and proliferation [Citation27]. Meanwhile, accumulated mast cells in AT are regarded as critical contributors to obesity [Citation28], which is in agreement with our findings. Tfh cells are important for germinal centre formation and maintenance [Citation29]. Dysregulated Tfh cells in the intestine lead to microbiota dysbiosis and enhanced lipid absorption, which contribute to increased obesity [Citation30]. No information is currently available on the role of Tfh cells in AT. We propose that, unlike Tfh in the intestine, Tfh cells may exert a detrimental role in AT homoeostasis. Further investigation would be needed to fully address this issue. Despite lower frequencies and reduced cytotoxic abilities of NK cells being observed in the blood of obese than in lean subjects [Citation31], high-fat diet feeding increased NK cell numbers in epididymal AT and led to insulin resistance in animal models [Citation32]. However, activated NK cells were downregulated in obesity in our result, suggesting a potential difference in NK cell regulation between humans and mice.
To explore the key factors that participate in regulating the immune microenvironment and deteriorating immune dysfunction in obese patients, we screened out the top 10 hub genes including IL6, CCL19, CXCL8, CXCL12, CCL2, CCL3, CCL4, CXCL2, IL1B, and CXCL1 ()) and analysed their correlation with immune infiltration in AT. Some of the hub genes have already been studied in obesity. And our results are consistent with these findings, proving high reliability for our subsequent correlation analysis. All of the hub genes are significantly upregulated in the AT of obese subjects, and several of them were top changed DEGs as shown in the heatmap ()). The most significant hub gene identified in our study was IL6, which exerts pleiotropic roles in inflammation and metabolic diseases [Citation33]. Previous studies suggest that IL-6 is a proinflammatory cytokine that plays an important role in white adipose tissue dysfunction and hepatic insulin resistance [Citation12,Citation34], which was consistent with our results. But we failed in linking IL6 with immune infiltration due to its major role in aggravating inflammation but not attracting cells. Other chemokines, for instance, IL1B, CXCL8, CCL4, CXCL12, CCL19, CXCL1, and CCL3 exhibited positive or negative correlations with the proportions of some immune cells. CXCL8 expression is upregulated in AT of obese individuals, which induces chemotaxis of neutrophils and other granulocytes to AT [Citation13,Citation35]. CXCL12 could promote cancer progression and is a potent chemoattractant for haematopoietic cells [Citation36].
CXCL8 is largely produced by immature noncytolytic NK cells and regulates early NK cell differentiation [Citation37]. Tumour-infiltrating monocytes also secret CXCL8, which is positively associated with human hepatocellular carcinoma [Citation38]. In addition, CXCL8 produced by circulating eosinophils also contributes to the airway inflammatory responses within allergic lesions [Citation39]. However, to our knowledge, the roles of CXCL8 within NK cells, monocytes, and eosinophils in the progression of obesity have not yet been identified. Our results propose that CXCL8 may be a potential target of obesity in these cells. CXCL12 has been reported as an adipokine that recruits macrophages to AT and induces obesity-related inflammation and systematic insulin resistance [Citation40]. The proinflammatory property of CXCL12 is inversely correlated with M2 macrophages ().
This study also has some limitations. Firstly, the sample size was relatively small, although part of the results could be validated by others’ reports. Secondly, the parameters of specific individuals were not offered. Lastly, our results still need future experiments to uncover the role of these genes in the pathogenesis of obesity and to explore their possibilities as therapeutic targets for obesity. Nevertheless, we comprehensively studied the correlation between gene expression and immune cell populations in AT of lean and obese individuals. Through this bioinformatic analysis, we identified several unreported genes that are closely related to obesity and revealed unrecognized molecular mechanisms in immune cells infiltration during obesity, which may provide potential cellular and molecular targets to be explored for their roles in the progression of obesity.
Materials and methods
Microarray data
We downloaded the gene expression dataset GSE2508, which contains a total of 20 human white AT samples from lean (BMI≤30, n = 10) and obese (BMI>30, n = 10) individuals [Citation41], from the Gene Expression Omnibus (GEO) database (https://www.ncbi.nlm.nih.gov/geo/), a public functional genomic data repository. The microarray data of the GSE2508 dataset was identified by GPL8300 platforms (HG_U95Av2; Affymetrix Human Genome U95 Version 2 Array).
Identification of differentially expressed genes
After annotating the dataset with the R script in R 4.0.0 software (https://www.r-project.org/), we used the ‘limma’ V3.44.3 package to screen DEGs in AT between lean and obese individuals [Citation42]. The data were first normalized using the ‘normalize Between Arrays’ function from ‘limma’ (Fig. S2). The t-test and eBayes methods were then used to calculate the fold change (logFC) and the P-value [Citation43]. Lastly, significantly changed DEGs were identified using the cut-off thresholds of |logFC| >1 and p < 0.05. The ‘pheatmap’ V1.0.12 package was used to draw a heatmap of top 50 up-regulated and all down-regulated DEGs in R software. The volcano of DEGs was visualized by ‘ggplot2’ V3.3.2 package.
Function and pathway analysis of DEGs
GO analysis offers a model that categorizes gene function into three parts: biological processes, cellular components, and molecular functions [Citation44]. The KEGG is a database that provides a comprehensive set of bio-interpretation of genomic sequences and protein interaction network information [Citation45]. In our study, GO and KEGG analyses of DEGs were completed by ‘clusterProfiler’ V3.16.0 package [Citation46].
Construction of protein-protein interaction (PPI) network, module analysis and identification of hub genes
The Search Tool for the Retrieval of Interacting Genes (STRING 11.0; https://string-db.org/) is an online tool to predict the interactions of genes at the protein level, including direct (physical) and indirect (functional) interactions [Citation47]. The PPI network of DEGs was constructed with a high confidence > 0.7. Subsequently, the PPI network was visualized in Cytoscape software 3.8.0 (https://cytoscape.org/) [Citation48]. The significant modules of the PPI network were selected by Molecular Complex Detection (MCODE) V1.6.1 plug-in with the default parameters (degree cut-off, 2; K-Core, 2; max depth, 100; node score cut-off, 0.2) [Citation49]. Moreover, cytohubba, another plug-in in Cytoscape, was used to explore important nodes with 11 methods (the MCC method is widely used and meets a satisfying comparative performance), subsequently for studying hub genes [Citation50].
Immune cells proportion analysis
CIBERSORTx is an online analytical tool that estimates the relative levels of 22 phenotypes of human haematopoietic cells in a mixed cell population using gene expression data [Citation51]. Gene expression data was uploaded to CIBERSORTx (https://cibersortx.stanford.edu/), then the algorithm was run using signature matrix LM22 provided by CIBERSORTx and 500 permutations. Principal component analysis (PCA) was performed by ‘ggplot2’ V3.3.2 package to determine whether different immune cell populations existed between the two groups.
Author contributions
J.W.: analyzed and assembled data and prepared the first draft of the manuscript, L.W.: contributed to conceptualization, data analysis, and validation, and contribute to the manuscript review and editing. All authors reviewed and approved the manuscript.
Statistical analysis
A two-tailed Student’s t-test was used to evaluate the differences in immune cell proportions in AT between lean and obese individuals. The correlation between the expression of hub genes and the population of immune cells in obese subjects was calculated by Pearson correlation analysis.
Informed consent statement
No informed consent was required because this study does not contain human or animal participants.
Supplemental Material
Download PDF (169.2 KB)Acknowledgments
We thank the authors who deposited their microarray dataset, GSE2508, into the public GEO database.
Disclosure statement
The authors declare that the research was conducted in the absence of any commercial or financial relationships that could be construed as a potential conflict of interest.
Data availability statement
The datasets generated and/or analyzed during the current study are available in the GEO database (https://www.ncbi.nlm.nih.gov/geo/query/acc.cgi?acc=GSE2508). Data are available upon request to the corresponding author.
Supplementary material
Supplemental data for this article can be accessed online at https://doi.org/10.1080/21623945.2022.2104512
Additional information
Funding
References
- Ng M, Fleming T, Robinson M, et al. Global, regional, and national prevalence of overweight and obesity in children and adults during 1980–2013: a systematic analysis for the Global Burden of Disease Study 2013 [J]. Lancet. 2014;384(9945):766–781.
- Lumeng CN, Saltiel AR. Inflammatory links between obesity and metabolic disease [J]. J Clin Invest. 2011;121(6):2111–2117.
- Winer DA, Winer S, Dranse HJ, et al. Immunologic impact of the intestine in metabolic disease [J]. J Clin Invest. 2017;127(1):33–42.
- Xu H, Barnes GT, Yang Q, et al. Chronic inflammation in fat plays a crucial role in the development of obesity-related insulin resistance [J]. J Clin Investig. 2003;112(12):1821–1830.
- Weisberg SP, Mccann D, Desai M, et al. Obesity is associated with macrophage accumulation in adipose tissue [J]. J Clin Investig. 2003;112(12):1796–1808.
- Hotamisligil GS. Inflammation, metaflammation and immunometabolic disorders [J]. Nature. 2017;542(7640):177–185.
- Zhou H, Liu F. Regulation, communication, and functional roles of adipose tissue-resident CD4(+) T cells in the control of metabolic homeostasis [J]. Front Immunol. 2018;9:1961.
- Wu H, Ballantyne CM. Metabolic inflammation and insulin resistance in obesity [J]. Circ Res. 2020;126(11):1549–1564.
- Alver A, Keha E, Uçar F, et al. The effect of carbonic anhydrase inhibition on leptin secretion by rat adipose tissue [J]. J Enzyme Inhib Med Chem. 2004;19(2):181–184.
- Corvera S. Cellular heterogeneity in adipose tissues [J]. Annu Rev Physiol. 2021;83:257–278.
- Stolarczyk E. Adipose tissue inflammation in obesity: a metabolic or immune response? [J]. Curr Opin Pharmacol. 2017;37:35–40.
- Ouchi N, Parker JL, Lugus JJ, et al. Adipokines in inflammation and metabolic disease [J]. Nat Rev Immunol. 2011;11(2):85–97.
- Sindhu S, Kochumon S, and Thomas R, et al. Enhanced adipose expression of interferon regulatory factor (IRF)-5 associates with the signatures of metabolic inflammation in diabetic obese patients [J]. Cells. 2020;9(3):730.
- Eriksson P, Reynisdottir S, Lönnqvist F, et al. Adipose tissue secretion of plasminogen activator inhibitor-1 in non-obese and obese individuals [J]. Diabetologia. 1998;41(1):65–71.
- Cancello R, Rouault C, Guilhem G, et al. Urokinase plasminogen activator receptor in adipose tissue macrophages of morbidly obese subjects [J]. Obes Facts. 2011;4(1):17–25.
- Meissburger B, Stachorski L, Röder E, et al. Tissue inhibitor of matrix metalloproteinase 1 (TIMP1) controls adipogenesis in obesity in mice and in humans [J]. Diabetologia. 2011;54(6):1468–1479.
- Huang J, Lee S, Kang S, et al. 7,25-dihydroxycholesterol suppresses hepatocellular steatosis through GPR183/EBI2 in mouse and human hepatocytes [J]. J Pharmacol Exp Ther. 2020;374(1):142–150.
- Emgård J, Kammoun H, García-Cassani B, et al. Oxysterol sensing through the receptor GPR183 promotes the lymphoid-tissue-inducing function of innate lymphoid cells and colonic inflammation [J]. Immunity. 2018;48(1):120–132.e128.
- Choi C, and Finlay D. Diverse immunoregulatory roles of oxysterols-the oxidized cholesterol metabolites [J]. Metabolites. 2020;10(10):384.
- Chen Y, Ikeda K, Yoneshiro T, et al. Thermal stress induces glycolytic beige fat formation via a myogenic state [J]. Nature. 2019;565(7738):180–185.
- Mclaughlin T, Ackerman SE, Shen L, et al. Role of innate and adaptive immunity in obesity-associated metabolic disease [J]. J Clin Invest. 2017;127(1):5–13.
- Mohammad S, Aziz R, Al Mahri S, et al. Obesity and COVID-19: what makes obese host so vulnerable? [J]. Immun Ageing. 2021;18(1):1.
- Lin CT, Kang L. Adipose extracellular matrix remodelling in obesity and insulin resistance [J]. Biochem Pharmacol. 2016;119:8–16.
- Caspar-Bauguil S, Cousin B, Galinier A, et al. Adipose tissues as an ancestral immune organ: site-specific change in obesity [J]. FEBS Lett. 2005;579(17):3487–3492.
- Turbitt W, Buchta Rosean C, Weber K, et al. Obesity and CD8 T cell metabolism: implications for anti-tumor immunity and cancer immunotherapy outcomes [J]. Immunol Rev. 2020;295(1):203–219.
- Ringel AE, Drijvers JM, Baker GJ, et al. Obesity shapes metabolism in the tumor microenvironment to suppress anti-tumor immunity [J]. Cell. 2020;183(7):1848–1866 e1826.
- Shi MA, Shi GP. Different roles of mast cells in obesity and diabetes: lessons from experimental animals and humans [J]. Front Immunol. 2012;3:7.
- Goldstein N, Kezerle Y, and Gepner Y, et al. Higher mast cell accumulation in human adipose tissues defines clinically favorable obesity sub-phenotypes [J]. Cells. 2020;9(6):1508.
- Crotty S. Follicular helper CD4 T cells (TFH) [J]. Annu Rev Immunol. 2011;29:621–663.
- Petersen C, Bell R, and Klag KA, et al. T cell-mediated regulation of the microbiota protects against obesity [J]. Science. 2019;365(6451): eaat9351.
- Tobin LM, Mavinkurve M, and Carolan E, et al. NK cells in childhood obesity are activated, metabolically stressed, and functionally deficient [J]. JCI Insight. 2017;2(24):e94939.
- Lee B-C, Kim M-S, Pae M, et al. Adipose natural killer cells regulate adipose tissue macrophages to promote insulin resistance in obesity [J]. Cell Metab. 2016;23(4):685–698.
- Fuster JJ, Walsh K. The good, the bad, and the ugly of interleukin-6 signaling [J]. EMBO J. 2014;33(13):1425–1427.
- Sabio G, Das M, Mora A, et al. A stress signaling pathway in adipose tissue regulates hepatic insulin resistance [J]. Science (New York, NY). 2008;322(5907):1539–1543.
- Nunemaker CS, Chung HG, Verrilli GM, et al. Increased serum CXCL1 and CXCL5 are linked to obesity, hyperglycemia, and impaired islet function [J]. J Endocrinol. 2014;222(2):267–276.
- Aiuti A, Webb I, Bleul C, et al. The chemokine SDF-1 is a chemoattractant for human CD34+ hematopoietic progenitor cells and provides a new mechanism to explain the mobilization of CD34+ progenitors to peripheral blood [J]. J Exp Med. 1997;185(1):111–120.
- Montaldo E, Vitale C, Cottalasso F, et al. Human NK cells at early stages of differentiation produce CXCL8 and express CD161 molecule that functions as an activating receptor [J]. Blood. 2012;119(17):3987–3996.
- Peng ZP, Jiang ZZ, Guo HF, et al. Glycolytic activation of monocytes regulates the accumulation and function of neutrophils in human hepatocellular carcinoma [J]. J Hepatol. 2020;73(4):906–917.
- Gordon JR, Swystun VA, Li F, et al. Regular salbutamol use increases CXCL8 responses in asthma: relationship to the eosinophil response [J]. Eur Respir J. 2003;22(1):118–126.
- Kim D, Kim J, Yoon J, et al. CXCL12 secreted from adipose tissue recruits macrophages and induces insulin resistance in mice [J]. Diabetologia. 2014;57(7):1456–1465.
- Lee YH, Nair S, Rousseau E, et al. Microarray profiling of isolated abdominal subcutaneous adipocytes from obese vs non-obese Pima Indians: increased expression of inflammation-related genes [J]. Diabetologia. 2005;48(9):1776–1783.
- Ritchie M, Phipson B, Wu D, et al. limma powers differential expression analyses for RNA-sequencing and microarray studies [J]. Nucleic Acids Res. 2015;43(7):e47.
- Smyth GK. Linear models and empirical bayes methods for assessing differential expression in microarray experiments [J]. Stat Appl Genet Mol Biol. 2004;3(1):1–25.
- Consortium GO. The Gene Ontology (GO) project in 2006 [J]. Nucleic Acids Res. 2006;34( Databaseissue):D322–326.
- Kanehisa M, Goto S. KEGG: Kyoto encyclopedia of genes and genomes [J]. Nucleic Acids Res. 2000;28(1):27–30.
- Yu G, Wang LG, Han Y, et al. clusterProfiler: an R package for comparing biological themes among gene clusters [J]. OMICS. 2012;16(5):284–287.
- Szklarczyk D, Gable AL, Lyon D, et al. STRING v11: protein-protein association networks with increased coverage, supporting functional discovery in genome-wide experimental datasets [J]. Nucleic Acids Res. 2019;47(D1):D607–D613.
- Shannon P, Markiel A, Ozier O, et al. Cytoscape: a software environment for integrated models of biomolecular interaction networks [J]. Genome Res. 2003;13(11):2498–2504.
- Bader G, Hogue C. An automated method for finding molecular complexes in large protein interaction networks [J]. BMC Bioinformatics. 2003;4:2.
- Chin C, Chen S, and Wu H, et al. cytoHubba: identifying hub objects and sub-networks from complex interactome [J]. BMC Syst Biol. 2014;8 (Suppl 4) ;S11.
- Newman AM, Liu CL, Green MR, et al. Robust enumeration of cell subsets from tissue expression profiles [J]. Nat Methods. 2015;12(5):453–457.