
 ?Mathematical formulae have been encoded as MathML and are displayed in this HTML version using MathJax in order to improve their display. Uncheck the box to turn MathJax off. This feature requires Javascript. Click on a formula to zoom.
ABSTRACT
Adipose tissue plays a crucial role in metabolic syndrome, autoimmune diseases, and many cancers. Because of adipose’s role in so many aspects of human health, there is a critical need for in vitro models that replicate adipose architecture and function. Traditional monolayer models, despite their convenience, are limited, showing heterogeneity and functional differences compared to 3D models. While monolayer cultures struggle with detachment and inefficient differentiation, healthy adipocytes in 3D culture accumulate large lipid droplets, secrete adiponectin, and produce low levels of inflammatory cytokines. The shift from monolayer models to more complex 3D models aims to better replicate the physiology of healthy adipose tissue in culture. This study introduces a simple and accessible protocol for generating adipose organoids using a scaffold-free spheroid model. The method, utilizing either 96-well spheroid plates or agarose micromolds, demonstrates increased throughput, uniformity, and ease of handling compared to previous techniques. This protocol allows for diverse applications, including drug testing, toxin screening, tissue engineering, and co-culturing. The choice between the two methods depends on the experimental goals, with the 96-well plate providing individualized control and the micromold offering scale advantages. The outlined protocol covers isolation, expansion, and characterization of stromal vascular fraction cells, followed by detailed steps for spheroid formation and optional downstream analyses.
Introduction
The overall understanding of adipose tissue has grown exponentially from the initial idea of simply storing and mobilizing energy through triglycerides to the knowledge of its critical role in metabolic syndrome [Citation1,Citation2], autoimmune diseases [Citation3], cardiovascular disease [Citation4], and cancers [Citation5,Citation6]. With more than two in five adults in the US with obesity, it is important to develop models for not only understanding how ‘healthy’ adipose tissue performs physiologically, but also how outside factors such as pre-existing diseases, diet, drugs and toxicants alter the physiologic function of adipose tissue. In addition to studying adipose tissue directly, obesity influences the biology of cancer, immunology, and reproductive health. Thus, it is critical for researchers to have the tools necessary to unravel the complex and dynamic ways excess and dysfunctional adipose tissue influences other tissues and cell types.
Conventional monolayer models of adipocyte differentiation are convenient but severely limited. The majority of 2D (i.e. monolayer) cultures have utilized 3T3-L1 cells, a line of mouse fibroblasts found capable of differentiating into adipocytes [Citation7]. Human preadipocyte lines (e.g. NPADs [Citation8]), primary stromal vascular fraction-derived preadipocytes, and mesenchymal stromal cells (MSCs) [Citation9] have also been used and are capable of differentiating in 2D. However, 2D cultures are inherently limited. Differentiation in 2D tends to be highly heterogenous with only a minority of cells actually differentiating into lipid-rich cells. In addition, 2D cultures are difficult to maintain in culture as they tend to detach from the culture plate as lipids accumulate and the cell sheet becomes buoyant. In addition to these limitations in efficiency, 2D versus 3D comparisons have shown that 2D differentiated adipocytes have significant functional differences. Healthy adipose tissue contains insulin-sensitive cells with large unilocular lipid droplets that produce high levels of hormones, such as adiponectin and leptin [Citation1] with low levels of pro-inflammatory cytokines [Citation10]. In contrast, monolayer cultures have decreased production of adiponectin and leptin, and an overall pro-inflammatory microenvironment [Citation10]. The shift towards more complex 3D models is motivated by a need to better mimic healthy adipose tissue in culture.
In the past 10 years, several new models of adipose tissue have been developed with varying degrees of complexity [Citation11]. Many of these models support the 3D environment through the use of scaffolds, such as silk [Citation12,Citation13], Matrigel [Citation14] or Geltrex [Citation15], collagen [Citation16], and fibrinogen [Citation17]. More recently, efforts have been made to increase the complexity of adipose models by including other cell lineages that are found in native adipose tissue. Protocols have been developed that incorporate endothelial cells [Citation16,Citation18] or immune cells [Citation19] to better mimic the heterogeneity of cell types found in adipose. Increasing in complexity yet again are approaches that use microfluidics chips that compartmentalize small volumes of cells and reagents and allow precise control of nutrient transport to the engineered tissue [Citation20,Citation21]. While each of these approaches represents an improvement in physiological relevance over conventional monolayer culture, which approach to select depends upon the goal of the investigation. While fascinating in their own right, some methods require specialized technologies, expertise, or resources that limit them from wide adoption by the broader community of biomedical researchers. In addition, techniques that require specialized equipment, like microfluidic platforms, are inherently low throughput and not amendable to research questions that require analysing samples at scale.
We sought to develop a protocol that would consistently generate adipose organoids for research that would be accessible to biomedical researchers with diverse backgrounds and technical capabilities. To this end, we established a scaffold-free spheroid model for the adipogenic differentiation of both adipose-derived mesenchymal stem cells and immortalized preadipocyte cell lines [Citation10]. In our original published report [Citation10], spheroids were formed using a hanging-droplet technique, transferred to ultra-low attachment plates, and then differentiated for up to 7 weeks in culture. An in-depth characterization of the phenotypic progression of the cells throughout their differentiation was performed in direct comparison to monolayer format. This revealed significant increases in production of adiponectin secretion and expression of PPAR-γ and FABP4, hallmarks of adipogenesis. In addition, spheroid cultures developed large unilocular droplets >20 µm in diameter [Citation10]. We have since used this method to uncover novel ways in which secreted factors from adipocytes alter fibroblast behaviour [Citation22,Citation23]. In addition, this technique has been adapted by other groups to investigate differences between spheroid and monolayer phenotypes in different species and cell types [Citation24] and to incorporate immune cells [Citation19].
In comparison to other methods that rely on biomaterial scaffolds or specialized equipment, our method is relatively simple. This simplicity is an intentional feature as it is what has allowed us to successfully transfer the method to multiple collaborating labs. Another advantage is the access to the spheroids that our method permits, allowing monitoring and easy assessment of differentiation and function using multiple methods. Phase-contrast microscopy can be used to monitor spheroid growth during differentiation and is aided by the known location of spheroids in each well which facilitates serial imaging of the same spheroid over time. The media can be continually sampled to assess for viability markers (e.g. LDH, ATP) or adipokine production (e.g. adiponectin, leptin) and the spheroids themselves can be collected for downstream applications or analysis without the need to disassemble a microfluidic chip or digest a biomaterial. Thus, collection of RNA for gene expression analysis or transfer of spheroids to co-cultures with other cell or organoid types can easily be performed.
Although the hanging-drop technique was effective, it had significant drawbacks that prompted us to explore new options for spheroid formation. Hanging-drop cultures required hand picking individual spheroids with a pipette which was time-consuming and once transferred to ultra-low attachment plates, the spheroids were prone to fusing together, which caused significant changes in their adipokine production. To reduce the amount of manual handling and transfer of the spheroids and to keep spheroids from fusing together, we now use one of two methods: Option A − 96-well spheroid plates or Option B – Microtissue© agarose micromolds. This shift has increased spheroid formation throughput, increased spheroid uniformity, and reduced the skilfulness required to generate consistent spheroids. Our new methods require minimal handling, can easily be scaled, allow access to the spheroids, and can readily be performed in a typical biomedical or biomolecular research lab. Both of these methods can be used for a wide variety of studies such as drug testing, toxicant screening, tissue engineering, and co-culturing with other cell types and organoids within microphysiological systems.
Whether the 96-well spheroid plate or micromold method is most appropriate depends on the specific experimental question and goal as both techniques have advantages and disadvantages. The major advantage of the 96-well spheroid plate is that each spheroid is individually seeded and isolated from its neighbours. This affords three advantages. First, the spheroids size can be tightly controlled y the precise number of cells added to each well. Consistency of size leads to reduced variability in outcomes which is critical for studies where adipose response to chemicals, drugs, proteins, or conditioned media is being evaluated. Second, spheroids in the 96-well plate lend themselves well to screening without consuming large quantities of reagents. In addition to being isolated in relatively small wells, spheroids in the 96-well spheroid plate do not need to be transferred from plate to plate. This overcomes a major challenge of alternative techniques that generate spheroids in bulk, in hanging drop or micromolds, and then transfer to 96 well plates for analysis, as the transfer process is slow and error prone. Manually counting and depositing spheroids relies on excellent eye site and dexterity with a pipette and leads to wells having other than one spheroid per well. With the 96-well spheroid plate all transfers are eliminated as the spheroids are formed in the well, differentiate in the well, and are analysed in the well. Finally, the 96-well spheroid plate eliminates the risk of spheroids fusing together which alters their functionality. Spheroids cultured in bulk in larger format ULA plates or even in micromolds will frequently come into contact with each other and fuse. This fusion changes the dynamics of nutrient diffusion in and out of the avascular spheroids and generally alters adipocyte function. If undetected, this change in signalling due to fusion can lead to faulty interpretation of experimental results. The main drawback of the 96-well spheroid plate is the limited scale of spheroid production.
For applications that require 100s-1000s of spheroids or large amounts of biological material (RNA, conditioned media, exosomes, etc.) alternative methods like the agarose micromold or even agarose stamp [Citation25] methods developed for other spheroid applications may be more desirable. The major advantage of the agarose micromold is scale. If using the standard 35 spheroid micromold, each 24-well plate will generate 840 spheroids making it easy to produce large amounts of biological material for tissue engineering applications or analysis. In addition, this scale is achieved for relatively low cost compared to the 96-well spheroid plates. While each 96-well spheroid plate can cost upwards of $30 each, micromolds are housed in inexpensive multiwell plates that cost as little as $1–2 a piece. It does take more time to make micromolds on the front end, but this is made up for with the relative ease of media changes and collecting spheroids at the end of differentiation where 35 spheroids are collected at a time. Because of their scale, micromolds are often preferred for applications that require collection of RNA. Since it is more difficult to extract RNA from the spheroids compared to 2D cultures, the extra total mass of spheroids helps to overcome the inefficiencies of the process and ensures enough material is available for both RNA quality assessment and analysis of multiple genes of interest. The main drawback to micromolds is the loss of individualized control of spheroids. In contrast to the 96-well spheroid plate where each spheroid is individually seeded with a precise number of cells, all 35 wells of the micromold are seeded at once with a single suspension of cells. Thus, the average number of cells per spheroid can be controlled, but the number of cells per spheroid throughout the microwell has higher variability ().
Herein we outline a complete protocol for forming adipose spheroids using both methods. While many will choose to purchase adipose MSCs from commercial vendors or use immortalized cell lines [Citation8], Steps 1–36 outline the process of isolating stromal vascular fraction (SVF) cells from adipose tissue, culture expanding them, and characterizing them for MSC markers. We then outline the steps for forming adipose spheroids using either the 96-well spheroid plate method (Option A: Steps 37–43) or the Agarose Micromold method (Option B: Steps 44–55). Finally, we conclude with steps to facilitate optional downstream analysis of the spheroids using imaging (Steps 56–62), collection of RNA for gene expression analysis (Steps 63–71), and analysis of adipocyte secretome (Steps 72–74). Throughout the protocol critical steps and stop points are highlighted.
Materials
a) Reagents
Methods
Isolation of Stromal Vascular Fraction from Adipose Tissue
DAY 1 (3 hours)
Collect adipose containing tissue from animal or human surgical discard in compliance with local ethics boards and place in sterile PBS for transport to lab.
In a biosafety cabinet, soak tissue in Betadine for 10 seconds to decontaminate exterior then wash 2× with sterile PBS to remove residual Betadine.
In a new sterile 150 mm dish, use a scalpel to isolate the adipose tissue and discard any non-adipose tissue.
Use sterile forceps and scissors to finely mince the tissue into <5 mm pieces. CRITICAL STEP If tissue is not minced finely, the yield of cells after digestion will be low.
Prepare 1000 U/mL collagenase I by weighing out collagenase into 50 mL tube. You will need about 45 mL for the 150 mm plate. Add the DMEM or MEM Alpha (no FBS, you can add P/S) in the hood. Mix by inverting the tube. The collagenase should dissolve quickly. Filter sterilize through a 0.22 mm filter.
Add the collagenase containing media to the minced fat in the 150 mm dish. Mix and incubate at 37°C in a cell culture incubator. You can swirl occasionally and/or pipette after a couple of hours using a wide-bore pipette. It is critical to have complete digestion.
Digest overnight at 37°C.
DAY 2 (3–6 hours)
(8) In the biosafety cabinet, pipet up and down the contents of the dish vigorously with a 25 mL pipet. There pipette should not clog with tissue pieces, as the tissue should be digested and the pieces should be very small from initial mincing. NOTE: If the digest is viscous, add more collagenase and incubate further until it flows easily.
(9) Filter homogenate through a sterile 70 µm cell strainer into 50 ml tubes. NOTE: You will need to move the pipet tip around on the filter to get it all through.
(10) Spin the 50 mL tube at 500 g for 15 min. After spinning, there will be a thick lipid layer at the top. There should be a pellet at the bottom with red blood cells in it. This pellet is the SVF.
(11) Remove the lipid and media layers carefully leaving the pellet behind. You do not have to remove all the supernatant.
(12) Wash the pellet with pre-warmed 45 mL complete MEM-Alpha and use a 10 mL pipet to resuspend the SVF pellet.
(13) Repeat steps 10-12
NOTE: If a residual lipid layer is not observed after resuspension of the pellet, this step can be skipped.
(14) OPTIONAL STEP: The pellet can be resuspended in Red Cell Lysis Buffer using the manufacturers protocols. Red cells will be removed during MSC outgrowth so this step can be skipped to reduce stress on cells.
(15) Count cells excluding the Red Blood Cells using a haemacytometer
(16) Plate 5 million cells per 150 mm plate with 25 mL of pre-warmed complete MEM-Alpha.
(17) After 3-6 hours, use a phase contrast microscope to confirm that the MSCs have attached to the plate then remove the media to discard unattached cells and replace with fresh pre-warmed complete MEM-Alpha.
(18) Leave overnight in a cell culture incubator
DAY 3 (30 min)
(19) Cells should be well-attached to the plate. RBCs and white blood cells will be floating or weakly attached. Aspirate unattached cells with a 25 mL pipet. Replace media with pre-warmed complete MEM-Alpha.
(20) Let the cells proliferate 1–3 days until they reach 70% confluence. CRITICAL STEP: Growth kinetics depend on donor and accuracy of initial cell count. Do not allow cells to become confluent.
DAY 6 (1–2 hours)
(21) At 70-80% confluency, lift the cells with warmed Accutase or 0.05% Trypsin/EDTA for 5 minutes and neutralize the protease with complete MEM-alpha.
(22) Count the cells, spin, remove supernatant, resuspend in freezing media (~1–2 million cells/vial) and freeze aliquots of P0 cells using a controlled rate freezer at 1°C per minute and store in −80 or LN2.
STOP POINT:With cells frozen, you can delay the next steps for as long as you need. Continued Expansion and Characterization of SVF-derived adipose MSCs
DAY 1 (30 min)
(23) Add 25 mL of complete MEM-Alpha to 2 T-175 flasks and warm in 37°C incubator.
(24) Remove a vial of 1 million P0 SVF cells from cryostorage and thaw in a 37°C water bath and then plate 500k cells into of the T-175s flasks.
(25) Incubate the P1 SVF cells for 3-4 days until 80% confluent.
DAY 3 (1 hr)
(26) Lift the cells with warmed Accutase or 0.05% Trypsin/EDTA for 5 minutes and neutralize with complete MEM-Alpha.
(27) Count the cells, spin, remove supernatant, resuspend pellet, and seed 500k cells into new T-175 flasks with complete MEM-alpha.
(28) Incubate the P2 SVF cells for 3-4 days until 80% confluent.
DAY 6 (2–3 hrs)
(29) Lift the cells with warmed Accutase or 0.05% Trypsin/EDTA for 5 minutes and neutralize with complete MEM-Alpha.
(30) Count the cells, spin, remove supernatant, resuspend pellet.
(31) Transfer 1 million cells to a new tube and cryopreserve the rest to establish a bank of P2 SVF-MSCs.
(32) Spin down the remaining cells and resuspend with 200 µL Cell Staining Buffer.
(33) Transfer 50 µL of cell suspension to four 1.5 mL microcentrifuge tubes and add antibodies and diluents as described in .
Table 1. Antibody/Diluent amounts for FACS.
(34) Incubate on ice for 30 minutes.
(35) Spin cells at 500 g for 5 minutes and resuspend the pellet with 100 µL of cell staining solution before transferring to FACs tubes for analysis.
(36) Analyze on-target panel (CD76, CD90, CD105), negative cocktail (HLA-DR, CD11b, CD19, CD34, and CD45), and on-target and negative isotype controls using flow cytometer. NOTE: To meet MSC minimal criteria [Citation26], cells should be >95+ for CD90, CD73, and CD105 <2% positive for HLA-DR, CD11b, CD19, CD34, and CD45. SVF-derived preparations of MSCs usually fail on the Negative Cocktail at P0 and P1 but pass at P2 as contaminating cell types are diluted and die out.
STOP POINT: With cells characterized and frozen, you can delay the next steps for as long as you need. Formation of scaffold-free adipose spheroids NOTE: Scaffold-free Adipose spheroids can be formed using several methods that yield similar results, but each have advantages/disadvantages depending on the intended downstream application.
OPTION A: 96-Well Spheroid Plate Method
DAY 1 (30 min).
(37) Thaw and plate 500k SVF-derived adipose MSCs in PGM-2 in a T-175 flask for 3-4 days until they are 70-80% confluent.
(38) Once cells are ready to be harvested, prepare 96-well spheroid plate by adding 140 µL of PDM-2 to each well and incubating in 37°C incubator
(39) Lift the cells with warmed Accutase or 0.05% Trypsin/EDTA for 5 minutes and neutralize with media.
(40) Count the cells, spin, remove supernatant, and resuspend in PDM-2 at a concentration of 1 million cells/mL. NOTE: Expect ~1.25–1.75 million cells at harvest.
(41) Transfer 10 µL of cell suspension to each well to achieve a spheroid composition of 10k cells per spheroid and transfer to a well-humidified 37°C incubator.
NOTE: Spheroid size can be changed by altering the # of cells per well in the range of 2-20k cells per spheroid. Spheroid size has a significant impact on expected results (see ). NOTE: Spheroids will form and compact over the first 3 days which can be confirmed by microscopy.
DAY 7 and DAY 10 (1 hour)
(42) Change media every 3–4 days.
a. Before changing media, confirm presence of spheroid in each well through visual inspection.
NOTE: Spheroids should be visible to naked eye but use low magnification (e.g. 5X) microscope objective if needed.
b. To remove media without disrupting the spheroid, tilt the plate at a 30–40° angle while keeping one edge of the plate in contact with the floor of the biosafety cabinet. Insert a pipet tip vertically into the plate ().
Figure 1. 96-well spheroid plate media change technique. (a) Image of correct spheroid plate media change technique, holding the plate at a 30–40° angle with the multichannel pipet tips held vertically. (b) Image highlighting the difficulty of spheroid visualization (white dots) at the bottom of the spheroid plate after 3.5 days of culture.
(A) Image of a 96-well spheroid plate held at a 30-40° angle with the multichannel pipet tip held vertically. (B) Image from bottom of plate showing that the spheroids can be visualized as white dots after 3.5 days of culture.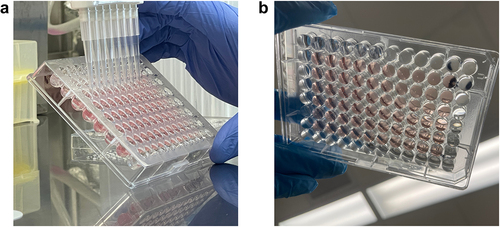
c. Slowly draw up the media, ensuring the tip remains against the wall and not the bottom of the well.
NOTE: Leave 10–20 µL of media behind to avoid accidental aspiration of spheroid and visually confirm spheroid is retained before discarding media.
d. Add 150 µL of fresh PDM-2 to each well and return to incubator.
DAY 14
(43) Over the past 10 days of differentiation in PDM-2 media spheroids should have grown in volume and are now ready for downstream applications and analysis (). NOTE: Spheroids can be maintained in culture for many weeks with regular media changes with maintenance media but will begin to float due to lipid accumulation after 10 days.
OPTION B: Agarose Micromold Method
DAY 1 (30 min)
(44) Thaw and plate 500k SVF-derived adipose MSCs in PGM-2 for 3–4 days until they are 70–80% confluent.
Formation of agarose micromolds
DAY 4 (2 hours)
(45) Prepare a sterile agarose solution to make micromolds. Each mould requires 330 µL of a 4% weight/volume agarose solution. To make 10 moulds, weigh 160 mg of low-melt agarose powder and add to 4 mL of sterile PBS -/- to achieve a 4% weight/volume solution.
(46) Melt agarose using either a hot plate or microwave until agarose is completely melted and solution is clear.
(47) Pipet 330 µL of molten agarose into each mould and allow to gel for 2–3 min in sterile hood. NOTE: It is important to brush the pipet tip gently across the cilia within the cell seeding chamber in the Microtissues 3D Petri Dish® to ensure no bubbles are trapped which will cause abnormal spheroid geometries ().
Figure 2. Illustrations and images to assist with spheroid production using the micromold format. (a) Illustration of the agarose micromold, highlighting the 75 μL cell seeding chamber in red. b) Observed colour change after acclimating micromolds with PDM-2 (step 49). (c) Microscopy image of loose spheroid production after 2 hours of initial seeding (taken after step 53). 200 μm scale bar.
(A) Schematic of the agarose micromold showing the 35 wells and 75μL cell seeding chamber in red. (B) Image showing micromold gels after exchange with media showing they change from clear to pink. (C) Microscopy image showing aggregation of cells into a loose spheroid 2 hours after initial seeding.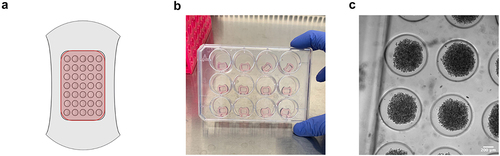
NOTE: If making more agarose than you have moulds, store remaining agarose on hot plate to maintain it in a molten state between batches. (48) Once gelled, transfer agarose microwells to a multiwell-plate by flexing the 3D Petri Dish® cast to pop the gel out. NOTE: Agarose micromolds can be prepared several days in advance if stored in PBS -/- and parafilm sealed.
Cell seeding procedure within 35-well micromold gel
(49) Exchange the PBS within the agarose gel with PDM-2 media by acclimating the micromolds in the media for a minimum of 30 minutes as follows:
a. Aspirate all PBS from outside of the cell seeding chamber while taking care not to draw up the gel in the aspirator tip.
b. Carefully aspirate the remaining 75 µL of PBS within the cell seeding chamber of each gel by holding the aspirator at an angle and using surface tension to remove the volume until microwell geometries are observed to avoid contacting the gel.
c. Add PDM-2 media until the micromold is covered (1.5 mL for a 24-well plate)
d. After 30 min, gels should be pink () and you can discard all media as described in 49 a and b.
(50) Lift the cells with warmed Accutase or 0.05% Trypsin/EDTA for 5 minutes and neutralize with media.
(51) Once cells are counted, adjust the cell suspension concentration depending on the size of spheroids you desire:
. For example to make 35 spheroids with 5,000 cells per spheroid, adjust cell suspension concentration to 2.33 × 10⁶ /mL.
(52) Transfer 75 µL of cell suspension to each cell seeding chamber in the gel dropwise and incubate for 30−60 minutes to allow cells to settle into micromolds ().
NOTE: Depositing all 75 µL in one pipetting motion will cause currents in the cell seeding chamber that lead to uneven number of cells in each spheroid. Drop-wise addition avoids this problem.
(53) Gently add 1.5 mL of PDM-2 to each well of the plate, making sure to dispense outside of the gel as to not disturb the cell seeding chamber.
NOTE: Since cells have only settled at this point, small perturbations in media can easily dislodge cells from the cell seeding chamber, leading to a heterogenous monolayer cell population outside of the gels.
DAY 7 and DAY 10 (1 hr)
(54) Change media every 3–4 days by aspirating only the media outside of the gel.
Do not attempt to aspirate media from the cell seeding chamber as this is likely to dislodge spheroids from their microwells (). Replacing the media outside the micromold is sufficient to replenish nutrients. NOTE: If making spheroids with larger number of cells or more spheroids in each well more frequent media changes may be required.
DAY 14
(55) Over the past 10 days of differentiation in PDM-2 media spheroids should have formed and grown in volume. They are now ready for downstream applications and analysis. NOTE: Spheroids can be maintained in culture for many weeks with regular media changes with maintenance media.
Optional downstream analyses
Lipid droplet staining and quantification
NOTE: Spheroids can be stained and imaged within either the 96-well spheroid plate or micromolds on standard inverted epi-fluorescent microscopes; however, high-magnification imaging requires objectives with longer working distances to accommodate the thickness of the plate or the plate and the micromold. In addition, as the spheroids accumulate lipids, they become buoyant which can increase distance from the objective focal plane and amplify vibrational movement that also impacts imaging. The steps below allow for higher-resolution images to be obtained by confocal imaging.
(56) Use a 1 mL pipette to carefully transfer spheroids to a 24-well plate and wash twice with 200 µL of PBS -/-.
(57) In a chemical fume hood, add 200 µL of 10% neutral buffered formalin and fix for 30 minutes.
WARNING: Formalin can cause irritation to the skin, throat, lungs, and eyes and repeated exposure can lead to cancer. Handle in chemical fume hood with appropriate personal protective equipment.
(58) Wash twice with PBS-/-.
(59) For each 1 mL of staining solution, add 2 µL of BODIPY 493/503 (stock concentration 1 mg/mL in DMSO) and 10 µL Hoechst to PBS-/- for 1 hr at room temperature.
(60) Remove staining solution and wash once with PBS-/-.
STOP POINT: Fixed and stained spheroids in PBS-/- can be sealed with parafilm to prevent drying out and foil to preserve the fluorophores from light-degradation and stored in the refrigerator for 1–3 days. BODIPY signal will fade with longer storage.
(61) Before imaging, remove the majority of the volume in the well so that floating spheroids are in contact with the bottom of the well. This will put the majority of the spheroid within the working distance of the microscope’s objective.
(62) Image on confocal microscopy.
RT-PCR for analysis of genes of interest
Spheroid removal (Optional)
(63) Remove 1 mL of media surrounding the microwell gel. The remaining media is needed to assist with spheroid collection.
CRITICAL STEP:Removing all of the surrounding media will cause bubbles to form within the micromold on the next step, disrupting the ability for spheroids to be spun out.
(64) Use a sterile pipet tip to invert all micromolds within their wells.
(65) Centrifuge the plates at 300 g for 3 minutes using a microplate swinging-bucket rotor. NOTE: If a microplate swinging-bucket centrifuge is not available, micromolds can be transferred to a 15 mL centrifuge tube and vortex to dislodge spheroids from micromolds.
(66) Use sterilized tweezers to lift each gel straight up out of the well. NOTE: If some spheroids remain trapped, rotate the plate 180° and repeat step 65.
(67) Once all micromold gels are removed, tilt plate to allow spheroids to collect on one edge of the well and use a 1 mL pipet to collect all spheroids.
(68) When all spheroids are collected, spin at 500 g for 5 min and wash 2× with PBS-/-
(69) Add 150 μL of the ReliaPrep lysing solution.
(70) Alternate between vigorous pipetting and 20 second vortexing until minimal debris is observed (3–5 rounds). CRITICAL STEP: Manufacturer’s protocol calls only for pipetting 7–10 times to lyse cells but this is not sufficient for lysing spheroids. Multiple rounds of pipetting and vortexing should not be skipped. NOTE: Some spheroid debris will still be observed even after multiple rounds of pipetting and vortexing. WARNING: Lysis solution can cause skin burns and severe eye irritation. Use appropriate personal protective equipment.
(71) Follow remainder of manufacturer’s protocol for collecting RNA
Secretome analysis using legendplex human adipokine panel
NOTE: Media can be collected and frozen throughout the differentiation process and analysed in bulk.
(72) Remove all frozen samples of interest and thaw to room temperature
NOTE: Adiponectin, Adipsin, and RBP4 concentrations may exceed top standards while inflammatory cytokines tend to be near bottom standards. To measure all adipokines, divide media collections into diluted and undiluted samples. For example, a 7 × 5 array spheroid micromold sample will require ~50–75× dilution to keep adiponectin, adipsin, and RBP4 levels within dynamic standard ranges.
(73) Follow BioLegend’s LegendPlex Instructions for Processing Samples and Standards
(74) Before loading samples of interest on the flow cytometer, set up the specific gates described within the manufacturer’s protocols. Run the kit setup beads to ensure PMT levels do not lead to fluorescent intensities above detectable ranges within FL-4. Adjust voltages accordingly.
NOTE: Adipogenic differentiation without the presence of resident immune cells will likely lead to undetectable levels of cytokines such as IL-1β, IP-10, IL-10, IFN-γ, Resistin, and TNF-α.
Anticipated Results
Spheroids have better adipokine profile and lipid accumulation compared to 2D cultures
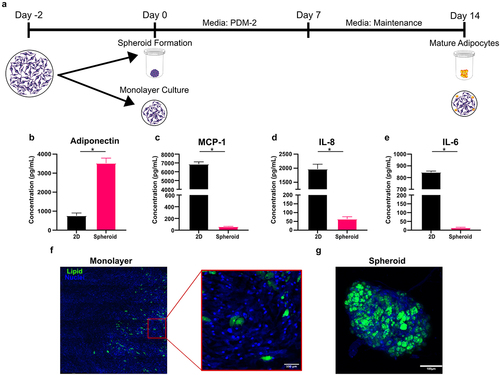
To illustrate the differences between 2D and 3D cultures, we partitioned MSCs derived from the same donor into either standard 96-well monolayer culture or 96-well spheroid culture (). Regardless of culture condition, each well contained 10,000 cells. As expected, MSCs differentiated within the 2D format displayed significantly decreased adipogenic propensity. Compared to monolayer culture, spheroids secreted nearly 4× more adiponectin () and 30–100× lower levels of pro-inflammatory cytokines, such as MCP-1, IL-8, and IL-6 () which remains consistent with previous studies [Citation27]. Staining lipid droplets with BODIPY revealed that donors with relatively poor quality of differentiation in 2D () could be induced to differentiate into lipid-rich adipocytes when cells from the same donor were cultured in our spheroid format (). The inflammatory cytokine environment produced by adipocytes in monolayer culture does not represent the adipokine profile of healthy adipose tissue, which could lead one to draw faulty conclusions. For examples, if one is conducting experiments on interactions between immune cells and adipose tissues, a microenvironment with an upregulation of these cytokines would make adipose tissue appear to be more pro-inflammatory and skew immune cells towards phenotypes that are more indicative of chronic inflammation [Citation28].
Figure 3. Differentiating MSCs within a spheroid format yields greater adiponectin production without creating a pro-inflammatory environment. (a) To assess the implications of culture format on adipogenic potential, MSCs were differentiated via monolayer or spheroid format briefly described in the schematic. (b) Adiponectin, (c) MCP-1, (d) IL-8, and (e) IL-6 production were quantified by ELISA. Representative fluorescent images adipocytes differentiated within (f) monolayer and (g) spheroid formats with nuclei stained with Hoechst 33,342 (blue) and lipids stained with BODIPY 493/503 (green). Bars represent mean and error bars are SD, N = 3. Unpaired t-test, * designates a significant difference of p < 0.05 between monolayer and spheroid conditions.
Multiparameter analysis reveal donor differences
We have established with both immortalized human preadipocytes (NPADs) [Citation10], primary mouse SVF-derived MSCs [Citation10], and primary human SVF-derived MSCs () that spheroid adipocyte cultures perform better than 2D cultures in terms of lipid accumulation and adipokine production. While 3D cultures consistently outperform 2D cultures, variability in the adipocyte phenotype still occurs and is influenced by several factors. The first parameter to consider is donor variability. Unfortunately, when assessing adipocyte donor variability, evaluating only one parameter of mature adipocytes can be misleading.
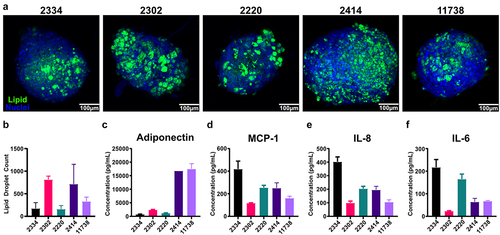
We characterized cells from five donors of SVF-derived MSCs using the MSC minimal criteria [Citation26] and then differentiated them in spheroids and evaluated them based on lipid accumulation and adipokine production. While all five donors passed the MSC minimal criteria (Supplemental Figure S1) there was significant variability in lipid accumulation and adipokine production. All donors exhibited significant lipid accumulation, but the quantity and size of lipid droplets varies across donors (). Based on lipid staining alone, it could be tempting to conclude all five donors are relatively similar, however analysis of the number of lipid droplets in each spheroid reveals more nuanced differences () and analysis of their adipokine production at the end of differentiation reveals even more stark differences. Two of the five donors have adiponectin levels that are much higher than the other three (). In addition, while all five donors have levels of inflammatory cytokines that are orders of magnitude less than what we typically observe in 2D cultures (), Donor 2334 exhibited much higher levels than the other four donors. Thus, when establishing a 3D spheroid system, it is important to evaluate donors using multiple functional assays to determine which donors are suitable for the particular research question. This is particularly true if planning co-culture experiments, as adipokine production and lipid accumulation can have major effects on cell–cell interactions.
Figure 4. Spheroids derived from primary SVF-MSCs demonstrate variable adipogenic potential revealed by adipokine production. (a) Representative confocal z-projections of five separate donors, stained with Hoechst 33,342 (blue) and BODIPY 493/503 (green). (b) Total lipid droplet counts were quantified using ImageJ. (c) Adiponectin, along with pro-inflammatory cytokines: (d) MCP-1, (e) IL-8, and (f) IL-6 were quantified via ELISA. Bars are mean and error bars are SD, N = 3.
Advantages and drawback of each spheroid format
The next factor that influences spheroid function is culture format. Herein we have presented two options for forming spheroids using either a 96-well spheroid plate or agarose micromolds. These are not the only methods for producing spheroids, indeed we have previously used hanging drop method as well [Citation10,Citation22,Citation23], but these two options are highly accessible to a large number of labs and are suitable for many experimental needs. The largest trade-off between the two options are whether one needs a large number of spheroids or precise control over the size and variability of spheroids. The size of spheroids can be tightly controlled with the 96 well spheroid plate by controlling the number of cells deposited into each well (). When using the micromolds to form spheroids, the average spheroid size can be controlled by controlling the concentration of cells added to the cell seeding chamber, but the precise number of cells that settle into each well of the micromold is not directly controlled (). Since the seeding cells in the wells of the micromold relies on chance, the size of the spheroids within a micromold can have significant variability (). When compared to the 96-well spheroid method we found that spheroids formed using micromolds had higher variability in cross-sectional area regardless of the number of cells seeded per spheroid (). While most variability arises during initial seeding it can also occur due to spheroid fusion. Care must be taken during media changes to avoid dislodging spheroids from their wells in the micromold which can cause them to either leave the mould entirely or end up occupying the same well as another spheroid (). To avoid this issue, reference for troubleshooting suggestions.
Figure 5. Spheroid production via round bottom plate yields more consistent spheroid sizes. (a) Representative images of 10,000 and 20,000 cell spheroids formed within 96-well spheroid plates followed by (b) 1,300, (c) 5,000, and (d) 10000 cell spheroids formed within agarose micromolds. (e) Cross-sectional area of spheroids generated in micromolds. Each group consists of 25–35 individual spheroids. (f) To highlight spheroid size variability across formats, the coefficient of variation of spheroid areas were compared. Data points represent mean and error bars are SD.
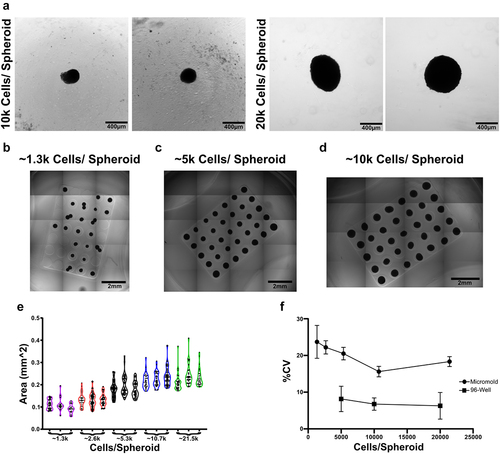
Table 2. Common problems that may be encountered and guide to troubleshooting.
When collecting conditioned media or exosomes from cultures adpipocyte spheroids, each platform has its advantages and drawbacks. The micromold platform allows a relatively large amount of media to be collected with the potential to have higher amounts of biological material due to increased culture density. However, care must be taken to ensure that serum or differentiation components trapped in the gel are removed prior to collecting media. This can be achieved by repeating the gel acclimation steps described in step 49 to exchange old media for fresh collection media or by collecting spheroids (Steps 63–68) and placing them into ultra-low attachment plates for several days within collection media. Alternatively, we have used the 96-well spheroid plate to generate conditioned media which removes issues arising from the gels but yields a much lower total volume of media.
Impact of spheroid size and culture density
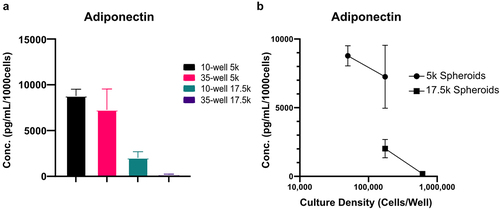
The final parameters that impact adipose spheroid phenotype is the size of the spheroid and density of the culture. In our initial development of the scaffold-free spheroid technique we found that, counterintuitively, culturing more spheroids together did not result in a proportional increase in adiponectin. Rather, as we increased the number of spheroids cultured together adiponectin levels decreased and levels of the inflammatory cytokine IL-8 increased [Citation10]. We found that this inverse relationship could be remediated by more frequent media changes [Citation10], but altogether it highlights the importance of carefully picking spheroid size and culture density. Regardless of whether 96-well spheroid plates or micromolds are used to form spheroids, the size of the spheroid will impact the resultant adipokine profile as will the total culture density (cells/mL of media). To demonstrate the impact of spheroid size and culture density, we devised an experiment where we either fixed the size of the spheroids but changed the culture density, or fixed the culture density but changed the size of the spheroids. This resulted in 4 experimental groups: 5,000 cell spheroids at a culture density of 50,000 cells per well, 5,000 cell spheroids at a culture density of 175,000 cells per well 17,500 cell spheroids at 175,000 cells per well, or 17,500 cell spheroids at 612,500 cells per well. After differentiating we analysed the media by ELISA to quantify the amount of adiponectin produced per cell. The highest per cell production of adiponectin was achieved with the smallest spheroid size (5,000 cells) and lowest culture density (50,000 cells per well) (). When we kept the spheroid size the same but increased the culture density to 175,000 cells per well, adiponectin per cell remained relatively constant. This shows that for small spheroids at relatively low culture densities, the amount of adiponectin per cell will scale. When we however increase the spheroid size to 17,500 cells per spheroid while keeping the culture density at 175,000 cells per well, we see a significant drop in adiponectin per cell (). This shows that the size of the spheroids influences the health and function of the adipocytes independent of culture density. When we then increase the culture density of the larger spheroids from 175,000 cells per well to 612,500 cell per well, we see another significant decrease in adiponectin per cell. This shows that cultivating spheroids at too high of culture density will result in adipocytes that have dysfunctional adiponectin production. While smaller spheroids are generally favourable compared to large spheroids they do have some drawbacks. Small spheroids are much more difficult to handle as they are difficult to see and are more prone to floating out of the micromold wells as they accumulate lipids or being disturbed and aspirated during media changes ().
Figure 6. Adipocyte health is influenced by spheroid size and further exacerbated by culture density. Spheroids were differentiated within micromolds with either 10 or 35 spheroids per gel and either 5,000 (5k) or 17,500 (17.5k) cells per spheroid. (a)Adiponectin was quantified via ELISA for each condition and normalized per 1000 cells present within each well. (b)To highlight the influence of increased spheroid density and overall culture density on adipocyte health, spheroid densities were paired within the same adiponectin quantification. Data points represent mean and error bars are SD, N = 4.
Ethics
The adipose stromal vascular fraction, employed in this study for the generation of adipose MSCs, were sourced from adipose tissue obtained as surgical discard from donors aged 20–40. These tissue samples, acquired through the University of Iowa Tissue Procurement Core, originate from surgical procedures conducted at the University of Iowa Hospitals and Clinics. The procurement process adheres to a University of Iowa Institutional Review Board approved protocol (UI IRB Protocol #200907702) managed by the Core with adherence to the Declaration of Helsinki, ensuring proper written informed consent is obtained from donors prior to tissue collection. The Tissue Procurement Core removes all identifying information from the specimens, providing researchers with de-identified tissue for their studies. The Tissue Procurement Core and its personnel play no role in the actual execution of the research.
Author contributions
J.L.: conceptualization, data curation, formal analysis, methodology, visualization and writing – review and editing; A.K.: conceptualization, funding acquisition, methodology, resources, supervision, visualization and writing – review and editing; E.S.: conceptualization, funding acquisition, methodology, resources, supervision, visualization and writing – review and editing; J.A.: conceptualization, data curation, formal analysis, funding acquisition, methodology, resources, supervision, visualization and writing – review and editing. All authors gave their final approval for publication and agreed to be held accountable for the work performed therein.
Supplemental Material
Download PDF (736.5 KB)Disclosure statement
No potential conflict of interest was reported by the author(s).
Data availability statement
The data that support the findings of this study are available in the Iowa Research Online repository [Citation29] at http://doi.org/10.25820/data.006816 with record identifier 9984546842202771.
Supplementary material
Supplemental data for this article can be accessed online at https://doi.org/10.1080/21623945.2024.2347215
Additional information
Funding
References
- Smith U, Kahn BB. Adipose tissue regulates insulin sensitivity: role of adipogenesis, de novo lipogenesis and novel lipids. J Intern Med. 2016;280(5):465–16. doi: 10.1111/joim.12540
- Guilherme A, Virbasius JV, Puri V, et al. Adipocyte dysfunctions linking obesity to insulin resistance and type 2 diabetes. Nat Rev Mol Cell Biol. 2008;9(5):367–377. doi: 10.1038/nrm2391
- Neumann E, Hasseli R, Ohl S, et al. Adipokines and autoimmunity in inflammatory arthritis. Cells. 2021;10(2):216. doi: 10.3390/cells10020216
- Patel P, Abate N. Role of subcutaneous adipose tissue in the pathogenesis of insulin resistance. J Obes. 2013;2013:489187. doi: 10.1155/2013/489187
- Yao H, He S. Multi‑faceted role of cancer‑associated adipocytes in the tumor microenvironment (review). Mol Med Rep. 2021;24(6):866. doi: 10.3892/mmr.2021.12506
- Boland L, Bitterlich LM, Hogan AE, et al. Translating MSC therapy in the age of obesity. Front Immunol. 2022;13:943333. doi: 10.3389/fimmu.2022.943333
- Mackall JC, Student AK, Polakis SE, et al. Induction of lipogenesis during differentiation in a “preadipocyte” cell line. J Biol Chem. 1976;251(20):6462–6464. doi: 10.1016/S0021-9258(20)81883-3
- Vu BG, Gourronc FA, Bernlohr DA, et al. Staphylococcal superantigens stimulate immortalized human adipocytes to produce chemokines. PLOS ONE. 2013;8(10):e77988. doi: 10.1371/journal.pone.0077988
- Behan-Bush RM, Liszewski JN, Schrodt MV, et al. Toxicity impacts on human adipose mesenchymal stem/stromal cells acutely exposed to aroclor and non-aroclor mixtures of polychlorinated biphenyl. Environ Sci Technol. 2023;57(4):1731–1742. doi: 10.1021/acs.est.2c07281
- Klingelhutz AJ, Gourronc FA, Chaly A, et al. Scaffold-free generation of uniform adipose spheroids for metabolism research and drug discovery. Sci Rep-uk [Internet]. 2018;8(1):523. doi: 10.1038/s41598-017-19024-z
- Hu W, Lazar MA. Modelling metabolic diseases and drug response using stem cells and organoids. Nat Rev Endocrinol. 2022;18(12):744–759. doi: 10.1038/s41574-022-00733-z
- Abbott RD, Wang RY, Reagan MR, et al. The use of silk as a scaffold for mature, sustainable unilocular adipose 3D tissue engineered systems. Adv Healthcare Mater. 2016;5(13):1667–1677. doi: 10.1002/adhm.201600211
- Bellas E, Marra KG, Kaplan DL. Sustainable three-dimensional tissue model of human adipose tissue. Tissue eng part C: methods. Tissue Eng Part C Methods. 2013;19(10):745–754. doi: 10.1089/ten.tec.2012.0620
- Baganha F, Schipper R, Hagberg CE. Towards better models for studying human adipocytes in vitro. Adipocyte. 2022;11(1):413–419. doi: 10.1080/21623945.2022.2104514
- Pieters VM, Rjaibi ST, Singh K, et al. A three-dimensional human adipocyte model of fatty acid-induced obesity. Biofabrication. 2022;14(4):045009. doi: 10.1088/1758-5090/ac84b1
- Hammel JH, Bellas E. Endothelial cell crosstalk improves browning but hinders white adipocyte maturation in 3D engineered adipose tissue. Integr Biol. 2020;12(4):81–89. doi: 10.1093/intbio/zyaa006
- Reggio A, Paolis FD, Bousselmi S, et al. Development of a platform of 3D adipogenesis to model, at higher scale, the impact of LY2090314 compound on fibro/adipogenic progenitor adipogenic drift. Dis Model Mech. 2023;16(6):dmm049915. doi: 10.1242/dmm.049915
- Strobel HA, Gerton T, Hoying JB. Vascularized adipocyte organoid model using isolated human microvessel fragments. Biofabrication. 2021;13(3):035022. doi: 10.1088/1758-5090/abe187
- Taylor J, Sellin J, Kuerschner L, et al. Generation of immune cell containing adipose organoids for in vitro analysis of immune metabolism. Sci Rep. 2020;10(1):21104. doi: 10.1038/s41598-020-78015-9
- Yang F, Carmona A, Stojkova K, et al. A 3D human adipose tissue model within a microfluidic device. Lab Chip. 2021;21:435–446. doi: 10.1039/D0LC00981D
- Pizzaa DEBDP, Warrenb CR, Dahla M, et al. Fattening chips: hypertrophy, feeding, and fasting of human white adipocytes in vitro. Lab Chip. 2020;20(22):4152–4165. doi: 10.1039/D0LC00508H
- El-Hattab MY, Nagumo Y, Gourronc FA, et al. Human adipocyte conditioned medium promotes in vitro fibroblast conversion to myofibroblasts. Sci Rep-UK. 2020;10(1):10286. doi: 10.1038/s41598-020-67175-3
- El-Hattab MY, Sinclair N, Liszewski JN, et al. Native adiponectin plays a role in the adipocyte-mediated conversion of fibroblasts to myofibroblasts. J Roy Soc Interface. 2023;20(202):20230004. doi: 10.1098/rsif.2023.0004
- Robledo F, González-Hodar L, Tapia P, et al. Spheroids derived from the stromal vascular fraction of adipose tissue self-organize in complex adipose organoids and secrete leptin. Stem Cell Res Ther. 2023;14(1):70. doi: 10.1186/s13287-023-03262-2
- Whelan IT, Burdis R, Shahreza S, et al. A microphysiological model of bone development and regeneration. Biofabrication. 2023;15(3):034103. doi: 10.1088/1758-5090/acd6be
- Dominici M, Blanc KL, Mueller I, et al. Minimal criteria for defining multipotent mesenchymal stromal cells. The international society for cellular therapy position statement. Cytotherapy [Internet]. 2006;8:315–317. doi: 10.1080/14653240600855905
- Wolff A, Frank M, Staehlke S, et al. A comparative study on the adipogenic differentiation of mesenchymal stem/stromal cells in 2D and 3D culture. Cells. 2022;11(8):1313. doi: 10.3390/cells11081313
- Ruggiero AD, Key C-C, Kavanagh K. Adipose tissue macrophage polarization in healthy and unhealthy obesity. Front Nutr. 2021;8:625331. doi: 10.3389/fnut.2021.625331
- Ankrum J, Liszewski J. Dataset for development and analysis of scaffold-free adipose spheroids. Iowa Research Online [Internet]. 2024. Available from. doi: 10.25820/data.006816.