
ABSTRACT
Obesity is associated with a low-grade chronic inflammatory process characterized by higher circulating TNFα levels, thus contributing to insulin resistance. This study evaluated the effect of silybin, the main bioactive component of silymarin, which has anti-inflammatory properties, on TNFα levels and its impact on glucose uptake in the adipocyte cell line 3T3-L1 challenged with two different inflammatory stimuli, TNFα or lipopolysaccharide (LPS). Silybin’s pre-treatment effect was evaluated in adipocytes pre-incubated with silybin (30 or 80 µM) before challenging with the inflammatory stimuli (TNFα or LPS). For the post-treatment effect, the adipocytes were first challenged with the inflammatory stimuli and then post-treated with silybin. After treatments, TNFα production, glucose uptake, and GLUT4 protein expression were determined. Both inflammatory stimuli increased TNFα secretion, diminished GLUT4 expression, and significantly decreased glucose uptake. Silybin 30 µM only reduced TNFα secretion after the LPS challenge. Silybin 80 µM as post-treatment or pre-treatment decreased TNFα levels, improving glucose uptake. However, glucose uptake enhancement induced by silybin did not depend on GLUT4 protein expression. These results show that silybin importantly reduced TNFα levels and upregulates glucose uptake, independently of GLUT4 protein expression.
1. Introduction
Obesity is a systemic, chronic, and multifactorial disease, with a global epidemic rise in almost all countries [Citation1], which is related to metabolic alterations like insulin resistance, contributing to the development of chronic diseases like diabetes mellitus type 2 [Citation2,Citation3]. Insulin resistance is an insufficient cellular response to insulin in insulin-dependent cells like adipocytes, cardiomyocytes, and skeletal muscle [Citation4,Citation5]. Several studies have shown specific molecular mechanisms involved in the pathophysiology of insulin resistance [Citation6]. Low-grade chronic inflammation associated with obesity correlates with insulin resistance [Citation7,Citation8], particularly tumour necrosis factor α (TNFα), secreted by adipocytes and adipose tissue macrophages, impairs the insulin signalling via serine phosphorylation of insulin receptor substrate 1 (IRS1), reducing glucose transporter 4 (GLUT4) membrane expression, therefore decreasing glucose entry into cells [Citation9,Citation10]. Another mechanism involved is metabolic endotoxemia, characterized by increased circulating lipopolysaccharide (LPS) or the LPS binding protein, a phenomenon known as metabolic endotoxemia [Citation11].
Currently, therapies are based on preventing the development of diseases associated with obesity. Silymarin is a compound of flavonolignans obtained from Silybum marianum, a European native plant, which has been traditionally used as a hepatoprotector [Citation12]. Silybin is the main active component of silymarin and represents a therapeutic option due to its antioxidant and anti-inflammatory properties, proven in different experimental models and clinical studies [Citation13–17]. Although the molecular bases of the anti-inflammatory and immunomodulatory effects of silymarin are still not fully understood, several reports demonstrated that silybin inhibits the phosphorylation of the transcription factor nuclear factor kappa-light-chain-enhancer of activated B cells (NFκB), which regulates and coordinates transcription and expression of several genes involved in the inflammatory processes [Citation18–20]. Also, silybin enhances the sensitivity to insulin of insulin-dependent cells like hepatocytes and myocytes [Citation21,Citation22] and has a hypoglycaemic effect in patients with diabetes mellitus type 2 [Citation16].
Since obesity is a chronic inflammatory state mainly generated by the adipose tissue and is a primary cause for the development of metabolic diseases such as diabetes mellitus, it is relevant to explore if silybin exerts a hypoglycaemic and anti-inflammatory effect in insulin-sensitive cells such as adipocytes. In this study, we, therefore, evaluated the impact of silybin as pre-treatment (preventive) and post-treatment (therapeutic) on TNFα levels and its impact on glucose uptake in the adipocyte cell line 3T3-L1 challenged with two different inflammatory stimuli, TNFα and LPS ().
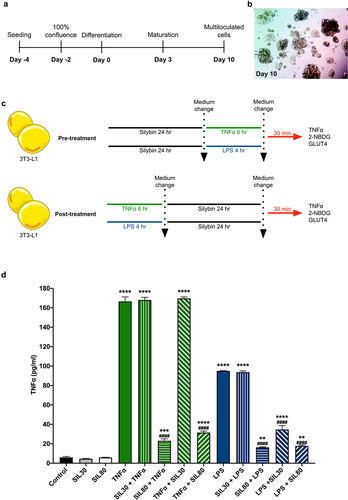
Figure 1. Experimental design and TNFα secretion with silybin treatment. (a) 3T3-L1 preadipocyte differentiation protocol. (b) Representative image of 3T3-L1 preadipocytes at day 10 of induction. (c) For silybin’s pre-treatment, 3T3-L1 adipocytes were pre-treated with silybin and then challenged with TNFα or LPS. For silybin’s post-treatment, 3T3-L1 adipocytes were first challenged with TNFα or LPS and then post-treated with silybin. (d) TNFα supernatant levels after treating 3T3-L1 adipocytes with vehicles (Control), silybin 30 µM (SIL30), silybin 80 µM (SIL80), TNFα (TNFα), LPS (LPS), silybin then stimulated with TNFα (SIL30 + TNFα, SIL80 + TNFα) or LPS (SIL30 + LPS, SIL80 + LPS), challenged with TNFα then post-treated with silybin (TNFα + SIL30, TNFα + SIL80), or LPS and then post-treated with silybin (LPS + SIL30, LPS + SIL80). Data represented mean ± SEM from five independent experiments and were analysed by one-way ANOVA, followed by a Dunnett’s post hoc test. *p ≤ 0.01 compared to the control group. #p < 0.0001 compared to the TNFα or LPS groups.
2. Results
2.1. Silybin treatment decreases TNFα expression after inflammatory stimuli
One of the most explored effects of silybin is its anti-inflammatory effect. Silybin inhibits TNFα synthesis even when administered as pre-treatment by inhibiting the inhibitor of the nuclear factor kappa B (IκBα) phosphorylation, proteolytic degradation, and thus NFκB translocation to the nucleus [Citation18,Citation23–25].
Both inflammatory stimuli, TNFα and LPS, significantly increased TNFα levels in the supernatants of the 3T3-L1 adipocyte cells (p < 0.0001; ). Interestingly, TNFα stimulation induced significantly higher levels of TNFα than LPS stimulation (p < 0.0001; ). Silybin in 30 and 80 µM doses did not affect basal TNFα levels (). Silybin at the dose of 30 µM did not modify TNFα levels, both as pre-treatment and post-treatment, on TNFα stimulation (). However, the pre-treatment and post-treatment with silybin 80 µM reduced TNFα secretion significantly compared to the TNFα challenged group (p < 0.0001; ). Silybin as 30 µM pre-treatment did not change TNFα secretion when the inflammatory stimulus was LPS, but TNFα lowered when silybin was administered as post-treatment (p < 0.0001; ). Silybin 80 µM treatment before and after the LPS stimuli reduced TNFα levels in the supernatant significantly in a similar manner to the control group (p < 0.0001; ).
2.2. Silybin increases the uptake of glucose
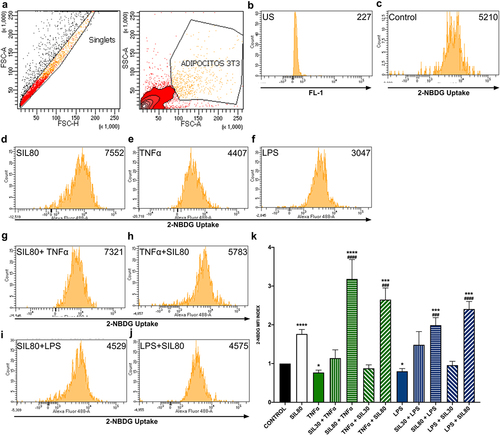
Silybin at the dose of 30 µM did not increase glucose uptake, either as pre-treatment or post-treatment with TNF or LPS challenges (). Silybin (80 µM) treatment raised glucose uptake significantly (p < 0.0001; ). The stimulation of the adipocytes with TNFα or LPS decreased glucose analog 2NBDG uptake when compared to the control (p = 0.01; p = 0.028, respectively; ). The pre-treatment with silybin 80 µM raised glucose uptake when compared to the control group (SIL80 + TNFα p < 0. 0001, SIL80 + LPS p = 0.0007; ) and their respective TNFα and LPS control groups (p < 0.0001, p = 0.0002, respectively; ). Also, silybin 80 µM as post-treatment after both inflammatory stimuli increased glucose uptake when compared to the control group (p = 0.0002, p < 0. 0001, respectively; ) and to their respective TNFα and LPS control groups (p = 0.0002, p < 0.0001, respectively; ). Silybin’s effect on glucose uptake is probably due to TNFα reduction, thus improving insulin receptor signalling and glucose uptake.
Figure 2. Effect of silybin on glucose uptake by 3T3-L1 adipocytes. (a) Flow cytometric analysis for 3T3-L1 adipocytes. (b) Auto-fluorescence of unstained cells (US) on FL-1 channel. (c) The control was 3T3-adipocytes cultured using only a maturation medium and vehicles. Representative flow cytometry histograms showing 2-NBDG uptake in 3T3-L1 adipocytes after treatments: (d) silybin (SIL80), (e) TNFα, (f) LPS, (g) pre-treatment with silybin and then stimulated with TNFα (SIL80 + TNFα), (i) pre-treatment with silybin and then LPS (SIL80 + LPS), (h) challenged with TNFα and then post-treated with silybin (TNFα + SIL80), (j) challenged with LPS and then post-treated with silybin (LPS + SIL80). Since 30 µM of silybin had no effect on glucose uptake, only representative flow cytometry histograms for 80 µM of silybin are presented. (k) 2-NBDG uptake was by 3T3-L1 adipocytes after treatments with inflammatory stimuli, pre- and post-treated with silybin 30 µM (SIL30) or 80 µM (SIL80). The control group received only a maturation medium and vehicles (control value set at 1). Data represented mean ± SEM from 3 independent experiments carried out in triplicate and were analysed by one-way ANOVA, followed by a Dunnett’s post hoc test. *p ≤ 0.05 compared to the control group, #p ≤ 0.01 compared to TNFα or LPS groups. The MFI index was calculated by dividing the MFI-treated group by the MFI-negative control.
2.3. Inflammatory stimuli reduce GLUT4 protein expression
Since 30 µM of silybin, neither pre-treatment nor post-treatment showed no modulatory effect on secreted TNFα levels nor 2NBDG uptake after inflammatory stimuli challenges (), the GLUT4 experiments were only performed with the dose of 80 µM.
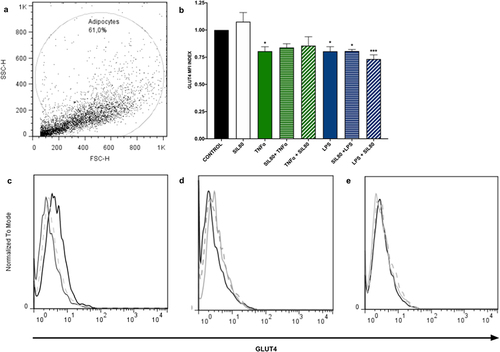
Inflammation plays a crucial role in down-regulating the expression of glucose transport GLUT4 [Citation26]. Our data showed that exposure to inflammation significantly reduces GLUT4 protein expression in adipocytes (TNFα p = 0.0177, LPS p = 0.0171; ). Silybin pre- nor post-treatment had no effect on GLUT4 protein expression ().
Figure 3. GLUT4 protein expression is not modified with silybin treatment. (a) Flow cytometric analysis of 3T3-L1 adipocytes. (b) GLUT4 protein expression by 3T3-adipocytes after treatment with 80 μM of silybin (SIL80), TNFα, LPS, pre-treated with silybin and then stimulated with TNFα (SIL80 + TNFα) or LPS (SIL80 + LPS), challenged with TNFα and then post-treated with silybin (TNFα + SIL80), or challenged with LPS and then post-treated with silybin (LPS + SIL80). The control group received only a maturation medium and vehicles (control value set at 1). Data represented mean ± SEM from 5 independent experiments and were analysed by one-way ANOVA, followed by a Dunnett’s post hoc test. *p ≤ 0.005 compared to the control group. The MFI index was calculated by dividing the MFI-treated group by the MFI-negative control. (c) Representative flow cytometry histograms showing GLUT4 protein expression in 3T3-L1 adipocytes after treatment with 80 μM of silybin (SIL; solid black line), TNFα (solid grey line), or LPS (dashed grey line). (d) Representative flow cytometry histograms showing GLUT4 protein expression in 3T3-L1 adipocytes after treatment with TNFα (solid black line), pre-treated with silybin and then challenged with TNFα (SIL80 + TNFα; dashed grey line), or treated with TNFα and then post-treated with silybin (TNFα + SIL80; solid grey line). (e) Representative flow cytometry histograms showing GLUT4 protein expression in 3T3-L1 adipocytes after treatment with LPS (solid black line), pre-treated with silybin and then challenged with LPS (SIL80 + LPS; dashed grey line), or treated with LPS and then post-treated with silybin (LPS + SIL80; solid grey line).
3. Discussion
Inflammation can be triggered by external disruptors such as pathogens (e.g. bacteria), intrinsic events like cell death, cancer, or physiological alterations secondary to fasting or overfeeding [Citation27]. Adipose tissue plays an important link between inflammation and metabolism. Indeed, during obesity, the endotoxins cross the intestinal barrier, inducing multiple immune alterations in humans [Citation28–30]. In mice, a high-fat diet reduces bifidobacteria and increases the plasma concentration of LPS and liver fat, along with the expression of several pro-inflammatory cytokines like IL6 and TNFα [Citation31]. Abundant evidence recently relates obesity and over-nutrition to a chronic low-grade inflammatory state caused by immune cells and adipocytes; this process is called ‘meta-inflammation’ [Citation32,Citation33].
The role of the adipocyte is more than the storage of lipids; extensive evidence demonstrates its participation in the regulation and alterations of glucose metabolism. Adipose tissue acts as a producer and consumer of multiple inflammatory mediators such as TNFα, IL-1β, and IL-6 [Citation7,Citation34]. TNFα was the first pro-inflammatory cytokine related to inflammation-induced insulin resistance [Citation10]. As demonstrated by other reports, we observed that the incubation of adipocytes with TNFα or LPS induced the production of TNFα () [Citation35,Citation36]. Interestingly, pre- and post-incubation with silybin 80 µM decreased TNFα levels significantly (). Silybin’s and silymarin’s inhibitory effect of the transcription factor nuclear factor kappa B (NFkB) and c-Jun N-terminal kinase (JNK) has been widely documented in the brain [Citation37–39], lung [Citation40,Citation41], liver [Citation42–47], pancreas [Citation19], and even adipocytes [Citation48,Citation49]. Probably, silybin decreased the phosphorylation of NFkB in the 3T3-L1 adipocytes, thereby decreasing the transcription of inflammatory genes and thus reducing TNFα in the supernatant after both inflammatory stimuli.
Insulin resistance is a pathologic condition in which adipocytes, hepatocytes, and skeletal muscle cells, insulin‐dependent cells, fail to respond appropriately to physiological circulating insulin levels [Citation4]. Since insulin plays a crucial role in cell glucose entry, any disruption in insulin signal transduction interferes with glucose uptake by the cells, thus leading to hyperglycaemia [Citation4]. Insulin resistance is a common feature of obesity, non-alcoholic fatty liver disorder, diabetes mellitus type 2, dyslipidemia, atherosclerosis, and hypertension, all metabolic disorders [Citation4,Citation50]. Our data showed that the TNFα and LPS stimuli reduced glucose uptake, most likely because both challenges decreased the expression of GLUT4 in 3T3-L1 adipocytes () [Citation51]. TNFα is crucial in insulin resistance, as it interferes with insulin receptor signalling by phosphorylating ISR1/2, inhibiting Akt, and therefore diminishing the translocation of GLUT4 to the plasma membrane [Citation52,Citation53]. Despite not having determined Akt phosphorylation, the doses of both stimuli used in this study have been shown to inhibit Akt phosphorylation [Citation51,Citation54]; it is very likely that in our model, both inflammatory stimuli also interfere with membranal translocation of GLUT4 via inhibition of Akt phosphorylation. Also, activation of JNK seems to be involved in TNFα-induced insulin resistance [Citation55]. NFkB, a transcription factor activated by TNFα or LPS, and JNK signalling pathways are targets of silybin. Our results demonstrate that silybin 80 µM as pre- and post-treatment increases glucose uptake by counteracting the effect induced by these inflammatory stimuli.
Silybin 80 µM alone, neither pre-treatment nor post-treatment, did not modify GLUT4 expression in adipocytes as previously reported () [Citation56,Citation57]. The discrepancies are probably due to the different doses and times of incubation of silybin employed. We exposed the adipocytes to 24 hr of silybin in 30 and 80 µM as pre-treatment and post-treatment, while Nomura and colleagues used 10 µM 1 hr, and Zhan and colleagues 40 µM 20 min before glucose uptake assay [Citation56,Citation57]. Another key difference may be that both works explored the effect of silybin alone; here, we observed that silybin enhanced glucose uptake even after TNFα and LPS lowered glucose capture by the adipocytes ().
Being GLUT4, one of the primary glucose transporters, we expected that by modulating the inflammation with silybin, GLUT4 would increase its expression. However, silybin, as pre-treatment and post-treatment, showed no significant changes in the expression of GLUT4 (). Although GLUT4 transporter levels did not increase with silybin treatment (), we cannot discard that membrane translocation is happening like in other flavonoids, epigallocatechin Gallate or kaempferol, among others, which increase GLUT4 membrane translocation in adipocytes after treatments [Citation58–60].
Another possibility is that the higher glucose uptake is due to the activity of another transporter, like Glucose transporter type 12 (GLUT12) [Citation61]. GLUT12 is a second insulin-responsive glucose transporter in the white adipose and skeletal tissue [Citation61,Citation62]. However, unlike GLUT4 and Glucose transporter type 1(GLUT1), GLUT12 does not decrease due to inflammatory stimuli such as hypoxia or TNFα [Citation61,Citation63,Citation64]. It seems that GLUT12 could compensate for the inflammation-induced down-regulation of GLUT4 in adipose tissue of obese mice and 3T3-L1 adipocytes [Citation61]. Possibly, silybin in our model could induce GLUT12 expression by unknown mechanisms.
We also cannot rule out that silybin’s beneficial effect on glucose uptake is similar to other plant flavonoids that have an additional effect on PPARγ [Citation65,Citation66] and adiponectin expression levels [Citation67]. Under inflammatory conditions, TNFα reduces PPARγ expression, while its blockade restores PPARγ levels and functions on adipokines like adiponectin in 3T3-L1 adipocyte cells, increasing glucose uptake [Citation65–67].
In conclusion, our data show that inflammatory stimuli like TNFα and LPS increase TNFα levels in the supernatant, lowering glucose uptake significantly due to the decrease in membrane GLUT4 expression, simulating an insulin-resistance in vitro model [Citation68,Citation69]. Silybin improves this alteration by diminishing TNFα levels and upregulating glucose uptake by 3T3-L1 cells in the prophylactic and therapeutic administrations. However, this improvement of the insulin resistance state was not modulated by GLUT4 expression. More studies are needed to elucidate further the possible mechanisms involved in improving insulin resistance by silybin.
4. Materials and methods
4.1. 3T3-L1 cell culture
Twelve thousand five hundred 3T3-L1 cells were cultured in 24-well plates in complete medium [RPMI-1640 (R1383; Sigma-Aldrich) supplemented with 5 mmol of glucose and 10% foetal bovine serum (FBS)], and 1% penicillin–streptomycin mixed solution in a humidified atmosphere at 37°C and 5% CO2. Cells reached confluence after two days; two days later, cells received differentiation medium (RPMI-1640, 10% FBS, 1 μM dexamethasone, 1 μM insulin, and 0.5 mM isobutylmethylxanthine) to induce 3T3-L1 differentiation (Day 0). Three days later, the medium was replaced with a maturation medium (complete medium with 1 μM insulin; Day 3), which was changed every second day. After ten days of initiating the differentiation, adipocytes presented multiloculated lipid vacuoles (Day 10; ).
4.2. Inflammatory challenges and silybin treatment
For the preventive effect of silybin, 3T3-L1 cells were pre-treated with 30 or 80 µM of silybin (S0417 Sigma) in DMSO for 24 h in the maturation medium [Citation70,Citation71]. The DMSO final concentration for silybin treatments was less than 0.01% [Citation72]. The cell medium was replaced after cells were washed five times with RPMI supplemented with FBS 10%. The cells were then challenged with 2 ng/mL of lipopolysaccharide (LPS; L4391 Sigma) for 4 h [Citation73,Citation74] or 2 ng/mL of recombinant mouse TNFα (29-8321-65 Invitrogen, ThermoFisher) for 6 h [Citation35,Citation75] in maturation medium (, pre-treatment).
The potential therapeutical effect of silybin was evaluated by first challenging the cells with the inflammatory stimuli (LPS or TNFα) for 4 and 6 h, respectively; cells were washed, cell medium was replaced, and cells were treated with 30 or 80 µM of silybin for 24 h (, post-treatment).
Control cells received either the vehicles DMSO and sterile water, TNFα, LPS, silybin 30 µM, or silybin 80 µM.
After incubation with TNFα, LPS, or silybin, the cells were washed and incubated with fresh maturation medium for another 30 min. The cells were recovered for the glucose uptake or GLUT4 protein expression assays and the cell supernatants for TNFα determination.
4.3. TNFα determination by ELISA
The levels of TNFα were measured in cell supernatant by sandwich ELISA (TNFα Mouse ELISA Kit 88–7324; eBioscience). Samples were incubated for 18 h at four °C with PBS-Tween 20 (0.05%)-0.5% BSA, washed three times, and incubated with the corresponding detection antibody for two h at room temperature. The reaction was detected using TMB as the substrate. Optical density readings were done at 450 nm in a spectrophotometer (EPOCH, BioTek). All assays were performed by duplicated, and the assay sensitivity was 3.13 pg/mL.
4.4. Glucose uptake
To analyse glucose uptake, the fluorescent glucose analog, 2-(N-[7-nitrobenz-2-oxa-1,3-diazol-4-yl] amino)-2-deoxyglucose (2-NBDG; N13195 Invitrogen, Thermo Fisher Scientific), was used for direct quantification of glucose incorporation in living cells by flow cytometry [Citation76,Citation77]. After the challenges, the cells were washed and then transferred to cytometry tubes with phosphate-buffered saline (PBS) containing glucose 0.25 mM and insulin ten μIU/mL in the presence of 100 µM 2-NBDG. After 40 min incubation, cells were washed twice with PBS, trypsinized, centrifuged, and resuspended in PBS, and 150 µL of 4% paraformaldehyde was added. Ten thousand events were analysed in a FACSaria fusion 2 L 8C (Becton Dickinson), and 2-NBDG was measured using the green fluorescence (520 nm) channel FL1. The 3T3L1 adipocytes represented more than 60% of the 10,000 analysed events in all experiments, and 2-NBDG determinations were only made in the adipocyte region. Duplicated events and detritus were excluded. Results were expressed as an index of mean fluorescence intensity (MFI) of treated samples divided by the MFI of control samples (only treated with vehicles).
4.5. GLUT4 detection
With some modifications, GLUT4 protein expression was determined with flow cytometry (Koshy et al., 2010). After treatments, cells were washed in PBS without Ca2+ and Mg2+, with 2% FBS and 0.002% sodium azide added (FACS buffer). Cells were then centrifuged, suspended in the FACS buffer, and incubated for 20 min at 4°C with the anti-GLUT4 antibody (dilution 1:50, AB48547, Abcam). The cells were washed and incubated with the Alexa-488-secondary antibody (dilution 1:40, AB150115, Abcam) on ice for 40 min in the dark. After the incubation, 1 mL washing buffer for FACS was added to each sample. The samples were then vortexed and centrifuged, the supernatant was removed, and a 0.5 mL washing buffer for FACS was added with 1% formaldehyde. Without the primary antibody, the control samples were treated only with the Alexa-488-secondary antibody anti-rabbit IgG (AB150073, Abcam). Each experiment analysed a minimum of 10,000 cells per treatment condition. The 3T3L1 adipocytes represented more than 60% of the 10,000 analysed events in all experiments, and GLUT4 determinations were only made in the adipocyte region. Gates were set to exclude nonviable cells, cell debris, and duplicated events. Results were expressed as an index of MFI of stained samples/MFI control samples.
4.6. Statistical analysis
The experimental data are presented as mean values ± SEM from 5 to 10 biological replicates carried out in at least three independent experiments. The results were processed in GraphPad Prism 9. Statistical differences between experimental groups were determined using a one-way analysis of variance test (ANOVA), followed by post hoc Dunnett’s test. p ≤ 0.05 was considered significant.
Acknowledgments
A.B.N is a doctoral student from Programa de Doctorado en Ciencias Biomédicas, UNAM, and received fellowship 299310 from CONACYT. The authors thank Daniel Cabello and Luis Blas for their technical support with cell culture and the core facility flow cytometry of the ESM-IPN. They are also grateful to Bernardo Pohlenz for his artwork assistance.
Disclosure statement
No potential conflict of interest was reported by the author(s).
Data availability statement
The data supporting this study’s findings are available from the corresponding authors upon reasonable request.
Additional information
Funding
References
- NCD Risk Factor Collaboration N-R. Trends in adult body-mass index in 200 countries from 1975 to 2014: a pooled analysis of 1698 population-based measurement studies with 19.2 million participants. Lancet. 2016 Apr 2;387(10026):1377–11. doi: 10.1016/S0140-6736(16)30054-X
- Fruh SM. Obesity: risk factors, complications, and strategies for sustainable long-term weight management. J Am Assoc Nurse Pract. 2017 Oct;29(S1):S3–s14. doi: 10.1002/2327-6924.12510
- Nimptsch K, Konigorski S, Pischon T. Diagnosis of obesity and use of obesity biomarkers in science and clinical medicine. Metabolism. 2019 Mar;92:61–70. doi: 10.1016/j.metabol.2018.12.006
- Samuel VT, Shulman GI. The pathogenesis of insulin resistance: integrating signaling pathways and substrate flux. J Clin Invest. 2016 Jan;126(1):12–22. doi: 10.1172/JCI77812
- Petersen MC, Shulman GI. Mechanisms of insulin action and insulin resistance. Physiol Rev. 2018 Oct 1;98(4):2133–2223. doi: 10.1152/physrev.00063.2017
- Sesti G. Pathophysiology of insulin resistance. Best Pract Res Clin Endocrinol Metab. 2006 Dec;20(4):665–679. doi: 10.1016/j.beem.2006.09.007
- Xu H, Barnes GT, Yang Q, et al. Chronic inflammation in fat plays a crucial role in the development of obesity-related insulin resistance. J Clin Invest. 2003 Dec;112(12):1821–1830. doi: 10.1172/JCI200319451
- Dandona P. Inflammation: the link between insulin resistance, obesity and diabetes. Trends Immunol. 2004;25(1):4–7. doi: 10.1016/j.it.2003.10.013
- Stephens JM, Lee J, Pilch PF. Tumor necrosis factor-alpha-induced insulin resistance in 3T3-L1 adipocytes is accompanied by a loss of insulin receptor substrate-1 and GLUT4 expression without a loss of insulin receptor-mediated signal transduction. J Biol Chem. 1997;272(2):971–976. doi: 10.1074/jbc.272.2.971
- Nieto-Vazquez I, Fernandez-Veledo S, Kramer DK, et al. Insulin resistance associated to obesity: the link TNF-alpha. Arch Physiol Biochem. 2008 Jul;114(3):183–194. doi: 10.1080/13813450802181047
- Moreno-Navarrete JM, Ortega F, Serino M, et al. Circulating lipopolysaccharide-binding protein (LBP) as a marker of obesity-related insulin resistance. Int J Obes (Lond). 2012 Nov;36(11):1442–1449. doi: 10.1038/ijo.2011.256
- Mastron JK, Siveen KS, Sethi G, et al. Silymarin and hepatocellular carcinoma: a systematic, comprehensive, and critical review. Anticancer Drugs. 2015 Jun;26(5):475–486. doi: 10.1097/CAD.0000000000000211
- Ebrahimpour Koujan S, Gargari BP, Mobasseri M, et al. Effects of Silybum marianum (L.) Gaertn. (silymarin) extract supplementation on antioxidant status and hs-CRP in patients with type 2 diabetes mellitus: a randomized, triple-blind, placebo-controlled clinical trial. Phytomedicine. 2015 Feb 15;22(2):290–296. doi: 10.1016/j.phymed.2014.12.010
- Bijak M. Silybin, a major bioactive component of milk thistle (Silybum marianum L. Gaernt.)—chemistry, bioavailability, and metabolism. Molecules. 2017 Nov 10;22(11):1942. doi: 10.3390/molecules22111942
- Esmaeil N, Anaraki SB, Gharagozloo M, et al. Silymarin impacts on immune system as an immunomodulator: one key for many locks. Int Immunopharmacol. 2017;50:194–201. doi: 10.1016/j.intimp.2017.06.030
- Ebrahimpour-Koujan S, Gargari BP, Mobasseri M, et al. Lower glycemic indices and lipid profile among type 2 diabetes mellitus patients who received novel dose of Silybum marianum (L.) Gaertn. (silymarin) extract supplement: a triple-blinded randomized controlled clinical trial. Phytomedicine. 2018;44:39–44. doi: 10.1016/j.phymed.2018.03.050
- Hadi A, Pourmasoumi M, Mohammadi H, et al. The effects of silymarin supplementation on metabolic status and oxidative stress in patients with type 2 diabetes mellitus: a systematic review and meta-analysis of clinical trials. Complement Ther Med. 2018 Dec;41:311–319. doi: 10.1016/j.ctim.2018.08.010
- Manna SK, Mukhopadhyay A, Van NT, et al. Silymarin suppresses TNF-induced activation of NF-kappa B, c-Jun N-terminal kinase, and apoptosis. J Immunol. [1999 Dec 15];163(12):6800–6809. doi: 10.4049/jimmunol.163.12.6800
- Matsuda T, Ferreri K, Todorov I, et al. Silymarin protects pancreatic beta-cells against cytokine-mediated toxicity: implication of c-Jun NH2-terminal kinase and janus kinase/signal transducer and activator of transcription pathways. Endocrinology. 2005 Jan;146(1):175–185. doi: 10.1210/en.2004-0850
- Bannwart CF, Peracoli JC, Nakaira-Takahagi E, et al. Inhibitory effect of silibinin on tumour necrosis factor-alpha and hydrogen peroxide production by human monocytes. Nat Prod Res. 2010 Nov;24(18):1747–1757. doi: 10.1080/14786410903314492
- Yao J, Zhi M, Gao X, et al. Effect and the probable mechanisms of silibinin in regulating insulin resistance in the liver of rats with non-alcoholic fatty liver. Braz J Med Biol Res. 2013 Mar;46(3):270–277. doi: 10.1590/1414-431X20122551
- Li HB, Yang YR, Mo ZJ, et al. Silibinin improves palmitate-induced insulin resistance in C2C12 myotubes by attenuating IRS-1/PI3K/Akt pathway inhibition. Braz J Med Biol Res. 2015 May;48(5):440–446. doi: 10.1590/1414-431X20144238
- Cho JY, Kim PS, Park J, et al. Inhibitor of tumor necrosis factor-alpha production in lipopolysaccharide-stimulated RAW264.7 cells from Amorpha fruticosa. J Ethnopharmacol. 2000 May;70(2):127–133. doi: 10.1016/S0378-8741(99)00154-3
- Shanmugam K, Holmquist L, Steele M, et al. Plant-derived polyphenols attenuate lipopolysaccharide-induced nitric oxide and tumour necrosis factor production in murine microglia and macrophages. Mol Nutr Food Res. 2008 Apr;52(4):427–438. doi: 10.1002/mnfr.200700180
- Tyagi A, Agarwal C, Dwyer-Nield LD, et al. Silibinin modulates TNF-alpha and IFN-gamma mediated signaling to regulate COX2 and iNOS expression in tumorigenic mouse lung epithelial LM2 cells. Mol Carcinog. 2012 Oct;51(10):832–842. doi: 10.1002/mc.20851
- Peraldi P, Spiegelman B. TNF-alpha and insulin resistance: summary and future prospects. Mol Cell Biochem. 1998 May;182(1–2):169–175. doi: 10.1023/A:1006865715292
- Singer K, Lumeng CN. The initiation of metabolic inflammation in childhood obesity. J Clin Investig. 2017 Jan 3;127(1):65–73. doi: 10.1172/JCI88882
- Leber B, Tripolt NJ, Blattl D, et al. The influence of probiotic supplementation on gut permeability in patients with metabolic syndrome: an open label, randomized pilot study. Eur J Clin Nutr. 2012 Oct;66(10):1110–1115. doi: 10.1038/ejcn.2012.103
- Tuomi K, Logomarsino JV. Bacterial lipopolysaccharide, lipopolysaccharide-binding protein, and other inflammatory markers in obesity and after bariatric surgery. Metab Syndr Relat Disord. 2016 Aug;14(6):279–288. doi: 10.1089/met.2015.0170
- Cox AJ, Zhang P, Bowden DW, et al. Increased intestinal permeability as a risk factor for type 2 diabetes. Diabetes Metab. 2017 Apr;43(2):163–166. doi: 10.1016/j.diabet.2016.09.004
- Musso G, Gambino R, Cassader M. Gut microbiota as a regulator of energy homeostasis and ectopic fat deposition: mechanisms and implications for metabolic disorders. Curr Opin Lipidol. 2010 Feb;21(1):76–83. doi: 10.1097/MOL.0b013e3283347ebb
- Ely BR, Clayton ZS, McCurdy CE, et al. Meta-inflammation and cardiometabolic disease in obesity: can heat therapy help? Temperature (Austin). 2018;5(1):9–21. doi: 10.1080/23328940.2017.1384089
- Li C, Xu MM, Wang K, et al. Macrophage polarization and meta-inflammation. Transl Res. 2018 Jan;191:29–44. doi: 10.1016/j.trsl.2017.10.004
- Hotamisligil GS, Shargill NS, Spiegelman BM. Adipose expression of tumor necrosis factor-alpha: direct role in obesity-linked insulin resistance. Science. 1993 Jan 1;259(5091):87–91. doi: 10.1126/science.7678183
- Cawthorn WP, Heyd F, Hegyi K, et al. Tumour necrosis factor-alpha inhibits adipogenesis via a beta-catenin/TCF4(TCF7L2)-dependent pathway. Cell Death Diff. 2007 Jul;14(7):1361–1373. doi: 10.1038/sj.cdd.4402127
- Dordevic AL, Konstantopoulos N, Cameron-Smith D. 3T3-L1 preadipocytes exhibit heightened monocyte-chemoattractant protein-1 response to acute fatty acid exposure. PLOS ONE. 2014;9(6):e99382. doi: 10.1371/journal.pone.0099382
- Hou YC, Liou KT, Chern CM, et al. Preventive effect of silymarin in cerebral ischemia-reperfusion-induced brain injury in rats possibly through impairing NF-kappaB and STAT-1 activation. Phytomedicine. 2010 Oct;17(12):963–973. doi: 10.1016/j.phymed.2010.03.012
- Wang C, Wang Z, Zhang X, et al. Protection by silibinin against experimental ischemic stroke: up-regulated pAkt, pmTOR, HIF-1alpha and Bcl-2, down-regulated Bax, NF-kappaB expression. Neurosci Lett. 2012 Oct 31;529(1):45–50. doi: 10.1016/j.neulet.2012.08.078
- Lee Y, Chun HJ, Lee KM, et al. Silibinin suppresses astroglial activation in a mouse model of acute Parkinson’s disease by modulating the ERK and JNK signaling pathways. Brain Res. 2015 Nov 19;1627:233–242. doi: 10.1016/j.brainres.2015.09.029
- Tian L, Li W, Wang T. Therapeutic effects of silibinin on LPS-induced acute lung injury by inhibiting NLRP3 and NF-kappaB signaling pathways. Microb Pathog. 2017 Jul;108:104–108. doi: 10.1016/j.micpath.2017.05.011
- Zhang B, Wang B, Cao S, et al. Silybin attenuates LPS-induced lung injury in mice by inhibiting NF-kappaB signaling and NLRP3 activation. Int J Mol Med. 2017 May;39(5):1111–1118. doi: 10.3892/ijmm.2017.2935
- Salamone F, Galvano F, Cappello F, et al. Silibinin modulates lipid homeostasis and inhibits nuclear factor kappa B activation in experimental nonalcoholic steatohepatitis. Transl Res. 2012 Jun;159(6):477–486. doi: 10.1016/j.trsl.2011.12.003
- Gu M, Zhao P, Huang J, et al. Silymarin ameliorates metabolic dysfunction associated with diet-induced obesity via activation of farnesyl X receptor. Front Pharmacol. 2016;7:345. doi: 10.3389/fphar.2016.00345
- Kim SH, Oh DS, Oh JY, et al. Silymarin prevents restraint stress-induced acute liver injury by ameliorating oxidative stress and reducing inflammatory response. Molecules. 2016 Apr 1;21(4):443. doi: 10.3390/molecules21040443
- Vecchione G, Grasselli E, Voci A, et al. Silybin counteracts lipid excess and oxidative stress in cultured steatotic hepatic cells. World J Gastroenterol. 2016 Jul 14;22(26):6016–6026. doi: 10.3748/wjg.v22.i26.6016
- Ou Q, Weng Y, Wang S, et al. Silybin alleviates hepatic steatosis and fibrosis in NASH mice by inhibiting oxidative stress and involvement with the Nf-kappaB pathway. Dig Dis Sci. 2018 Dec;63(12):3398–3408. doi: 10.1007/s10620-018-5268-0
- Wang L, Huang QH, Li YX, et al. Protective effects of silymarin on triptolide-induced acute hepatotoxicity in rats. Mol Med Rep. 2018 Jan;17(1):789–800. doi: 10.3892/mmr.2017.7958
- Liu X, Xu Q, Liu W, et al. Enhanced migration of murine fibroblast-like 3T3-L1 preadipocytes on type I collagen-coated dish is reversed by silibinin treatment. Mol Cell Biochem. 2018 Apr;441(1–2):35–62. doi: 10.1007/s11010-017-3173-z
- Liu X, Xu Q, Long X, et al. Silibinin-induced autophagy mediated by PPARalpha-sirt1-AMPK pathway participated in the regulation of type I collagen-enhanced migration in murine 3T3-L1 preadipocytes. Mol Cell Biochem. 2019 Jan;450(1–2):1–23. doi: 10.1007/s11010-018-3368-y
- Hirosumi J, Tuncman G, Chang L, et al. A central role for JNK in obesity and insulin resistance. Nature. 2002 Nov 21;420(6913):333–336. doi: 10.1038/nature01137
- Xie L, Ortega MT, Mora S, et al. Interactive changes between macrophages and adipocytes. Clin Vaccine Immunol. 2010 Apr;17(4):651–659. doi: 10.1128/CVI.00494-09
- Akash MSH, Rehman K, Liaqat A. Tumor necrosis factor-alpha: role in development of insulin resistance and pathogenesis of type 2 diabetes mellitus. J Cell Biochem. 2018 Jan;119(1):105–110. doi: 10.1002/jcb.26174
- Mendez-Garcia LA, Trejo-Millan F, Martinez-Reyes CP, et al. Infliximab ameliorates tumor necrosis factor-alpha-induced insulin resistance by attenuating PTP1B activation in 3T3L1 adipocytes in vitro. Scand J Immunol. 2018 Nov;88(5):e12716. doi: 10.1111/sji.12716
- Cisneros-Zevallos L, Bang WY, Delgadillo-Puga C. Ellagic acid and urolithins a and B differentially regulate fat accumulation and inflammation in 3T3-L1 adipocytes while not affecting adipogenesis and insulin sensitivity. Int J Mol Sci. 2020 Mar 18;21(6):2086. doi: 10.3390/ijms21062086
- Fernandez-Veledo S, Vila-Bedmar R, Nieto-Vazquez I, et al. c-Jun N-terminal kinase 1/2 activation by tumor necrosis factor-alpha induces insulin resistance in human visceral but not subcutaneous adipocytes: reversal by liver X receptor agonists. J Clin Endocrinol Metab. 2009 Sep;94(9):3583–3593. doi: 10.1210/jc.2009-0558
- Nomura M, Takahashi T, Nagata N, et al. Inhibitory mechanisms of flavonoids on insulin-stimulated glucose uptake in MC3T3-G2/PA6 adipose cells. Biol Pharm Bull. 2008 Jul;31(7):1403–1409. doi: 10.1248/bpb.31.1403
- Zhan T, Digel M, Kuch EM, et al. Silybin and dehydrosilybin decrease glucose uptake by inhibiting GLUT proteins. J Cell Biochem. 2011 Mar;112(3):849–859. doi: 10.1002/jcb.22984
- Tzeng YM, Chen K, Rao YK, et al. Kaempferitrin activates the insulin signaling pathway and stimulates secretion of adiponectin in 3T3-L1 adipocytes. Eur J Pharmacol. 2009 Apr 1;607(1–3):27–34. doi: 10.1016/j.ejphar.2009.01.023
- Russo B, Picconi F, Malandrucco I, et al. Flavonoids and Insulin-Resistance: From Molecular Evidences to Clinical Trials. Int J Mol Sci. 2019 Apr 26;20(9). doi: 10.3390/ijms20092061
- Komakula SB, Tiwari AK, Singh S. A novel quantitative assay for analysis of GLUT4 translocation using high content screening. Biomed & Pharmacother. 2021 Jan;133:111032. doi: 10.1016/j.biopha.2020.111032
- Gil-Iturbe E, Arbones-Mainar JM, Moreno-Aliaga MJ, et al. GLUT12 and adipose tissue: expression, regulation and its relation with obesity in mice. Acta Physiologica. 2019 Aug;226(4):e13283. doi: 10.1111/apha.13283
- Stuart CA, Howell MEA, Zhang Y, et al. Insulin-stimulated translocation of glucose transporter (GLUT) 12 parallels that of GLUT4 in normal muscle. J Clin Endocrinol Metab. 2012;94(9):3535–3542. doi: 10.1210/jc.2009-0162
- Kozka IJ, Clark AE, Holman GD. Chronic treatment with insulin selectively down-regulates cell-surface GLUT4 glucose transporters in 3T3-L1 adipocytes. J Biol Chem. 1991 Jun 25;266(18):11726–11731. doi: 10.1016/S0021-9258(18)99017-4
- Gil-Iturbe E, Castilla-Madrigal R, Barrenetxe J, et al. GLUT12 expression and regulation in murine small intestine and human Caco-2 cells. J Cell Physiol. 2019 Apr;234(4):4396–4408. doi: 10.1002/jcp.27231
- Luna-Vital D, Weiss M, Gonzalez de Mejia E. Anthocyanins from purple corn ameliorated tumor necrosis factor-alpha-induced inflammation and insulin resistance in 3T3-L1 adipocytes via activation of insulin signaling and enhanced GLUT4 translocation. Mol Nutr Food Res. 2017 Dec;61(12). doi: 10.1002/mnfr.201700362
- Guo T, Pan Y, Yang L, et al. Flavonoid compound from Agrimonia pilosa Ledeb improves adipose insulin resistance by alleviating oxidative stress and inflammation. BMC Complement Med Ther. 2023 Sep 14;23(1):322. doi: 10.1186/s12906-023-04114-5
- Kim JN, Han SN, Kim HK. Anti-inflammatory and anti-diabetic effect of black soybean anthocyanins: data from a dual cooperative cellular system. Molecules. 2021 Jun 2;26(11):3363. doi: 10.3390/molecules26113363
- Xing L, Zhang H, Majumder K, et al. Gamma-glutamylvaline prevents low-grade chronic inflammation via activation of a calcium-sensing receptor pathway in 3T3-L1Mouse adipocytes. J Agric Food Chem. 2019 Jul 31;67(30):8361–8369. doi: 10.1021/acs.jafc.9b02334
- Al-Jaber H, Al-Muraikhy S, Jabr AJ, et al. Comparing methods for induction of insulin resistance in mouse 3T3-L1 cells. Curr Diabetes Rev. 2024 Jan 9;20. doi: 10.2174/0115733998263359231211044539
- Polyak SJ, Morishima C, Lohmann V, et al. Identification of hepatoprotective flavonolignans from silymarin. Proc Natl Acad Sci USA. 2010 Mar 30;107(13):5995–5999. doi: 10.1073/pnas.0914009107
- Suh HJ, Cho SY, Kim EY, et al. Blockade of lipid accumulation by silibinin in adipocytes and zebrafish. Chem Biol Interact. 2015 Feb 5;227:53–62. doi: 10.1016/j.cbi.2014.12.027
- Dludla PV, Jack B, Viraragavan A, et al. A dose-dependent effect of dimethyl sulfoxide on lipid content, cell viability and oxidative stress in 3T3-L1 adipocytes. Toxicol Rep. 2018;5:1014–1020. doi: 10.1016/j.toxrep.2018.10.002
- Cullberg KB, Larsen JO, Pedersen SB, et al. Effects of LPS and dietary free fatty acids on MCP-1 in 3T3-L1 adipocytes and macrophages in vitro. Nutr Diabetes. 2014 Mar 24;4(3):e113. doi: 10.1038/nutd.2014.10
- Cisneros-Zevallos L, Bang WY, Delgadillo-Puga C. Ellagic acid and urolithins a and B differentially regulate fat accumulation and inflammation in 3T3-L1 adipocytes while not affecting adipogenesis and insulin sensitivity. IJMS. 2020;21(6):2086. doi: 10.3390/ijms21062086
- Om XL, Mora S, Chapes SK. Interactive changes between macrophages and adipocytes. Clin Vaccine Immunol. 2010;17(4):651–659. doi: 10.1128/CVI.00494-09
- Dhanya R, Arun KB, Syama HP, et al. Rutin and quercetin enhance glucose uptake in L6 myotubes under oxidative stress induced by tertiary butyl hydrogen peroxide. Food Chem. 2014 Sep 1;158:546–554. doi: 10.1016/j.foodchem.2014.02.151
- Sasikumar P, Lekshmy K, Sini S, et al. Isolation and characterization of resveratrol oligomers from the stem bark of Hopea ponga (Dennst.) Mabb. And their antidiabetic effect by modulation of digestive enzymes, protein glycation and glucose uptake in L6 myocytes. J Ethnopharmacol. 2019;236:196–204. doi: 10.1016/j.jep.2019.01.046