
Abstract
Cancer chemotherapy using cytotoxic drugs can induce immunogenic tumor cell death; however, dosing regimens and schedules that enable single-agent chemotherapy to induce adaptive immune-dependent ablation of large, established tumors with activation of long-term immune memory have not been identified. Here, we investigate this issue in a syngeneic, implanted GL261 glioma model in immune-competent mice given cyclophosphamide on a 6-day repeating metronomic schedule. Two cycles of metronomic cyclophosphamide treatment induced sustained upregulation of tumor-associated CD8+ cytotoxic T lymphocyte (CTL) cells, natural killer (NK) cells, macrophages, and other immune cells. Expression of CTL- and NK–cell-shared effectors peaked on Day 6, and then declined by Day 9 after the second cyclophosphamide injection and correlated inversely with the expression of the regulatory T cell (Treg) marker Foxp3. Sustained tumor regression leading to tumor ablation was achieved after several cyclophosphamide treatment cycles. Tumor ablation required CD8+ T cells, as shown by immunodepletion studies, and was associated with immunity to re-challenge with GL261 glioma cells, but not B16-F10 melanoma or Lewis lung carcinoma cells. Rejection of GL261 tumor re-challenge was associated with elevated CTLs in blood and increased CTL infiltration in tumors, consistent with the induction of long-term, specific CD8+ T-cell anti-GL261 tumor memory. Co-depletion of CD8+ T cells and NK cells did not inhibit tumor regression beyond CD8+ T-cell depletion alone, suggesting that the metronomic cyclophosphamide-activated NK cells function via CD8a+ T cells. Taken together, these findings provide proof-of-concept that single-agent chemotherapy delivered on an optimized metronomic schedule can eradicate large, established tumors and induce long-term immune memory.
Abbreviations:
- B6, C57BL/6 mouse strain
- CPA, cyclophosphamide
- CPA-90 and CPA-140, metronomic CPA scheduling at 90 and 140 mg CPA/kg body weight, respectively, repeated every 6 days
- CTL, cytotoxic T lymphocyte
- FACS, fluorescence-activated cell sorting
- LLC, Lewis lung carcinoma
- MDSC, myeloid-derived suppressor cells
- MTD, maximum-tolerated dose
- NK cell, natural killer cell
- PEB, phosphate-EDTA buffer
- qPCR, quantitative real-time polymerase chain reaction
Introduction
Chemotherapy is widely used for cancer treatment; however, it is less than optimally effective, with drug resistance leading to tumor regrowth after a short period of tumor shrinkage or tumor growth stasis, as commonly seen with difficult-to-treat tumors, such as glioblastoma.Citation1 Tumor-cell drug resistance is difficult to avoid due to the heterogeneous nature of tumor cell populations and their high mutation rate.Citation2,3 Cancer-directed immune-based therapies offer an attractive alternative; however, many such therapies, including cancer vaccines and adoptive transfer of antitumor T cells, are only modestly effective in the clinic.Citation4-7 Immune escape mechanisms vary between tumor types and stagesCitation8,9 and potent immunotherapeutic regimens often are associated with severe toxicities.Citation10,11 The goal of effective personalized immunotherapy has been elusive, despite important recent successes, such as the anti-CTLA-4 treatment for metastatic melanoma.Citation12 One approach to this problem is to employ therapies based on traditional cancer chemotherapeutic drugs, which can directly kill tumor cells, and repurpose them to activate antitumor immune responses that enhance tumor regression and prevent tumor regrowth.
Several cancer chemotherapeutic drugs have the intrinsic capacity to induce immunogenic cell death.Citation13 Tumor cells treated with chemotherapeutic drugs can be used as a tumor vaccine to confer immunity against subsequent live tumor cell challengeCitation13-16, and intratumoral injection of antineoplastic agents can elicit short-term primary immunity.Citation16,17 However, it is unclear whether single-agent chemotherapy, when delivered systemically in the absence of immunotherapy, can effect robust, immune–cell-dependent ablation of large, well-established tumors with the activation of long-term immune memory. Further, even for drugs that can induce immunogenic cell death,Citation13 chemotherapeutic drug doses and schedules that preserve the intrinsic potential for immune activation without ablating responding immune cells need to be identified to avoid the immunosuppressive responses commonly seen with conventional maximum-tolerated dose (MTD) chemotherapy schedules.Citation18,19
Cyclophosphamide (CPA) is a bifunctional alkylating agent prodrug used to treat oncogenic and autoimmune diseases.Citation20 CPA can induce immunogenic tumor cell death by inducing tumor cell surface expression of the “eat-me” signal calreticulin and by releasing HMGB1, which stimulates cross-presentation of tumor antigens to T cells.Citation21 Moreover, CPA can deplete immune-suppressive regulatory T (Treg) cells and can induce a cytokine storm, which includes the production of type I interferons that boost the differentiation and mobilization of mature dendritic cells (DCs) and expand T cells with a memory phenotype.Citation21-25 For CPA and certain other cytotoxic anticancer drugs, immunogenic responses can be achieved when using metronomic drug-delivery schedules,Citation26,27 wherein the drug is administered at a lower dose, but at regular and more frequent intervals than conventional MTD cancer chemotherapy.Citation28
Our previous studies showed that administration of CPA on an intermittent, every 6-day metronomic schedule activates a robust, innate antitumor immune response in several glioma models, as seen in both scid immunodeficient mice and in immune-competent C57BL/6 (B6) mice.Citation26,29,30 The dependence of tumor regression on NK cells was established by NK-cell immunodepletion and by using mouse models deficient in NK cells or in the NK-cell effector perforin 1.Citation26 Furthermore, in studies using brain tumor xenografts implanted in scid mice, tumor recruitment of NK cells was not observed and tumor regression was not achieved when CPA was given every 3 days, or on a daily basis.Citation29 In addition, NK cell activation was not sustained when drug-free breaks were extended beyond 6 days.Citation30 Thus, the ability of CPA to activate a strong, sustained, innate antitumor immune response is highly dependent on the metronomic schedule. It is unclear, however, whether the 6–day-repeating metronomic schedule can activate a robust adaptive immune response, and whether it can ablate large implanted gliomas and activate long-term adaptive immunity. Here, we investigate these questions using a fully immune-competent, syngeneic GL261 glioma mouse model. Immune cell recruitment and activation were monitored in the metronomic CPA-treated tumors by the time-dependent changes in immune cell marker genes. The contribution of CD8+ T cells to CPA-induced tumor regression was investigated by immunodepletion, and the activation of specific, long-term antitumor immune memory was examined by re-challenging CPA-cured mice with GL261 glioma cells and by cross-challenging with B16-F10 melanoma and Lewis lung carcinoma (LLC) cells. Our findings are discussed in terms of the impact of metronomic CPA dose and schedule on tumor regression, immune responses, and memory formation, and the induction of effector pathways associated with CTLs and NK cells.
Results
Metronomic CPA Treatment Activates Significant CD8+ T-cell Responses
GL261 tumors were implanted in B6 mice that then received 2 cycles of metronomic CPA treatment. A prolonged period of tumor regression, lasting at least 15 days, was induced, beginning shortly after the second CPA injection (). Analysis of changes of expressed immune cell marker genes in the tumor compartment indicated that NK-cell (Nkp46) and CD8+ T-cell responses were already induced by the first CPA cycle (). No changes in Nkp46 expression were seen when comparing Day 6 after the first CPA treatment to Day 7 (i.e., Day 1 after the second CPA treatment), consistent with our findings in scid mice, where CPA ablation of the tumor-associated NK-cell population was not apparent until after the second CPA injection.Citation30 The CTL marker CD8a and the immune-suppressive Treg cell marker Foxp3 were significantly decreased 3 days after the first CPA injection and rebounded on Day 6. CD8a increases seen on Day 6 returned to baseline 1 day after the second CPA treatment (Day 7; ).
Figure 1. GL261 tumor regression and NK-cell and T-cell recruitment are induced by 2 cycles of metronomic CPA treatment. (A) Growth curves of GL261 tumors that were untreated or treated with 2 cycles of metronomic CPA-140. Data shown are normalized tumor volumes, mean ± SEM, for untreated tumors (n = 13, days 0–6, and n = 7, days 7–9) and n = 6 CPA-treated tumors. Mean tumor volumes on the day of first CPA treatment (Day 0) = 395 ± 135 mm3 (untreated tumors) and 762 ± 92 mm3 (CPA-treated tumors). (B, C) Time course of changes in marker genes for NK cells (NKp46), CD8+ T cells (Cd8a), their shared cytotoxic effectors (Prf1, Gzmb), Treg (Foxp3), and macrophages (Emr1), assayed by qPCR in GL261 tumors treated with 1 or 2 injections of metronomic CPA, as in A. Tumors were sampled 1, 3, 6 days after the first CPA injection and 1 day after the second CPA, as shown in B1 (B), or on days 6, 9, 12, and 15 after the second CPA injection (corresponding to 12, 15, 18, and 21 days after the first CPA treatment), as depicted in C1 (C). Data shown are relative gene expression levels compared to the mean values for untreated tumors after normalization to the 18S rRNA content of each sample, mean ± SEM: n = 7 untreated tumors, n = 5–8 CPA-treated tumors per time point. One-way ANOVA analysis for the indicated comparisons in (B) and (C): *, p < 0.05, **, p < 0.01, and ***, p < 0.001.
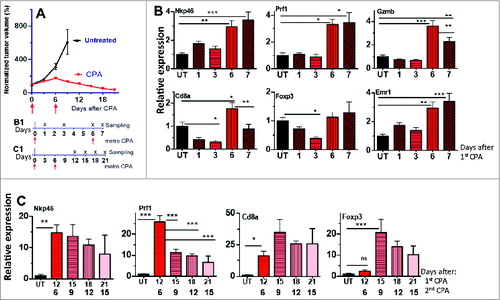
The 2- to 4-fold increases in tumor-associated CTLs, NK cells, and their shared cytotoxic effectors Prf1 and GzmbCitation31-33 seen 6 days after the first CPA injection () were further increased to 15- to 20-fold overall 6 days after the second CPA injection (, Fig. S1A). Large increases were also seen for tumor-associated macrophage (Cd68 and Emr1) and DC (Cd74) markers (Fig. S1A). These immune cell increases were largely sustained through Day 15. In contrast, the cytotoxic effectors Prf1 and Gzmb peaked on Day 6 and then decreased significantly, as seen on days 9, 12, and 15 after the second CPA treatment (, Fig. S1A). Prf1 levels correlated negatively with Foxp3 levels on days 6 and 9 after the second CPA treatment (, Fig. S1B), suggesting that Treg–cell-mediated suppressionCitation34,35 contributes to the decline in Prf1 and Gzmb seen after the second CPA injection.
Role of CD8+ T Cells in Metronomic CPA-Induced Tumor Regression
The metronomic CPA-treated tumors were depleted of CD8+ T cells, either alone (anti-Cd8a antibody) or in combination with NK-cell depletion (anti-Cd8a + anti-GM1 antibodies), to discern the contribution of each immune cell type to tumor regression. Fluorescence-activated cell sorting (FACS) analysis verified the effectiveness of immune cell depletion, both in blood and in the tumors (, Fig. S2), and the extent of depletion in tumors was confirmed by monitoring Cd8a and Nkp46 marker genes (). Neither antibody altered Cd68-marked macrophage levels, consistent with the established immune cell specificity of each antibody (). However, CD8+ T-cell immunodepletion slowed tumor regression significantly (), and to a greater extent than NK-cell immunodepletion (Fig. S3), indicating that the CD8+ T cells have a more significant contribution in CPA-induced tumor regression. The CPA-treated (CD8+ T cell + NK cell)-co-depleted tumors regressed significantly more slowly than NK–cell-depleted tumors; however, the rate of regression was indistinguishable from that of CPA-treated tumors depleted of CD8+ T cells alone (, Fig. S3). These findings support the hypothesis that the tumor-regressing activity associated with NK cells is dependent on, and may be mediated by, CD8+ T cells (model; ).
Figure 2. Contribution of CPA-140 induced NK cells and T cells to tumor regression. (A) FACS analysis of CTLs and NK cells in blood and tumors from untreated (“UT”) mice and from mice treated with CPA-140 (“CPA”), alone or in combination with anti-CD8a (“+αCd8”), or with anti-CD8a and anti-GM1 antibody (“+αCD8 +αGM1”). Error bar: mean ± SEM. Blood (cheek pouch sampling) and tumors were sampled 6 days after the second metronomic CPA injection. FACS analysis of blood CTLs and NK cells, n = 5 per group; and for tumor CTL and NK cell analysis, n = 8–13 untreated tumors, 6–12 CPA-treated tumors, 6 tumors treated with CPA + anti-CD8a, and 6 tumors treated with CPA + anti-Cd8a + anti-GM1. CD8+ T-cell depletion by anti-CD8a was 99% effective in blood and 97% effective in tumors. NK-cell depletion by anti-GM1 antibody against NK cells was 84% in blood and 69% in tumors. (B) Relative expression levels of the indicated immune cell and cytotoxic effector markers and Tgfb in untreated tumors (first bar) or in tumors treated with CPA-140, alone (second bar) or in combination with anti-CD8a (third bar), or anti-Cd8a + anti-GM1 (fourth bar). Tumors were sampled 6 days after the second CPA injection. Mean ± SEM: n = 6–9 tumors in each group. (C) Normalized growth curves for GL261 tumors treated with CPA-140, CPA-140 + anti-Cd8a, or CPA-140 + anti-Cd8a + anti-GM1. Tumor volumes on the day of first CPA treatment (Day 0) were as follows (mean volume ± SEM): 1517 ± 469 mm3 (6 untreated tumors), 1,490 ± 216 mm3 (11 tumors treated with CPA-140), 1,496 ± 277 mm3 (12 tumors treated with CPA-140 + anti-GM1; see data in Fig. S3), 1506 ± 402 mm3 (10 tumors treated with CPA-140 + anti-Cd8a), 1,668 ± 531 mm3 (8 tumors treated with CPA-140 + anti-Cd8a + anti-GM1). One-tailed t-test analysis 12, 18, 24, 30, and 36 days after treatment: *, p < 0.05; **, p < 0.01; ***, p < 0.001, when comparing CPA versus CPA + anti-CD8; ++, p < 0.01, +++, p < 0.001, when comparing CPA versus CPA + anti-CD8 + anti-GM1. After Day 51 (#), volume measurements shown reflect flat scar tissue that remained at the tumor site; no primary tumor regrowth was seen after discontinuation of CPA treatment. (D) Scheme for roles of CPA-activated NK cells and T cells in tumor regression (see text). One-way ANOVA analysis for A and B: *, p < 0.05; **, p < 0.01; ***, p < 0.001; 2-tailed t-test for select comparisons in B: +, p < 0.05.
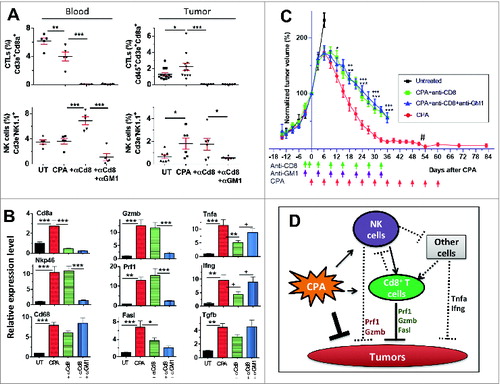
Next, we assayed the impact of NK cell and CD8+ T-cell depletion on 5 cytotoxic immune cell effectorsCitation36 induced by metronomic CPA treatment: Prf1, Gzmb, Tnfa, Ifng, and Fasl (). Prf1 and Gzmb levels in the CPA-treated tumors were unaffected by CD8+ T-cell depletion but were substantially reduced by CD8+ T-cell and NK-cell co-depletion (), suggesting NK cells are the primary source of Prf1 and Gzmb. Fasl was significantly (albeit partially) downregulated by CD8+ T-cell depletion, with a trend toward a further decrease seen upon co-depletion of NK cells (). Tnfa and Ifng were significantly reduced by CD8+ T-cell depletion; however, this inhibition was reversed upon co-depletion of NK cells. Metronomic CPA induction of Tgfb, an immune-suppressive and protumor growth factorCitation37, was largely independent of CD8+ T cells and NK cells (). Finally, CPA treatment significantly increased the lymphocyte-activating cytokines interleukin (IL)-15 and IL-18, consistent with systematic immune activation,Citation38 but the expression of these cytokines was only partially reduced upon CD8+ T-cell depletion, either with or without NK-cell depletion (Fig. S4). A model for the contributions of CD8+ T cells and NK cells to CPA-induced production of these cytotoxic mediators is shown in .
Impact of CPA Dose on CD8+ T-cell Dependence of GL261 Regression
The partial inhibition of tumor regression following CD8+ T-cell depletion () suggests that regression is dependent partially on CD8+ T cells and partially on the direct tumor cytotoxic action of CPA. To test this hypothesis, we examined the impact of reducing the every 6-day metronomic CPA dose from 140 mg CPA/kg (CPA-140) to 90 mg CPA/kg (CPA-90). CPA doses below 140 mg/kg are associated with a significant decrease in circulating 4-hydroxy-CPA – the active, cytotoxic metabolite.Citation29 CPA-90 induced major tumor regression (), as was also seen with CPA-140 treatment (); however, in contrast to CPA-140 treatment, a significant subset (5 out of 14) of the CPA–90-treated tumors did not undergo sustained regression (), which could be explained by the lower circulating 4-hydroxy-CPA levels at the lower CPA dose. Further, CPA-90 treatment significantly increased tumor recruitment of NK cells and CD8+ T cells in the regressing tumors, as well as the expression of the NK-cell and T-cell cytotoxic markers Prf1 and Gzmb (). CPA-90 also increased the expression of the DC co-stimulatory molecule Cd86 and several other genes important for NK-cell and T-cell proliferation and activation (IL15, IL18, Nkg2d, Fasl; Fig. S5).Citation36 The macrophage marker Emr1 was also up regulated, as was the cytokine Csf1 (Fig. S5), which is critical for macrophage development and proliferation.Citation39 Notably, CPA-90 induced a much stronger increase in the M1 (antitumor) macrophage marker inducible nitric oxide synthase (iNOS) than the M2 (pro-tumor) macrophage marker Arg1, suggesting antitumor macrophage polarization by CPA-90 treatment (Fig. S5). Several other factors associated with an immune-suppressive microenvironment were only moderately changed or were downregulated by CPA-90 treatment (Foxp3, marking Treg cells; VEGFA, which stimulates angiogenesis and is a chronic inflammation marker; and Hif1a, a hypoxia marker). CPA–140-treated tumors showed very similar expression profiles for each of these factors (Fig. S5).
Figure 3. CD8+ T-Cell depletion abolishes CPA–90-induced Gl261 tumor regression. (A) Normalized growth curves for GL261 tumors treated with CPA-90 alone (n = 5 unresponsive tumors; 9 responsive tumors) or CPA-90 + anti-CD8a antibody (n = 10) on days marked beneath the x-axis (arrows). Data shown are mean ± SEM. Mean tumor volume on the day of first CPA treatment (Day 0) was 897 ± 336 mm3 for CPA–90-unresponsive tumors, 702 ± 133 mm3 for CPA–90-responsive tumors and 847 ± 265 mm3 for the CPA-90 + anti-CD8 group. The CPA–90-unresponsive tumors grew significantly slower than tumors in the CPA-90 + anti-CD8 group starting from Day 18 after CPA treatment (+, p < 0.05, one-tailed t-test). (B) Growth curves for individual tumors treated with CPA-90 alone (left) or CPA-90 + anti-CD8a (right), with n = 5 unresponsive tumors and n = 9 regressing tumors 30 days after beginning CPA-90 treatment, which was significantly different from the CPA-90 + anti-CD8a co-treatment group (n = 9 unresponsive and n = 1 regressing tumors) by Fisher's exact test, p-value = 0.013. (C) Relative gene expression of NK-cell marker Nkp46, CTL marker Cd8a, and their common effectors Prf1 and Gzmb assayed by qPCR in GL261 tumors treated with 3 CPA-90 cycles, as in (A). Tumors were sampled 6 days after the third CPA injection. Mean ± SEM: n = 7 untreated tumors, n = 4 CPA–90-treated tumors. Two-tailed t-test: *, p < 0.05; **, p < 0.01; ***, p < 0.001. (D) FACS analysis of Cd3e+CD8a+ T-cell levels in peripheral blood from GL261-bearing untreated mice or mice treated with anit-CD8a antibody. Blood samples were collected from mouse tail tip 6 days after the second antibody injection, as shown in (A). Shown are representative plots from each group, with quantification of the FACS data shown on the right: mean ± SEM: n = 4 per group. CD8+ T-cell depletion was > 99% complete.
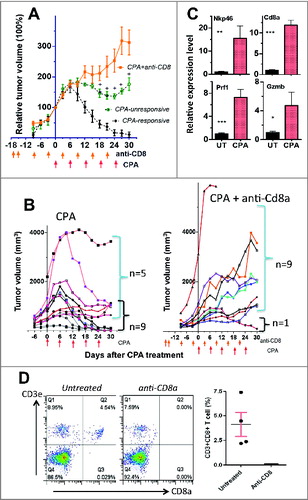
The dependence of tumor regression on CTLs was much more apparent in the CPA–90-treated mice than in the CPA–140-treated mice. Thus, CD8+ T-cell immunodepletion resulted in 9 of 10 tumors escaping CPA–90-induced regression, as compared to 5 out of 14 escaping tumors with CPA-90 treatment alone (; p = 0.013, Fisher's exact test). In contrast, 0 out of 10 tumors escaped CPA–140-induced regression upon depletion of CD8+ T cells, either alone or in combination with NK-cell depletion (). Immunodepletion of CD8+ T cells, verified by FACS analysis of peripheral blood (), had, at most, a small stimulatory effect on tumor growth in the absence of CPA treatment in some, but not all, experiments (data not shown). Although this could contribute to the slower regression seen upon immune cell depletion with CPA-140 treatment (), it is far too small an effect to account for the dramatic escape from regression seen in the CPA–90-treated tumors (). Thus, at the CPA-90 dose, where direct 4-hydroxy-CPA tumor cell cytotoxicity is expected to be less extensive than at CPA-140, we observed major GL261 glioma regression that is highly dependent on CD8+ T cells. In the tumors unresponsive to CPA-90 treatment, Cd8a and Gzmb marker levels were not elevated compared to CPA-free control tumors (Fig. S6), confirming that CD8+ T cells are a critical component of CPA-induced tumor regression.
Metronomic CPA Activates Tumor-specific Immune Memory
Next, we investigated whether metronomic CPA treatment induces long-term antitumor immunity in the glioma-bearing B6 mice. GL261 glioma-bearing mice were treated with metronomic CPA-140 for 10–11 cycles, resulting in tumor ablation (, Fig. S7). Mouse body weights were relatively stable (Fig. S8), indicating that host toxicity was manageable. The mice were maintained drug-free for ∼4 weeks and then re-challenged with fresh GL261 tumor cells injected at a contralateral site (). Whereas 25 of 25 GL261 tumors implanted in tumor-naive mice grew by Day 23 after inoculation, only 6 of 18 tumors re-implanted in the CPA–140-cured mice grew after 60 days (, ). This high rate of tumor rejection (67% vs. 0% rejection by naive mice, ) indicates that the cured mice acquired antitumor immune memory to GL261 tumors. The subset of CPA–90-treated mice that were cured of the GL261 tumors also showed significant rejection of re-implanted GL261 tumor cells (tumor rejection in 5 of 6 mice; 83%, vs. 0% rejection by naive mice, ), indicating that CPA-90 treatment is sufficient for the induction of long-term immune memory.
Table 1. Comparison of GL261 tumor take rates between primary tumor implantation, as in , and GL261 re-challenge by implantation of 4 × 10⁶ tumor cells in a contralateral site in CPA-cured mice ∼4 weeks after the primary tumors were ablated. The primary GL261 tumor rejection rate, determined 25 days after implantation, was compared with that of re-challenged GL261 tumor cells 60 days after re-challenge. Fisher's exact test (2-tailed) was used to evaluate the significance of the differences in tumor rejection rates between primary and re-challenge tumor implantations
Figure 4. Metronomic CPA induces long-term tumor-specific immunity. (A) Growth curves for individual GL261 tumors implanted on one posterior flank in tumor-naïve B6 mice (primary tumors). CPA-140 treatment days are marked by arrows. After Day ∼60, volume measurements shown reflect flat scar tissue that remained at the tumor site; no primary tumor regrowth was seen after discontinuation of CPA treatment. (B) Growth curves for re-challenged GL261 tumors implanted on the contralateral side of the primary implantation site in mice cured by CPA-140 treatment, as in (A). Mice were rested for 33 days between last CPA injection and re-challenging. Six re-challenged tumors grew by 60 days after re-challenge and 12 tumors were rejected. Five of the rejected tumors were excised on Day 22 for FACS analysis, as shown in E and F. (C, D) Individual growth curves for cross-challenged B16-F10 melanoma (C) and LLC Lewis lung carcinoma (D) tumor cells implanted bilaterally in CPA–140-cured mice ∼4 weeks after GL261 tumors were cured by CPA-140 treatment. All 20 cross-challenge sites showed aggressive tumor growth within 13 days of implantation. CPA-140 treatment initiated (arrows along x-axis) did not impact tumor growth. (E) FACS analysis of CTLs in growing GL261 tumors from primary inoculation in fresh mice compared to GL261 tumors re-implanted (re-challenged tumors) that either were rejected or that grew in the CPA–140-cured mice. The re-challenged tumors were sampled 22 days after implantation. Data shown are mean ± SEM: n = 12 growing tumors from primary inoculation, n = 5 rejected re-implanted tumors, and n = 5 growing re-implanted tumors. One-way Anova analysis: *, p < 0.05. (F) FACS analysis of immune cells in peripheral blood of CPA–140-cured mice that rejected or grew re-implanted GL261 tumors. Blood (cheek pouch sampling) samples were taken 22 days after tumor re-challenge. Data shown are mean ± SEM values for n = 3 mice with growing re-implanted GL261 tumors and n = 5 mice with rejected re-implanted GL261 tumors. Two-tailed t-test: *, p < 0.05.
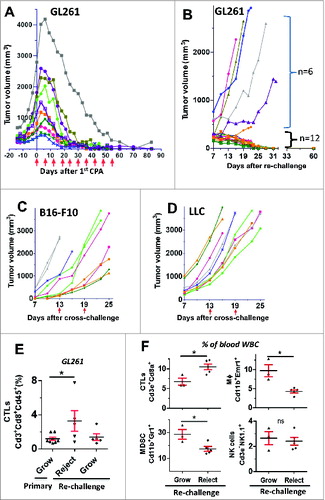
To further examine the specificity of the antitumor memory, metronomic CPA-cured GL261-bearing B6 mice were implanted with 2 other B6 mouse syngeneic tumor cell lines, B16-F10 and LLC, in a cross-challenge assay (n = 10 tumors per line). All 20 cross-challenged sites grew tumors by Day 13 (), that is, there was no tumor rejection. Further, metronomic CPA treatment had no substantial effect on B16-F10 or LLC tumor growth (). Thus, the antitumor memory induced by metronomic CPA is specific to GL261 tumors.
Molecular Characteristics of CPA-induced Antitumor Immune Memory
To obtain mechanistic insight into whether T cells may contribute to GL261 tumor rejection, we analyzed immune cell levels in mice that rejected the re-implanted GL261 tumors compared to mice with GL261 tumors that grew. FACS analysis revealed a significant increase in CTLs in both the tumor fraction and in the peripheral blood of the metronomic CPA-cured mice that rejected the GL261 tumor re-challenge as compared to mice with growing tumors (). Further, mice rejecting the GL261 tumors showed lower levels of circulating Cd11b+Emr1+ macrophages and Cd11b+Gr1+ myeloid-derived suppressive cells (MDSCs), but no differences in NK cells (, Fig. S10), suggesting that circulating CTLs, and perhaps also macrophages and MDSCs, serve as diagnostic markers for monitoring immune surveillance or tumor regrowth status following metronomic CPA treatment. These findings are consistent with the significant increase in Cd8a expression seen in the rejected tumors compared to growing GL261 tumors (Fig. S9). Moreover, in a preliminary study, we found that partial (59%) depletion of CD8+ T cells from the metronomic CPA-cured mice (Fig. S11A) increased the tumor take rate substantially, from 0% (0 out of 6 memory mice without anit-Cd8a treatment) to 33% (2 out of 6 memory mice treated with anti-Cd8a), when the mice were re-challenged with GL261 tumors (Fig. S11B).
Discussion
Metronomic scheduling, which involves frequent, often daily, anticancer drug administration at low doses, offers several advantages over conventional MTD chemotherapy, including its ability to activate antitumor immune responses.Citation24,26,40 However, it is not clear what doses and schedules are most effective at eliciting a potent, adaptive antitumor immune response, or whether the immune responses obtained evoke long-term immune memory.Citation18,41-43 Further, although several cancer chemotherapeutic agents, including drugs shown to be effective using metronomic scheduling, such as CPA, have well-known immune-modulatory activity,Citation18,24 including the potential to activate immunogenic cell death,Citation21 it has not been established whether single-agent chemotherapy can activate an immune response that is sufficiently potent to induce tumor ablation linked to the acquisition of long-term, tumor-specific immunity. Indeed, some studies report that the cytotoxicity of CPA is deleterious to the maintenance of long-term antitumor immune memory.Citation44 Previously, we found that metronomic scheduling of CPA can activate robust innate antitumor immunity and induce NK–cell-dependent regression of large gliomas implanted in scid adaptive immunity-deficient mice when given on a 6–day-repeating schedule.Citation26,29,30 More frequent metronomic schedules (daily or every 3 day drug treatment) delivering the same total drug dose were much less effective, apparently due to the frequent ablation of tumor-recruited NK cells,Citation29 while less frequent metronomic scheduling (drug treatment every 9 or 12 days) was initially effective at immune stimulation, but ultimately led to tumor escape after several treatment cycles.Citation30 Here we show that a strong, sustained CD8+ T–cell-dependent adaptive immune response can be activated by the same 6-day-repeating metronomic CPA schedule in an immune-competent syngeneic B6 mouse model, resulting in complete tumor ablation associated with acquisition of long-term, tumor-specific antitumor immune memory characterized by rejection of syngeneic glioma re-challenge.
Our investigation of the time course of metronomic CPA-induced changes in immune marker levels in GL261-bearing B6 mice showed that a single injection of CPA at 140 mg/kg induced only modest immune responses, whereas a second CPA injection resulted in strong upregulation of immune cell markers for CTLs and several innate immune cells 6 days later, including NK cells, DCs, and macrophages. These findings highlight the importance of repeated CPA-induced tumor cell damage, and are consistent with our earlier findings in the scid mouse model.Citation26,29,30,45 We also observed a significant downregulation of Treg cell (Foxp3) and CTL (Cd8a) marker genes 3 days after the first CPA injection, followed by a rebound by Day 6. Moreover, Cd8a expression was significantly reduced 1 day after the second CPA treatment. This ability of CPA to deplete CTLs, as well as Tregs, is consistent with earlier reports that CPA at a dose of 50 mg/kg given every 4 days is toxic to CTLs in the draining lymph nodes.Citation46 and that daily CPA treatment at 10 or 20 mg/kg is associated with decreases in tumor-specific T cells.Citation47 Together, these findings support the hypothesis that a drug-free interval longer than 3 days is required to avoid frequent ablation of CTL responses.
When CPA treatment was halted after two 6-day CPA cycles, Foxp3-marked Treg cells were significantly increased in the tumor compartment 9 days later, and this increase correlated with the decreased expression of the CTL- and NK-cell cytotoxic mediator Prf1. Another CTL and NK-cell effector marker, Gzmb, showed a similar pattern. The increase in Foxp3 and the associated decreases in Prf1 and Gzmb seen 9–15 days after CPA treatment are characteristic of Treg-mediated immune suppression,Citation34,35 and may explain why CPA given on a 14-day repeating schedule inhibits the tumor regression and long-term immune response that the TLR7/TLR8 agonist resiquimod (R488) activates in a syngeneic rat CNS-1 glioma model.Citation44 These findings highlight the critical importance of metronomic interval on the success of chemo-immunomodulation and the need to avoid immune suppression by Treg cells activated by CPA or other cytotoxic drugs.Citation25,47
Immunodepletion studies indicated that CD8+ T cells make a greater contribution than NK cells to metronomic CPA-induced tumor regression, and suggested that the tumor regression activity associated with NK cells in this model is dependent on CD8+ T cells (see model in ). This is reminiscent of the priming role of NK cells in adaptive T-cell responses described in the context of infectious disease.Citation48 We found that NK-cell depletion, but not CD8+ T-cell depletion, decreased tumor-associated Prf1 and Gzmb, suggesting these cytotoxic effectors are primarily expressed by NK cells in our model. Alternatively, this finding could result from competitive interactions between NK cells and T cells that can lead to compensatory increases in Prf1 and Gzmb production by NK cells when CD8+ T cells are absent.Citation49,50 Indeed, the immune-stimulatory cytokines IL-15 and IL-18, which we found to be induced 6 days after the second CPA treatment, can increase competition between NK cells and T cells for cytokines.Citation51 We also found that Tnfa and Ifng expression increased when the CPA-treated tumors were depleted of both CD8+ T cells and NK cells as compared to CD8+ T-cell depletion alone. Conceivably, in the absence of CD8+ T cells, the CPA-induced NK cells may suppress Tnfa- and Ifng-expressing cells, such as macrophages,Citation52,53 thereby making the tumor microenvironment more favorable for tumor growth and offsetting the beneficial antitumor effects of Prf1 and Gzmb production. However, we cannot rule out the possibility that the CPA-treated tumor cells contribute to some of the observed changes in immune factor gene expression, in particular Fasl, Tnfa, and Ifng. Other immune cells, such as CD4+ T cells, may also contribute to CPA-mediated tumor regression.Citation54
Long-term specific antitumor immunity and immune memory developed in a majority of the GL261-bearing mice treated on the 6–day-repeating metronomic CPA schedule, as evidenced by the absence of tumor growth upon re-challenge with fresh GL261 tumor cells. This immunity did not extend to B16-F10 or LLC tumor cells, as seen in a cross-challenge experiment. The absence of detectable tumor regrowth after discontinuation of CPA treatment for as long as 33 days (data not shown) supports this conclusion. An increase in circulating CD8+ T cells was seen in mice that rejected the GL261 tumor re-challenge, consistent with the expansion of tumor-reactive CTLs that contribute to the rejection, whereas circulating macrophage and MDSC populations were decreased. Accordingly, changes in blood levels of CTLs, macrophages, and MDSCs may serve as useful diagnostic markers for predicting systematic antitumor responses.
Strong increases in intratumoral levels of Nkp46, Cd8a, Prf1, Gzmb, and several other immune-stimulatory genes, including the M1 (antitumor) macrophage marker iNOS, were seen in mice given CPA at doses of either 90 mg/kg (CPA-90) or 140 mg/kg (CPA-140) every 6 days. By contrast, protumor M2 macrophages and immunosuppressive factor marker genes showed only modest increases or were downregulated (VEGFA) at both CPA doses (Fig. S5). The strong Prf1 and Gzmb responses suggest that immunosuppressive factors, such as MDSCs, which inhibit NK-cell and T-cell proliferation and activation,Citation55,56 are not significantly increased at either CPA dose, although it remains possible that immunosuppressive factors not examined here could be produced by surviving tumor cells and therefore be more abundant at the lower CPA dose. Nevertheless, complete regression was achieved in a substantial subset of the mice treated at the lower CPA dose. Further, our finding that the complete regression response was extended to include all of the mice treated at the higher CPA dose suggests that CPA dose-dependent tumor cell cytotoxicity is an essential factor that works in cooperation with CPA activation of immune-based regression to drive tumor regression in our models.
Our findings suggest that, at high CPA doses (e.g., CPA-140), the cytotoxic action of CPA dominates the overall therapeutic response. Supporting this view, immunodepletion of CD8+ T cells enabled 9 out of 10 of the CPA–90-treated tumors to escape, evidencing a major role of T–cell-mediated tumor cell cytotoxicity in tumor regression, whereas at the CPA-140 dose CD8+ T-cell depletion had a much more modest impact on tumor regression. Individual CPA–90-treated tumors that did not regress were apparently deficient in CD8+ T cells, suggesting these tumors can mount mechanisms that suppress the antitumor immune response in the late stage of therapy. Alternatively, CPA-90 treatment may fail to elicit a sufficiently strong antitumor immune response in the unresponsive tumors, which ultimately leads to tumor escape. Nevertheless, those mice that were cured by CPA-90 treatment developed long-term immunity against GL261 tumor cell re-challenge at a frequency at least as high as CPA–140-cured mice (). These findings are consistent with the report that both 83 and 150 mg/kg CPA treatment can induce splenic production of type I interferon, which favors memory T-cell proliferation.Citation23
Based on our findings, we propose that metronomic CPA-treated GL261 tumors release GL261 tumor-unique antigens that are presented, interact with, and activate specific T-cell receptor-harboring T-cell clones, which are subsequently transformed to long-lived memory T cells. Several of the cytokines and chemokines induced by metronomic CPA treatmentCitation23,26,30,57 can recruit and activate T cells, and these may be a prerequisite for CTL infiltration and a sustained antitumor immune response.Citation58 CPA induction of IL-15 (Fig. S4, S5) may stimulate homeostatic proliferation of memory T cells.Citation59 Supporting this proposal, partial depletion of CD8+ T cells from the metronomic CPA-cured mice increased the tumor-take rate substantially when the mice were re-challenged with GL261 tumors (Fig. S11).
Cyclophosphamide and other cytotoxic drugs have well-established immunomodulatory functionsCitation18,24,60-62; however, to our knowledge, this study is the first report showing that systematic treatment with CPA – or any other cytotoxic monotherapy – can induce complete regression of large established tumors and confer long-lived immune memory. We hypothesize that, to achieve this remarkable response, both the dose and the schedule of chemotherapy must be optimized with respect to each of the following: (1) destruction of a large fraction of the tumor cells without inducing drug resistance; (2) elimination of Tregs and other immunosuppressive factors to allow antitumor immune response to develop; (3) induction of immunogenic cell death leading to a strong antitumor response in a manner that precludes tumor relapse and metastasis; and (4) effective transition from primary T-cell response to long-lived memory T-cell production. Tumor cells can be killed indirectly by taking advantage of the intrinsic anti-angiogenic activity of daily, low-dose metronomic chemotherapyCitation63; however, this approach does not kill a large fraction of tumor cells unless combined with immunotherapeutic or anti-angiogenetic agents.Citation47,64,65 Further, frequent dosing of CPA, which is required to maximize anti-angiogenesis, limits the effectiveness of immunotherapy at inducing tumor-specific T cells, although it may be efficacious at blocking Treg -mediated immune suppression.Citation46,47 CPA at a dose of 50 mg/kg given every 7 days is not sufficient to suppress tumor growthCitation47 and, in the present study, metronomic CPA given at 90 mg/kg every 6 days did not cure all of the GL261 tumor-bearing mice. These findings indicate the importance of the intrinsic tumor cell cytotoxicity of the cancer chemotherapeutic agent.
The effective daily dose of CPA in our 6-day metronomic regimen is similar to that used in MTD CPA schedules in mouse models,Citation26,66 except that the length of the drug-free break is much shorter. Whereas MTD schedules necessitate a prolonged drug-free break during which neovascularization and chemotherapy resistance often occur, the 6–day-repeating CPA schedule employed in our studies provides a good balance between maximizing tumor cell toxicity while minimizing the frequency of immune cell ablation. Thus, the 6-day metronomic schedule induces major GL261 glioma regression without major rebound of immune-suppressive Tregs or loss of antitumor CD8+ T-cell responses. Further, the transient lymphopenic effects of the 6–day-repeating CPA schedule may help reduce the tumor-tolerance of CD8+ T cells and thereby increase homeostatic proliferation of tumor-reactive CD8+ T cells.Citation67 The relationship of CPA dose and dosing interval might also have important implications for chemotherapy combined with other therapeutic modalities, such as oncolytic viral therapy. Specifically, a short immune-suppressive window may reduce the host antiviral immune response and, thereby, facilitate tumor cell exposure to a replicating oncolytic virus, leading to a rebound in antitumor immunity upon the release of a danger signal following oncolytic virus-mediated tumor cell lysis.Citation68 In contrast to our findings, the 6-day metronomic CPA schedule used by Browder et al., apparently did not lead to long-lived immunity,Citation66 perhaps because the tumor models employed did not respond to CPA by immunogenic cell death, whose activation can vary between tumor models.Citation18,60,69 Alternatively, the CPA dose used by Browder et al. (170 mg/kg) may be too high for CTLs to recover sufficiently between treatments. Although supportive care measures were required to maintain the health of CPA-treated mice in that study,Citation66 the GL261-bearing B6 mice treated with CPA at 140 mg/kg in the present study were largely free of drug toxicity, as indicated by body weight measurements (Fig. S8), and did not require any special supportive care.
Intermittent metronomic CPA scheduling, shown here to be strikingly effective for the treatment of glioma in B6 mice, may have translational potential in the clinical development of more effective drug schedules for the treatment of human glioma. The current clinical standard-of-care chemotherapy regimen for glioma is based on temozolomide, which has a median survival of 14 months and a 5-year survival rate < 3% for glioblastoma multiforme patients.Citation1,70,71 Although early clinical trials showed that CPA was not effective for treatment of human brain tumors,Citation72-74 those studies employed MTD schedules, and not the intermittent, 6-day scheduling that our mouse model studies show is far superior to MTD CPA treatment with regard to immune cell recruitment and glioma regression.Citation26,29 Further, while a metronomic regimen of low-dose temozolomide (0.5 mg/kg per day) depletes Treg cells in RG2 gliomas grown in Fischer 344 rats, the dosage used was too low to suppress glioma cell growth.Citation75 Conceivably, a high-dose, intermittent metronomic schedule of temozolomide, or of CPA, may show better efficacy in the treatment of human glioma. While immune escape mechanisms remain a barrier to the application of immunotherapy,Citation4,8,76 the present findings suggest that CPA, and perhaps other immunogenic chemotherapeutic drugs, may have much translational promise when optimized drug doses and schedules are developed using reliable clinical markers for immunogenic cell death and downstream immune responses.
Materials and Methods
Tumor Cell lines, Mouse Tumors, and Treatments
Mouse GL261 glioma cells were authenticated by and obtained from the Developmental Therapeutics Program Tumor Repository (National Cancer Institute, Frederick, MD). Mouse B16-F10 melanoma (ATCC® CRL-6475™) and LLC Lewis lung carcinoma (ATCC® CRL-1642™) cell lines were purchased from the American Type Culture Collection (Manassas, VA). All three cell lines were grown at 37°C in a humidified 5% CO2 atmosphere in RPMI-1640 culture medium containing 10% fetal bovine serum, 100 units/mL penicillin, and 100 μg/mL streptomycin. Six-week-old (20–23 g) male C57BL/6 (B6) mice (Taconic Farms, Germantown, NY) were housed and treated under protocols approved by the Boston University Institutional Animal Care and Use Committee. GL261 glioma cells (4 × 10⁶), B16-F10 melanoma cells (1 × 10⁶), or LLC Lewis lung carcinoma cells (2 × 10⁶) were implanted by subcutaneous injection into the posterior flanks in 0.2-mL serum-free RPMI per site using a U-100 insulin syringe and 28.5 gauge needle (BD Biosciences, Cat.# 329461). Tumor areas (length × width) were measured twice weekly using Vernier calipers (VWR International, Cat.# 62379-531) and tumor volumes were calculated as Vol = (π/6)*(L*W)3/2. Tumors were monitored and drug treatment was initiated at the mean tumor volumes specified in each study. Tumor volumes were normalized to a value of 100% at the drug-treatment starting point (t = 0 days) for each treatment group to normalize the size differences between individual tumors at the time of first treatment, which in some cases, can be substantial (e.g.,, , Fig. S7). This approach controls for differences in initial tumor size at the onset of drug treatment and enabled us to reach statistical significance with fewer mice, in accordance with Institutional Animal Care and Use Committee guidelines. We have established that the raw tumor volume trends are very similar to those of the normalized tumor volume data, confirming that normalized tumor volume is an appropriate way to present the data. Mouse body weights were measured at least twice a week and normalized in the same manner. Mice whose implanted GL261 gliomas were cured by metronomic CPA treatment (“cured mice”) were rested for ∼4 weeks and then re-injected with GL261 cells (“re-challenge”), B16-F10 cells, or LLC cells (“cross-challenge”), as indicated, to evaluate the acquisition of immune memory. Re-challenged GL261 tumors that initially grew and then regressed (in the absence of any drug treatment) (“rejected tumors”) were sampled for FACS and immune cell marker analysis, as described further.
Mice were treated with CPA monohydrate (Cat. # C0768, Sigma-Aldrich, St. Louis, MO) every 6 days at a dose of 140 mg/kg-body weight per injection (CPA-140) or 90 mg/kg-body weight per injection (CPA-90), as specified. The CPA doses reported are based on the anhydrous molecular weight of 261. The NK–cell-depleting antibody anti-asialoGM1 (‘anti-GM1’) (Cat.# 986-10001, Wako Chemicals USA, VA) was administered as described.Citation26 Briefly, anti-GM1 (50 μL) was given once every 6 days beginning 3 days prior to the first CPA injection by intraperitoneal injection after dilution with 2 volumes of sterile phosphate-buffered saline (PBS) on the day of injection (final volume,150 μL/mouse). CD8+ T cells were depleted using monoclonal antibody anti-CD8a (clone 53-6.72, Cat.# B30004-1, Bio-XCell, West Lebanon, NH) by intraperitoneal injection at 0.28 mg antibody/mouse. Anti-CD8a was injected once every 6 days, except in the following conditions: (1) when combined with CPA-140 treatment, the first 3 anti-CD8a injections were given on days −3, −1, and +3 relative to the first CPA treatment on Day 0, and every 6 days thereafter and (2) when combined with CPA-90 treatment, the first 2 anti-CD8a injections were given on Day −17 and on Day −15 relative to CPA-90 treatment beginning on Day 0, and every 6 days thereafter, as marked in each figure using vertical arrows. Anti-CD8a (6.88 mg/mL) was diluted with 3 volumes of PBS and then injected at 162.8 μL/injection per mouse. Fisher's exact test was used to assess the significance of differences in the tumor-take rate between groups (tumor rejection vs. tumor growth), and the Student's t-test was used to establish the significance of differences in tumor growth rate for CPA treatment in combination with different antibodies. Significance is indicated by *, p < 0.05; **, p < 0.01; and ***, p < 0.001.
Quantitative Polymerase Chain Reaction Analysis of Marker Genes
Changes in tumor-infiltrating immune cells were monitored by changes in the expression of immune cell marker genes, as determined by quantitative polymerase chain reaction (qPCR) analysis of total tumor RNA. Changes in the marker genes reported here are indicative of changes in the corresponding marker protein levels and immune cell numbers, as established previously by immunohistochemical and/or FACS analysis of metronomic CPA-treated GL261, 9L, and U251 gliomas implanted in the scid or B6 mouse models,Citation26,29,45 and further confirmed here in select cases by FACS analysis. NK–cell-marker gene expression levels showed a close association with the extent of tumor regression induced by metronomic CPA treatment.Citation29 However, we cannot exclude the possibility that the expression of some of the other genes examined might come from mixed cell types. Isolation of total tumor RNA, reverse transcription, and qPCR were carried out as described.Citation26 Primers designed using Primer Express software (Applied Biosystems, Carlsbad, CA, USA) are describedCitation26,29 or are presented in Supplemental Table S1. qPCR data were analyzed using the comparative CT method and are presented as relative levels of each RNA compared to the RNA level in untreated tumors after normalization to the 18S RNA content of each sample. qPCR data are expressed as mean values ± SE for n = 6 tumors per time point for each treatment group, unless indicated otherwise. Statistically significant differences between mean values of different treatment groups were determined by one-way ANOVA (for 3 of more comparisons) or 2-tailed Student's t-test (for 2 group comparisons). Significance is indicated in each figure by: *, p < 0.05; **, p < 0.01; and ***, p < 0.001.
FACS Sample Preparation and Data Analysis
A FACSCalibur™ instrument (Cat.# 342975; BD Biosciences) was used for FACS analysis of tumor-infiltrating immune cells in the following 5-step protocol. Step 1, preparation of single-cell suspension using a gentleMACS Dissociator (Miltenyi Biotec, Auburn, CA): 1 mL of complete medium (RPMI-1640 culture medium containing 10% fetal bovine serum, 100 U/mL penicillin and 100 μg/mL streptomycin) was added to a C-tube (Cat.# 130-093-237, Miltenyi Biotec) on ice. A piece of freshly excised tumor tissue (approximately half to one pea size) was placed in the C-tube and cut into pieces < 0.5 mm in size using scissors. Collagenase I (Cat.# 4196, Worthington; 400 unit (40 μl), using stock adjusted to 10 unit/μL using PBS, with frozen aliquots stored at −80°C) and DNase I (Cat.# 260913, Calbiochem; 5 × 10⁴ Dornase Unit [10 μL], using stock adjusted to 5 × 10³ Dornase U/μL using sterile distilled water, with frozen aliquots kept at −80°C) were added followed by gentle shaking in a 37°C water bath for 30 min. Complete medium (4 mL) was then added to bring the volume up to 5 mL. The C-tube was mounted on a gentleMACS Dissociator and processed once using program 4.1 (Mouse-Implanted-Tumor program). The C-tube was briefly spun and the cells were passed through a 70-μm filter (Cat.# 22363548, Fisher Scientific) into a 50-mL conical tube pre-rinsed with 1 mL complete medium, followed by a wash of the C-tube and filter with an additional 10 mL complete medium. In Step 2, for red blood cell lysis: The filtered cells were spun down at 400g for 5 min, re-suspended in ∼1 mL of RBC lysis buffer (Cat.# 00-4333-57, eBioscience, San Diego), and gently mixed for 10 min at 20–22°C. Then, PBS (2 mL) was added and the cells were pelleted at 400g, washed once using 15 mL protein extraction buffer (PEB comprising PBS, pH 7.2, 0.5% BSA, 2 mmol/L EDTA) and re-suspended in 0.5–1 mL PEB to give a final concentration of 106 to 109 cells/mL. This was followed by Step 3, involving antibody staining: 100 μL cells were stained with 2 μL anti-CD16/32 in a 5-mL test tube at 4°C for 20 min, to block non-specific mouse immunoglobulin G (IgG) Fc binding to Fc–receptor-expressing cells. A fluorescence-conjugated antibody was then added in amounts specified below, followed by 10 min incubation at 4°C. The cells were washed once with 3 mL PEB and re-suspended in 200 μL PEB. In Step 4 for FACS analysis, propidium iodide was added to the cells (20 ng/mL, final concentration) immediately before events were collected using BD CellQuest Pro software (BD Biosciences). Antibody sources and amounts used per FACS reaction are as follows: anti-Cd16/32 (Cat.# 14-0161-85, clone 93, 2 μL), anti-mouse NK1.1-PE (Cat.#12-5941, clone PK136, 1 μL), anti-mouse CD11b-PE (Cat.# 12-0112, clone M1/70, 0.2 μL), rat IgG2a k-isotype-PE (clone eBR2a, Cat.#12-4321-80, 1 μL), and mouse IgG 2a k isotype-PE (clone eBM2a, Cat.#12-4724-81, 1 μL) were all purchased from eBioscience, Inc.. (San Diego, CA); rat IgG2a k-isotype (Cat.# 553929, 1 μL) from BD Biosciences; anti-mouse NK1.1-APC (Cat.# 130-102-350, clone PK136, 5 μL) from Miltenyi Biotech (San Diego, CA); anti-mouse Cd8a-APC (Cat.# 20-1886, Rat IgG 2b, clone 2.43, 0.7 μL), anti-mouse Cd8a-PE-Cy7 (Cat.# 60-1886, Rat IgG 2b, clone 2.43, 0.7 μL), anti-mouse Cd3e-FITC (Cat.# 35-0031, Armenian Hamster IgG, clone 145-2c11, 1 μL), anti-Gr-1-FITC (Cat.# 35-5931, clone RB6-8C5, 1 μL), anti-mouse Emr1-APC (Cat.# 20-4801, clone BM8.1, 2.5 μL), and anti-mouse Cd45-PE (Cat.# 50-0451, clone 30-F11, 0.2 μL) all from Tonbo Biosciences (San Diego, CA).
For FACS analysis of blood, ∼0.5 mL whole blood was sampled via the cheek pouch prior to euthanasia. Alternatively, ∼20 μL whole blood was collected from the tail vein for analysis. Blood was stored in a 1.5-mL Eppendorf tube with Heparin sodium (1,000 U/mL in 0.9% NaCl, Cat. # 3149, Sigma-Aldrich, St. Louis, MO). For each FACS reaction, 1 mL of RBC lysis buffer was added to ∼20 μL fresh whole blood with gentle shaking for 20 min at 20–22°C. PBS (2 mL) was added to terminate the lysis reaction followed by one spin and wash using 3 mL PEB. The cells were re-suspended in 200 μL PEB and then stained with antibody, as described earlier for the tumor-infiltrated immune cell FACS analysis protocol. FlowJo data analysis software (Ashland, OR) was used to analyze the data. Propidium iodide-positive cells were routinely excluded.
Disclosure of Potential Conflicts of Interest
No potential conflicts of interest were disclosed.
Supplemental Material
Supplemental data for this article can be accessed on the publisher's website.
Supplementary_files.zip
Download Zip (834.6 KB)Funding
This work was supported in part by the National Institutes of Health (grant no. CA49248 to DJW).
Related Research Data
References
- Chen J, Li Y, Yu TS, McKay RM, Burns DK, Kernie SG, Parada LF. A restricted cell population propagates glioblastoma growth after chemotherapy. Nature 2012; 488:522-6; PMID:22854781; http://dx.doi.org/10.1038/nature11287
- Marusyk A, Tabassum DP, Altrock PM, Almendro V, Michor F, Polyak K. Non-cell-autonomous driving of tumour growth supports sub-clonal heterogeneity. Nature 2014; 514:54-8; PMID:25079331; http://dx.doi.org/10.1038/nature13556
- Burrell RA, McGranahan N, Bartek J, Swanton C. The causes and consequences of genetic heterogeneity in cancer evolution. Nature 2013; 501:338-45; PMID:24048066; http://dx.doi.org/10.1038/nature12625
- Barkholt L, Bregni M. Current immunotherapy for solid tumors. Immunotherapy 2009; 1:483-93; PMID:20635964; http://dx.doi.org/10.2217/imt.09.13
- Beatty PL, Cascio S, Lutz E. Tumor immunology: basic and clinical advances. Cancer Res 2011; 71:4338-43; PMID:21712409; http://dx.doi.org/10.1158/0008-5472.CAN-11-0717
- Gajewski TF, Fuertes M, Spaapen R, Zheng Y, Kline J. Molecular profiling to identify relevant immune resistance mechanisms in the tumor microenvironment. Curr Opin Immunol 2011; 23:286-92; PMID:21185705; http://dx.doi.org/10.1016/j.coi.2010.11.013
- Kandalaft LE, Singh N, Liao JB, Facciabene A, Berek JS, Powell DJ, Jr., Coukos G. The emergence of immunomodulation: combinatorial immunochemotherapy opportunities for the next decade. Gynecol Oncol 2010; 116:222-33; PMID:19959212; http://dx.doi.org/10.1016/j.ygyno.2009.11.001
- Sadun RE, Sachsman SM, Chen X, Christenson KW, Morris WZ, Hu P, Epstein AL. Immune signatures of murine and human cancers reveal unique mechanisms of tumor escape and new targets for cancer immunotherapy. Clin Cancer Res 2007; 13:4016-25; PMID:17606736; http://dx.doi.org/10.1158/1078-0432.CCR-07-0016
- Ferris RL, Jaffee EM, Ferrone S. Tumor antigen-targeted, monoclonal antibody-based immunotherapy: clinical response, cellular immunity, and immunoescape. J Clin Oncol 2010; 28:4390-9; PMID:20697078; http://dx.doi.org/10.1200/JCO.2009.27.6360
- Di Giacomo AM, Biagioli M, Maio M. The emerging toxicity profiles of anti-CTLA-4 antibodies across clinical indications. Semin Oncol 2010; 37:499-507; PMID:21074065; http://dx.doi.org/10.1053/j.seminoncol.2010.09.007
- Rommelfanger DM, Compte M, Diaz RM, Ilett E, Alvarez-Vallina L, Thompson JM, Kottke TJ, Melcher A, Vile RG. The efficacy versus toxicity profile of combination virotherapy and TLR immunotherapy highlights the danger of administering TLR agonists to oncolytic virus-treated mice. Mol Ther 2013; 21:348-57; PMID:23011032; http://dx.doi.org/10.1038/mt.2012.204
- Lipson EJ, Drake CG. Ipilimumab: an anti-CTLA-4 antibody for metastatic melanoma. Clin Cancer Res 2011; 17:6958-62; PMID:21900389; http://dx.doi.org/10.1158/1078-0432.CCR-11-1595
- Vacchelli E, Aranda F, Eggermont A, Galon J, Sautes-Fridman C, Cremer I, Zitvogel L, Kroemer G, Galluzzi L. Trial watch: chemotherapy with immunogenic cell death inducers. Oncoimmunology 2014; 3:e27878; PMID:24800173; http://dx.doi.org/10.4161/onci.27878
- Tesniere A, Schlemmer F, Boige V, Kepp O, Martins I, Ghiringhelli F, Aymeric L, Michaud M, Apetoh L, Barault L, et al. Immunogenic death of colon cancer cells treated with oxaliplatin. Oncogene 2010; 29:482-91; PMID:19881547; http://dx.doi.org/10.1038/onc.2009.356
- Martins I, Kepp O, Schlemmer F, Adjemian S, Tailler M, Shen S, Michaud M, Menger L, Gdoura A, Tajeddine N, et al. Restoration of the immunogenicity of cisplatin-induced cancer cell death by endoplasmic reticulum stress. Oncogene 2011; 30:1147-58; PMID:21151176; http://dx.doi.org/10.1038/onc.2010.500
- Casares N, Pequignot MO, Tesniere A, Ghiringhelli F, Roux S, Chaput N, Schmitt E, Hamai A, Hervas-Stubbs S, Obeid M, et al. Caspase-dependent immunogenicity of doxorubicin-induced tumor cell death. J Exp Med 2005; 202:1691-701; PMID:16365148; http://dx.doi.org/10.1084/jem.20050915
- Obeid M, Tesniere A, Ghiringhelli F, Fimia GM, Apetoh L, Perfettini JL, Castedo M, Mignot G, Panaretakis T, Casares N, et al. Calreticulin exposure dictates the immunogenicity of cancer cell death. Nat Med 2007; 13:54-61; PMID:17187072; http://dx.doi.org/10.1038/nm1523
- Chen G, Emens LA. Chemoimmunotherapy: reengineering tumor immunity. Cancer Immunol Immunother 2013; 62:203-16; PMID:23389507; http://dx.doi.org/10.1007/s00262-012-1388-0
- Zitvogel L, Apetoh L, Ghiringhelli F, Andre F, Tesniere A, Kroemer G. The anticancer immune response: indispensable for therapeutic success? J Clin Invest 2008; 118:1991-2001; PMID:18523649; http://dx.doi.org/10.1172/JCI35180
- Emadi A, Jones RJ, Brodsky RA. Cyclophosphamide and cancer: golden anniversary. Nat Rev Clin Oncol 2009; 6:638-47; PMID:19786984; http://dx.doi.org/10.1038/nrclinonc.2009.146
- Schiavoni G, Sistigu A, Valentini M, Mattei F, Sestili P, Spadaro F, Sanchez M, Lorenzi S, D'Urso MT, Belardelli F, et al. Cyclophosphamide synergizes with type I interferons through systemic dendritic cell reactivation and induction of immunogenic tumor apoptosis. Cancer Res 2011; 71:768-78; PMID:21156650; http://dx.doi.org/10.1158/0008-5472.CAN-10-2788
- Bracci L, Moschella F, Sestili P, La Sorsa V, Valentini M, Canini I, Baccarini S, Maccari S, Ramoni C, Belardelli F, et al. Cyclophosphamide enhances the antitumor efficacy of adoptively transferred immune cells through the induction of cytokine expression, B-cell and T-cell homeostatic proliferation, and specific tumor infiltration. Clin Cancer Res 2007; 13:644-53; PMID:17255288; http://dx.doi.org/10.1158/1078-0432.CCR-06-1209
- Schiavoni G, Mattei F, Di Pucchio T, Santini SM, Bracci L, Belardelli F, Proietti E. Cyclophosphamide induces type I interferon and augments the number of CD44(hi) T lymphocytes in mice: implications for strategies of chemoimmunotherapy of cancer. Blood 2000; 95:2024-30; PMID:10706870
- Sistigu A, Viaud S, Chaput N, Bracci L, Proietti E, Zitvogel L. Immunomodulatory effects of cyclophosphamide and implementations for vaccine design. Semin Immunopathol 2011; 33:369-83; PMID:21611872; http://dx.doi.org/10.1007/s00281-011-0245-0
- Wada S, Yoshimura K, Hipkiss EL, Harris TJ, Yen HR, Goldberg MV, Grosso JF, Getnet D, Demarzo AM, Netto GJ, et al. Cyclophosphamide augments antitumor immunity: studies in an autochthonous prostate cancer model. Cancer Res 2009; 69:4309-18; PMID:19435909; http://dx.doi.org/10.1158/0008-5472.CAN-08-4102
- Doloff JC, Waxman DJ. VEGF receptor inhibitors block the ability of metronomically dosed cyclophosphamide to activate innate immunity-induced tumor regression. Cancer Res 2012; 72:1103-15; PMID:22237627; http://dx.doi.org/10.1158/0008-5472.CAN-11-3380
- Chang CL, Hsu YT, Wu CC, Lai YZ, Wang C, Yang YC, Wu TC, Hung CF. Dose-dense chemotherapy improves mechanisms of antitumor immune response. Cancer Res 2013; 73:119-27; PMID:23108141; http://dx.doi.org/10.1158/0008-5472.CAN-12-2225
- Andre N, Carre M, Pasquier E. Metronomics: towards personalized chemotherapy? Nat Rev Clin Oncol 2014; 11:413-31; PMID:24913374; http://dx.doi.org/10.1038/nrclinonc.2014.89
- Chen CS, Doloff JC, Waxman DJ. Intermittent metronomic drug schedule is essential for activating antitumor innate immunity and tumor xenograft regression. Neoplasia 2014; 16:84-96; PMID:24563621
- Wu J, Waxman DJ. Metronomic cyclophosphamide schedule-dependence of innate immune cell recruitment and tumor regression in an implanted glioma model. Cancer Lett 2014; 353:272-80; PMID:25069038; http://dx.doi.org/10.1016/j.canlet.2014.07.033
- Kagi D, Ledermann B, Burki K, Seiler P, Odermatt B, Olsen KJ, Podack ER, Zinkernagel RM, Hengartner H. Cytotoxicity mediated by T cells and natural killer cells is greatly impaired in perforin-deficient mice. Nature 1994; 369:31-7; PMID:8164737; http://dx.doi.org/10.1038/369031a0
- Pardo J, Balkow S, Anel A, Simon MM. Granzymes are essential for natural killer cell-mediated and perf-facilitated tumor control. Eur J Immunol 2002; 32:2881-7; PMID:12355441; http://dx.doi.org/10.1002/1521-4141(2002010)32:10%3c2881::AID-IMMU2881%3e3.0.CO;2-K
- Heusel JW, Wesselschmidt RL, Shresta S, Russell JH, Ley TJ. Cytotoxic lymphocytes require granzyme B for the rapid induction of DNA fragmentation and apoptosis in allogeneic target cells. Cell 1994; 76:977-87; PMID:8137431; http://dx.doi.org/10.1016/0092-8674(94)90376-X
- Peterson RA. Regulatory T-cells: diverse phenotypes integral to immune homeostasis and suppression. Toxicol Pathol 2012; 40:186-204; PMID:22222887; http://dx.doi.org/10.1177/0192623311430693
- Gautron AS, Dominguez-Villar M, de Marcken M, Hafler DA. Enhanced suppressor function of TIM-3+ FoxP3+ regulatory T cells. Eur J Immunol 2014; 44:2703-11; PMID:24838857; http://dx.doi.org/10.1002/eji.201344392
- Andersen MH, Schrama D, Thor Straten P, Becker JC. Cytotoxic T cells. J Invest Dermatol 2006; 126:32-41; PMID:16417215; http://dx.doi.org/10.1038/sj.jid.5700001
- Shevach EM. Mechanisms of foxp3+ T regulatory cell-mediated suppression. Immunity 2009; 30:636-45; PMID:19464986; http://dx.doi.org/10.1016/j.immuni.2009.04.010
- Soudja SM, Ruiz AL, Marie JC, Lauvau G. Inflammatory monocytes activate memory CD8(+) T and innate NK lymphocytes independent of cognate antigen during microbial pathogen invasion. Immunity 2012; 37:549-62; PMID:22940097; http://dx.doi.org/10.1016/j.immuni.2012.05.029
- Mouchemore KA, Pixley FJ. CSF-1 signaling in macrophages: pleiotrophy through phosphotyrosine-based signaling pathways. Crit Rev Clin Lab Sci 2012; 49:49-61; PMID:22468857; http://dx.doi.org/10.3109/10408363.2012.666845
- Noronha V, Krishna MV, Patil V, Joshi A, Banavali SD, Prabhash K. Metronomic therapy: chemotherapy revisited. Indian J Cancer 2013; 50:142-8; PMID:23979206; http://dx.doi.org/10.4103/0019-509X.117027
- Emens LA. Chemoimmunotherapy. Cancer J 2010; 16:295-303; PMID:20693839; http://dx.doi.org/10.1097/PPO.0b013e3181eb5066
- Bouche G, Andre N, Banavali S, Berthold F, Berruti A, Bocci G, Brandi G, Cavallaro U, Cinieri S, Colleoni M, et al. Lessons from the fourth metronomic and anti-angiogenic therapy meeting, 24-25 june 2014, milan. Ecancermedicalscience 2014; 8:463; PMID:25228919
- Goldberg EL, Smithey MJ, Lutes LK, Uhrlaub JL, Nikolich-Zugich J. Immune memory-boosting dose of rapamycin impairs macrophage vesicle acidification and curtails glycolysis in effector CD8 cells, impairing defense against acute infections. J Immunol 2014; 193:757-63; PMID:24913978; http://dx.doi.org/10.4049/jimmunol.1400188
- Stathopoulos A, Pretto C, Devillers L, Pierre D, Hofman FM, Kruse C, Jadus M, Chen TC, Schijns VE. Development of immune memory to glial brain tumors after tumor regression induced by immunotherapeutic Toll-like receptor 7/8 activation. Oncoimmunology 2012; 1:298-305; PMID:22737605; http://dx.doi.org/10.4161/onci.19068
- Doloff JC, Chen CS, Waxman DJ. Anti-tumor innate immunity activated by intermittent metronomic cyclophosphamide treatment of 9L brain tumor xenografts is preserved by anti-angiogenic drugs that spare VEGF receptor 2. Mol Cancer 2014; 13:158; PMID:24965046; http://dx.doi.org/10.1186/1476-4598-13-158
- Tongu M, Harashima N, Monma H, Inao T, Yamada T, Kawauchi H, Harada M. Metronomic chemotherapy with low-dose cyclophosphamide plus gemcitabine can induce anti-tumor T cell immunity in vivo. Cancer Immunol Immunother 2013; 62:383-91; PMID:22926062; http://dx.doi.org/10.1007/s00262-012-1343-0
- Peng S, Lyford-Pike S, Akpeng B, Wu A, Hung CF, Hannaman D, Saunders JR, Wu TC, Pai SI. Low-dose cyclophosphamide administered as daily or single dose enhances the antitumor effects of a therapeutic HPV vaccine. Cancer Immunol Immunother 2013; 62:171-82; PMID:23011589; http://dx.doi.org/10.1007/s00262-012-1322-5
- Mocikat R, Braumuller H, Gumy A, Egeter O, Ziegler H, Reusch U, Bubeck A, Louis J, Mailhammer R, Riethmüller G, et al. Natural killer cells activated by MHC class I(low) targets prime dendritic cells to induce protective CD8 T cell responses. Immunity 2003; 19:561-9; PMID:14563320; http://dx.doi.org/10.1016/S1074-7613(03)00264-4
- Salem ML, Hossain MS. In vivo acute depletion of CD8(+) T cells before murine cytomegalovirus infection upregulated innate antiviral activity of natural killer cells. Int J Immunopharmacol 2000; 22:707-18; PMID:10884591; http://dx.doi.org/10.1016/S0192-0561(00)00033-3
- Alvarez M, Bouchlaka MN, Sckisel GD, Sungur CM, Chen M, Murphy WJ. Increased antitumor effects using IL-2 with anti-TGF-beta reveals competition between mouse NK and CD8 T cells. J Immunol 2014; 193:1709-16; PMID:25000978; http://dx.doi.org/10.4049/jimmunol.1400034
- Fehniger TA, Cooper MA, Caligiuri MA. Interleukin-2 and interleukin-15: immunotherapy for cancer. Cytokine Growth Factor Rev 2002; 13:169-83; PMID:11900992; http://dx.doi.org/10.1016/S1359-6101(01)00021-1
- Noy R, Pollard JW. Tumor-associated macrophages: from mechanisms to therapy. Immunity 2014; 41:49-61; PMID:25035953; http://dx.doi.org/10.1016/j.immuni.2014.06.010
- Parameswaran N, Patial S. Tumor necrosis factor-alpha signaling in macrophages. Crit Rev Eukaryot Gene Expr 2010; 20:87-103; PMID:21133840; http://dx.doi.org/10.1615/CritRevEukarGeneExpr.v20.i2.10
- Ding ZC, Zhou G. Cytotoxic chemotherapy and CD4+ effector T cells: an emerging alliance for durable antitumor effects. Clin Dev Immunol 2012; 2012:890178; PMID:22400040; http://dx.doi.org/10.1155/2012/890178
- Sevko A, Sade-Feldman M, Kanterman J, Michels T, Falk CS, Umansky L, Ramacher M, Kato M, Schadendorf D, Baniyash M, et al. Cyclophosphamide promotes chronic inflammation-dependent immunosuppression and prevents antitumor response in melanoma. J Invest Dermatol 2013; 133:1610-9; PMID:23223128; http://dx.doi.org/10.1038/jid.2012.444
- Gabrilovich DI, Nagaraj S. Myeloid-derived suppressor cells as regulators of the immune system. Nat Rev Immunol 2009; 9:162-74; PMID:19197294; http://dx.doi.org/10.1038/nri2506
- Moschella F, Valentini M, Arico E, Macchia I, Sestili P, D'Urso MT, Alessandri C, Belardelli F, Proietti E. Unraveling cancer chemoimmunotherapy mechanisms by gene and protein expression profiling of responses to cyclophosphamide. Cancer Res 2011; 71:3528-39; PMID:21444678; http://dx.doi.org/10.1158/0008-5472.CAN-10-4523
- Franciszkiewicz K, Boissonnas A, Boutet M, Combadiere C, Mami-Chouaib F. Role of chemokines and chemokine receptors in shaping the effector phase of the antitumor immune response. Cancer Res 2012; 72:6325-32; PMID:23222302; http://dx.doi.org/10.1158/0008-5472.CAN-12-2027
- Berard M, Brandt K, Bulfone-Paus S, Tough DF. IL-15 promotes the survival of naive and memory phenotype CD8+ T cells. J Immunol 2003; 170:5018-26; PMID:12734346; http://dx.doi.org/10.4049/jimmunol.170.10.5018
- Bracci L, Schiavoni G, Sistigu A, Belardelli F. Immune-based mechanisms of cytotoxic chemotherapy: implications for the design of novel and rationale-based combined treatments against cancer. Cell Death Differ 2014; 21:15-25; PMID:23787994; http://dx.doi.org/10.1038/cdd.2013.67
- Rozados VR, Mainetti LE, Rico MJ, Zacarias Fluck MF, Matar P, Scharovsky OG. The immune response and the therapeutic effect of metronomic chemotherapy with cyclophosphamide. Oncol Res 2010; 18:601-5; PMID:20939436; http://dx.doi.org/10.3727/096504010X12777678141662
- Denies S, Cicchelero L, Van Audenhove I, Sanders NN. Combination of interleukin-12 gene therapy, metronomic cyclophosphamide and DNA cancer vaccination directs all arms of the immune system towards tumor eradication. J Control Release 2014; 187:175-82; PMID:24887014; http://dx.doi.org/10.1016/j.jconrel.2014.05.045
- Man S, Bocci G, Francia G, Green SK, Jothy S, Hanahan D, Bohlen P, Hicklin DJ, Bergers G, Kerbel RS. Antitumor effects in mice of low-dose (metronomic) cyclophosphamide administered continuously through the drinking water. Cancer Res 2002; 62:2731-5; PMID:12019144
- Khan N, Hou H, Hodge S, Kuppusamy M, Chen EY, Eastman A, Kuppusamy P, Swartz HM. Recurrent low-dose chemotherapy to inhibit and oxygenate head and neck tumors. Adv Exp Med Biol 2014; 812:105-11; PMID:24729221; http://dx.doi.org/10.1007/978-1-4939-0620-8_14
- Klement G, Baruchel S, Rak J, Man S, Clark K, Hicklin DJ, Bohlen P, Kerbel RS. Continuous low-dose therapy with vinblastine and VEGF receptor-2 antibody induces sustained tumor regression without overt toxicity. J Clin Invest 2000; 105:R15-24; PMID:10772661; http://dx.doi.org/10.1172/JCI8829
- Browder T, Butterfield CE, Kraling BM, Shi B, Marshall B, O'Reilly MS, Folkman J. Antiangiogenic scheduling of chemotherapy improves efficacy against experimental drug-resistant cancer. Cancer Res 2000; 60:1878-86; PMID:10766175
- Lake RA, Robinson BW. Immunotherapy and chemotherapy–a practical partnership. Nat Rev Cancer 2005; 5:397-405; PMID:15864281; http://dx.doi.org/10.1038/nrc1613
- Nguyen A, Ho L, Wan Y. Chemotherapy and oncolytic virotherapy: advanced tactics in the war against cancer. Front Oncol 2014; 4:145; PMID:24967214
- Jia L, Waxman DJ. Thrombospondin-1 and pigment epithelium-derived factor enhance responsiveness of KM12 colon tumor to metronomic cyclophosphamide but have disparate effects on tumor metastasis. Cancer Lett 2013; 330:241-9; PMID:23228633; http://dx.doi.org/10.1016/j.canlet.2012.11.055
- Adair JE, Johnston SK, Mrugala MM, Beard BC, Guyman LA, Baldock AL, Bridge CA, Hawkins-Daarud A, Gori JL, Born DE, et al. Gene therapy enhances chemotherapy tolerance and efficacy in glioblastoma patients. J Clin Invest 2014; 124:4082-92; PMID:25105369; http://dx.doi.org/10.1172/JCI76739
- Stupp R, Hegi ME, Mason WP, van den Bent MJ, Taphoorn MJ, Janzer RC, Ludwin SK, Allgeier A, Fisher B, Belanger K, et al. Effects of radiotherapy with concomitant and adjuvant temozolomide versus radiotherapy alone on survival in glioblastoma in a randomised phase III study: 5-year analysis of the EORTC-NCIC trial. Lancet Oncol 2009; 10:459-66; PMID:19269895; http://dx.doi.org/10.1016/S1470-2045(09)70025-7
- Wolff JE, Finlay JL. High-dose chemotherapy in childhood brain tumors. Onkologie 2004; 27:239-45; PMID:15249712; http://dx.doi.org/10.1159/000077973
- Abrahamsen TG, Lange BJ, Packer RJ, Venzon DJ, Allen JC, Craig CE, Patronas NJ, Katz DA, Goldwein JW, DeLaney TF, et al. A phase I and II trial of dose-intensified cyclophosphamide and GM-CSF in pediatric malignant brain tumors. J Pediatr Hematol Oncol 1995; 17:134-9; PMID:7749762; http://dx.doi.org/10.1097/00043426-199505000-00006
- Yule SM, Foreman NK, Mitchell C, Gouldon N, May P, McDowell HP. High-dose cyclophosphamide for poor-prognosis and recurrent pediatric brain tumors: a dose-escalation study. J Clin Oncol 1997; 15:3258-65; PMID:9336363
- Banissi C, Ghiringhelli F, Chen L, Carpentier AF. Treg depletion with a low-dose metronomic temozolomide regimen in a rat glioma model. Cancer Immunol Immunother 2009; 58:1627-34; PMID:19221744; http://dx.doi.org/10.1007/s00262-009-0671-1
- Lechner MG, Karimi SS, Barry-Holson K, Angell TE, Murphy KA, Church CH, Ohlfest JR, Hu P, Epstein AL. Immunogenicity of murine solid tumor models as a defining feature of in vivo behavior and response to immunotherapy. J Immunother 2013; 36:477-89; PMID:24145359; http://dx.doi.org/10.1097/01.cji.0000436722.46675.4a