
 ?Mathematical formulae have been encoded as MathML and are displayed in this HTML version using MathJax in order to improve their display. Uncheck the box to turn MathJax off. This feature requires Javascript. Click on a formula to zoom.
Abstract
Neuroblastoma grows within an intricate network of different cell types including epithelial, stromal and immune cells. The presence of tumor-infiltrating T cells is considered an important prognostic indicator in many cancers, but the role of these cells in neuroblastoma remains to be elucidated. Herein, we examined the relationship between the type, density and organization of infiltrating T cells and clinical outcome within a large collection of neuroblastoma samples by quantitative analysis of immunohistochemical staining. We found that infiltrating T cells have a prognostic value greater than, and independent of, the criteria currently used to stage neuroblastoma. A variable in situ structural organization and different concurrent infiltration of T-cell subsets were detected in tumors with various outcomes. Low-risk neuroblastomas were characterized by a higher number of proliferating T cells and a more structured T-cell organization, which was gradually lost in tumors with poor prognosis. We defined an immunoscore based on the presence of CD3+, CD4+ and CD8+ infiltrating T cells that associates with favorable clinical outcome in MYCN-amplified tumors, improving patient survival when combined with the v-myc avian myelocytomatosis viral oncogene neuroblastoma derived homolog (MYCN) status. These findings support the hypothesis that infiltrating T cells influence the behavior of neuroblastoma and might be of clinical importance for the treatment of patients.
Introduction
Tumor-infiltrating T lymphocytes play a key role in mediating control of cancer growth.Citation1 In colorectal cancer, these cells were found to have a prognostic factor greater than the histopathological criteria currently available,Citation2 thus providing evidence that in situ analysis of tumor-infiltrating T cells may represent a powerful prognostic tool also for other types of cancers.
Analyses of a large collection of malignant tumors have allowed the identification of immune cells with either favorable or deleterious effect on clinical outcome. In general, high densities of CD8+ cytotoxic T cells, CD45RO+ memory T cells and CD4+ Th1 T cells have been associated with good clinical outcome in several solid tumors, including melanoma, head and neck, breast, bladder, ovarian, colorectal, renal, prostatic, esophageal, pancreatic, urothelial and lung carcinomas.Citation2-4 Conversely, the effect of CD4+ Th2 T cells and regulatory T (Treg) cells on clinical outcome is apparently contradictory, depending on the tumor type and microenvironment.Citation1 High density of infiltrating Treg cells has been correlated with poor overall survival in breast and hepatocellular carcinomas,Citation5-8 and with either increased overall survival or no effect in other types of cancers.Citation1 Moreover, the presence of a favorable immunological signature has also been shown to predict a good response to chemotherapy in many tumors.Citation9-11
Neuroblastoma is a common solid tumor of childhood arising from neural crest cells involved in development of sympathetic nervous system.Citation12,13 It displays the highest rate of spontaneous regression observed among human cancers.Citation14 The induction of patients' immune response toward their own tumor cells is one of the mechanisms suggested to contribute to this phenomenon.Citation15 Despite the fact that density of T cells has been associated with favorable clinical outcome in neuroblastoma more than 40 years ago,Citation16,17 the current knowledge of the types of immune cells infiltrating neuroblastoma is limited to a few studies conducted on a small number of specimens.Citation18,19 Some authors identified populations of CD4+ and CD8+ T cells with an activated (CD25+ and/or HLA-DR+) phenotype,Citation18 while others found CD25+ T cells or cells with effector memory (CCR7−CD45RA−) phenotype.Citation19 However, a detailed description of the various T-cell subsets resident within a large collection of neuroblastoma specimens is not currently available.
To address this issue, we investigated the relationship between the type, density and location of T cells and clinical outcome within a large collection of neuroblastoma samples. We found that infiltrating T cells have a prognostic value independent of the current indicators used for neuroblastoma staging. Low-risk neuroblastomas display a higher number of proliferating and more structured infiltrating T cells that enter in close contact with tumor cells. In MYCN-amplified tumors, the presence of a defined subset of infiltrating T cells was associated with a more favorable outcome.
Results
Density of infiltrating CD3+ T cells correlates with clinical outcome of neuroblastoma
To investigate the relationship between the type, density and location of T cells within neuroblastoma lesions and the clinical outcome of patients, we performed in situ immunohistochemical analysis in a cohort of 84 neuroblastoma samples (Table S1). The density of total T lymphocytes (CD3+) quantified in tumor cell nests and in surrounding fibrovascular septa ranged from samples with prominent infiltrates, to others with no infiltration (). Survival analysis for up to 12 years after primary-tumor resection was performed by stratifying the subjects according to the median cut-off value for CD3+ T-cell density (i.e. 50% of patients with high density and 50% of patients with low density) (; Fig. S1). Density of CD3+ T cells in both nests and septa was significantly correlated with patient outcome (; Fig. S2A and B). Specifically, the median CD3+ cut-off allowed patient stratification into groups with significantly different disease-free survival (p values corrected by false discovery rate were 0.0397 and 0.0156, respectively), overall survival (p values: 0.0029 and 0.0044) and event-free survival (p values: 0.0241 and 0.0143) (Table S2). The distribution of survival data of the entire cohort (i.e., the distribution of the time elapsed from diagnosis to latest follow-up or death) is shown in Fig. S2C and in supplementary material.
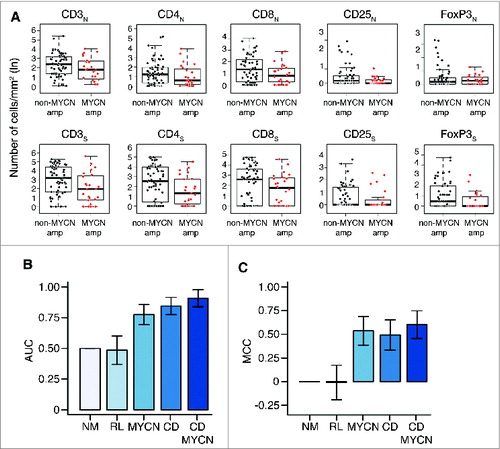
Figure 1. For figure legend, see next page. Figure 1 (See previous page). Density of CD3+ T cells associates with clinical outcome in neuroblastoma (A). Representative examples of low (Lo) and high (Hi) density of CD3+ T cells in neuroblastoma samples. CD3+ T cells (red) and tumor cells (blue) are shown in nest (N) and septa (S) regions. Blue and green arrows indicate CD3+ T cells infiltrated in the nest and in the septa, respectively. The density of CD3+ T cells was recorded as the number of positive cells per unit of tissue surface area. Cut-off values of immune cell densities, defined as the median of the cohort, are reported for each tumor region. (B) Kaplan–Meier curves show the duration of disease-free survival according to the CD3+ T cell density in a single tumor region in the nests or septa (left and middle panels, respectively), and in both tumor regions (right panels). In each tumor region, high (Hi) and low (Lo) cell densities were plotted according to the cut-off value of cell density. In single-region analysis (left and middle panels), black lines indicate high cell density and red lines indicate low cell density. In combined analysis (right panels), black and red lines indicate high and low cell densities, respectively, in nests and septa, and purple line indicates heterogeneous (Het) cell density in both tumor regions (high density in nests and low density in septa or, vice versa, low density in nests and high density in septa). (C) and (D) Box plots of the CD3+ T cell density in the nest (N) or septa (S) regions according to the high- (Hi) or low/intermediate- (Lo) COG risks (C) and the INSS stages (1, 2, 4, 4S) (D) NB patients with stage 3 (n = 4) were omitted from the analysis because not representative. The boxes show the 25th to 75th percentile, the horizontal line inside the box represents the median, the whiskers extend to the most extreme data point which is no more than 1.5 times the interquartile range from the box and the circles are individual samples. *p < 0.05, **p < 0.001, ***p < 0.0001.
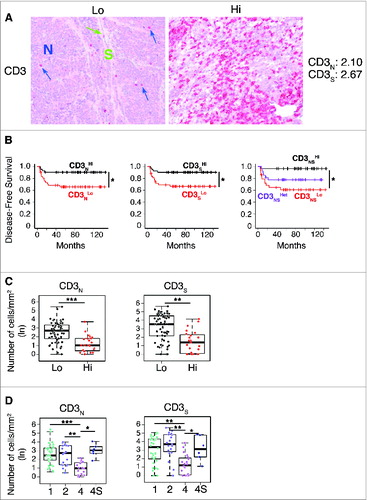
Next, we investigated whether the combined analysis of nest and septa tumor regions could improve the survival. Patients were stratified in three subgroups based on the density of CD3+ T cells within the two tumor regions: high or low density in both regions (CD3NSHi and CD3NSLo, respectively) and heterogeneous density in the two regions (high density in nests and low density in septa or, vice versa, low density in nests and high density in septa, CD3NSHet). As reported for colorectal cancer,Citation2 the combined analysis of tumor regions improved disease-free survival, overall survival and event-free survival as compared to single-region analysis (p values were 0.0146, 0.001 and 0.0142, respectively) (; Fig. S2A and B, Table S2).
Next, we determined whether these immunological criteria could be associated with the clinical outcome of patients with neuroblastoma at different stages. Patients were stratified according to either the Children's Oncology Group (COG) risk groupsCitation20 or the International Neuroblastoma Staging System (INSS)Citation21 (Fig. S3). We found that a higher density of CD3+ T cells was associated with a favorable prognosis (; Table S3). The distribution of CD3+ T cells in both tumor regions was statistically different between COG high- and low-risk groups (; Table S3) and between INSS stages 1, 2 and 4S versus stage 4 (; Table S3). As expected, neuroblastoma cells from tumors with favorable prognosis expressed high levels of MHC class I molecules (Fig. S4). A significant association was detected between the density of infiltrating CD3+ T cells and the levels of MHC class I molecules on tumor cells (linear regression adjusted R-square: 0.1853, p value: 3.5 × 10⁻⁴), suggesting a possible interaction between infiltrating T cells and tumor cells.
Altogether, these results indicate that density and location of tumor-infiltrating CD3+ T cells may predict the clinical outcome of neuroblastoma.
Tumor-infiltrating CD3+ T cells proliferate in situ and enter in contact with tumor cells in patients with favorable outcome
Next, we evaluated the proliferation status of tumor-infiltrating CD3+ T cells in neuroblastomas at different INSS stage (six stage 4S and five stage 4). Proliferating CD3+ T cells were counted and their location was estimated by automatic image analysis (see Methods). This analysis confirmed the manual quantification of tumor-infiltrating CD3+ T cells (; Fig. S5A). On average, stage 4S neuroblastomas were characterized by a higher number of proliferating CD3+ T cells, as compared to stage 4 (Wilcoxon rank-sum p value: 0.048) (; Fig. S5B). These immune cells were differently distributed in the two groups of tumors, being localized in close proximity to tumor cells in stage 4S and placed distant from tumor cells in stage 4 (Wilcoxon rank-sum p value: 0.022) (; Fig. S5C). Interestingly, a higher number of proliferating CD3+ T cells was attached to tumor cells in stage 4S with respect to stage 4 ().
Figure 2. Tumor infiltrating CD3+ T cells proliferate in situ and enter in contact with tumor cells in low-risk neuroblastoma (A). Comparative estimation of manual and automatic counts of CD3+ T cells in a representative set of five neuroblastoma stage 4 (fuchsia dots) and six neuroblastoma stage 4S (blue dots). (B) Automatic analysis pipeline of CD3+ T cell density in neuroblastoma samples. Each dot represents the average number of lymphocytes for single subject. (C) Representative examples of CD3/Ki67 double staining of primary neuroblastoma lesions visualized with Fast Red (red) and diaminobenzidine (brown), respectively. Nuclei were counter stained with haematoxylin (blue). CD3+ T cells (white arrows) and proliferating tumor cells (black arrows) are indicated. (D) and (E) Automatic quantification of CD3+ T cells (D) and proliferating CD3+ T cells close to at least one tumor cell (E). Each dot represents the average number of lymphocytes for single subject. * p < 0.05
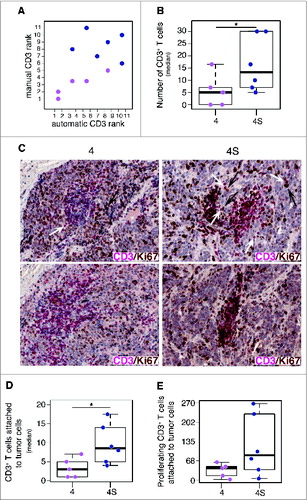
Consistently with the role of T cells in suppressing tumor progression, the high density of proliferating CD3+ T cells close to tumor cells in less aggressive neuroblastoma may be indicative of favorable clinical outcome.
Density of infiltrating CD4+ and CD8+ T cells correlates with clinical outcome of neuroblastoma
To identify the subset(s) of T cells correlating with clinical outcome of neuroblastoma, T-cell effectors (CD4+ and CD8+) and Treg cells (CD25+ and FOXP3+) were studied in the same cohort of 84 neuroblastomas by in situ immunohistochemical analysis. As for CD3+ T cells, density of immune cells was quantified in the nest and in the septa tumor regions (; Fig. S6).
Figure 3. Density of CD4+ T cells associates with clinical outcome in neuroblastoma (A). Representative examples of low (Lo) and high (Hi) density of adaptive immune cells in neuroblastoma lesions. The density of T cells was recorded as the number of positive cells per unit of tissue surface area. Cut-off values of immune cell densities, defined as the median of the cohort, are reported for nest (N) and septa (S) tumor regions. (B) Kaplan–Meier curves show the duration of disease-free survival according to the CD4+, CD8+, CD25+ and FOXP3+ cell density in a single tumor region in the nests or septa (top and middle panels, respectively), and in both tumor regions (bottom panels). In each tumor region, high (Hi) and low (Lo) cell densities were plotted according to the cut-off value of cell density. In single-region analysis (top and middle panels), black lines indicate high cell density and red lines indicate low cell density. In combined analysis (bottom panels), black and red lines indicate high and low cell densities, respectively, in nests and septa, and purple lines indicate heterogeneous cell density in both tumor regions. * p < 0.05.
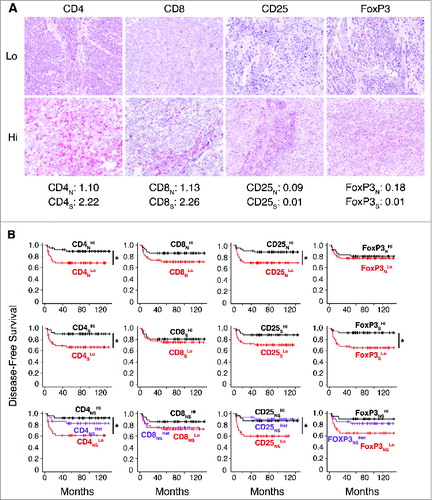
Survival analysis revealed a statistically significant correlation between the density of CD4+ in nest and septa tumor regions and patient outcome (). Specifically, the density of CD4+ T cells supported the stratification of patients into groups with different disease-free survival (p values: nests 0.0421; septa 0.0156), overall survival (p values: nests 0.0062, septa 0.0044) and event-free survival (p values: nests 0.0269, septa 0.0143) (; Figs. S7 and S8, Table S2). The density of CD25+ T cells in the nests and of FOXP3+ T cells in the septa also appeared to correlate with patient outcome (; Figs. S7 and S8, Table S2). The combined analysis of tumor regions for CD4+ and CD25+ improved stratification for disease-free survival (p values: CD4+ 0.0203, CD25+ 0.0146), overall survival (p values: CD4+ 0.0047, CD25+ 0.0069), event-free survival (CD4+ 0.0142, CD25+ 0.0157) (; Fig. S7 and S8, Table S2).
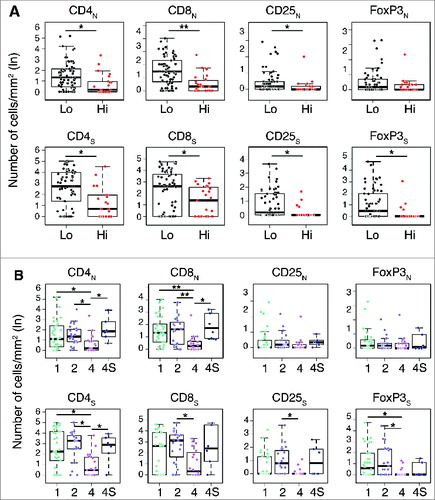
In general, a higher density of T cell subtypes was always associated with a favorable prognosis in both COG and INSS classification systems ( and Table S3. Specifically, the distribution of CD4+, CD8+ and CD25+ cells in both nests and septa, and of FOXP3+ cells in septa only, was statistically different between COG high- and low-risk groups (; Table S3). A significantly different distribution between INSS stages 1, 2 and 4S vs. stage 4 was also found for CD4+ in both nests and septa and for CD8+ in nests (; Table S3). CD8+, CD25+ and FoxP3+ cells in septa were also significantly distributed between INSS stages 2 and/or 1 versus stage 4 (; Table S3).
Figure 4. Density of immune cells identifies the outcome of neuroblastoma according to the COG risk and INSS stages Box plots of the CD4+, CD8+, CD25+ and FOXP3+ cell densities in the nest (N) or septa (S) regions according to the high- or low/intermediate-COG risks (A) and the INSS stages (B). NB patients with stage 3 (n = 4) were omitted from the analysis because not representative. * p < 0.05, ** p < 0.001.
Density of infiltrating T cells is not associated with MYCN amplification and age at diagnosis in neuroblastoma
To verify whether the abundance of infiltrating T lymphocytes may represent an independent predictor of clinical outcome in neuroblastoma, the association between density of T-cell subsets and two major clinicopathological features (MYCN amplification and age at diagnosis) was studied by both univariate and multivariate analyses. No statistically significant association was detected between the density of different T-cell subsets in the two tumor regions and MYCN-amplification by univariate analysis (Wilcoxon rank-sum test p values greater than 0.3) (; Table S3). Consistently, results of multivariate logistic regression analysis performed to predict the MYCN amplification status from the density of T-cell subsets in the nest and septa tumor regions were not significantly different from those obtained by the random predictor (Chi-Square test between output distributions, p value: 0.11).
Figure 5. Density of immune cells is a prognostic factor independent from MYCN amplification status (A). Box plots of the immune cell density in the nest (N) or septa (S) tumor regions for MYCN amplified and not-MYCN amplified neuroblastomas. (B) Mean and standard deviation of the Area Under the Curve (AUC) for the COG risk group predictors. (C). Mean and standard deviation of the Matthew Correlation Coefficient (MCC) for the same COG risk group predictors. In (B) and (C) from the left: Null Model predictor (NM), Random Labels predictor based on immune cell density and MYCN (RL), predictor based on MYCN (MYCN), immune cell density (CD), or both markers (CD and MYCN). Performance in the 3-fold cross validation scheme.
Similarly, no significant association was detected between the density of T-cell subsets and age at diagnosis (F-statistics p values of linear regression models greater than 0.09) (Fig. S9, Table S3). In addition, multivariate linear regression analysis performed to predict age at diagnosis from T-cell density values also gives results not significantly different from those of the random predictor (F-statistics p value: 0.33) (Table S3).
Next, we built a logistic regression model to evaluate whether the density of T lymphocytes in both tumor regions could predict COG risk groups, and evaluated its predictive power in a 3-fold cross validation scheme (see Methods and Table S4). The model was able to predict the COG risk group with an area under the curve (AUC) of 0.84 ± 0.07 and a Matthews Correlation Coefficient (MCC) of 0.49 ± 0.16, showing a significant increment in the predictive power compared to the random null model (NM) (AUC: 0.50 ± 0.00; MCC: 0.00 ± 0.00; Chi-Square average p value: 4.21 × 10⁻⁶) and random labels (RL) model (AUC: 0.48 ± 0.12; MCC: 0.00 ± 0.18) (). This model based on T-cell density was comparable (in terms of predictive power) to the one based only on MYCN amplification status (AUC: 0.77 ± 0.08; MCC: 0.54 ± 0.15; Chi-Square vs NM, average p value: 2.16 × 10⁻⁵). Since T-cell density is independent from MYCN amplification status (), we built an integrated classifier using T-cell density values and MYCN amplification status as predictive features. The integrated immunological-clinical predictor showed an improvement in predictive power (AUC: 0.91 ± 0.07; MCC: 0.60 ± 0.15; Chi-Square vs NM, p value: 5.03 × 10⁻⁹) (). The confusion matrices of the five predictors are reported in Table S5. The machine learning analysis repeated under a 4-fold cross validation scheme gave results comparable to those obtained with a 3-fold cross validation scheme (Fig. S10, Tables S5 and S6).
Thus, these results demonstrate that a higher density of T cells (i) is a significant and independent predictor of clinical outcome in neuroblastoma, and (ii) can be usefully integrated with established prognostic markers, such as the MYCN amplification status and age at diagnosis.
The network of infiltrating CD4+ and CD8+ T cells characterizes the clinical outcome of neuroblastoma
Several studies indicate that the coordinated interaction of different T-cell subsets is essential for promoting and maintaining an active and efficient adaptive immunity. In particular, the cooperation between CD4+ and CD8+ T cells is required for sustaining the effector functions of CD8+ T cells during viral infectionsCitation22-27 and for in vivo tumor eradication.Citation28,29 In esophageal squamous cell carcinomaCitation22 and non-small-cell lung carcinoma,Citation30 the survival rate for patients with high levels of infiltrating CD4+ and CD8+ T cells was significantly better as compared to patients whose tumor specimens lack one or both T-cell subtypes. In liver tumors, high CD4+/CD3+ and CD8+/CD3+ ratios were significantly associated with an improved overall survival.Citation31
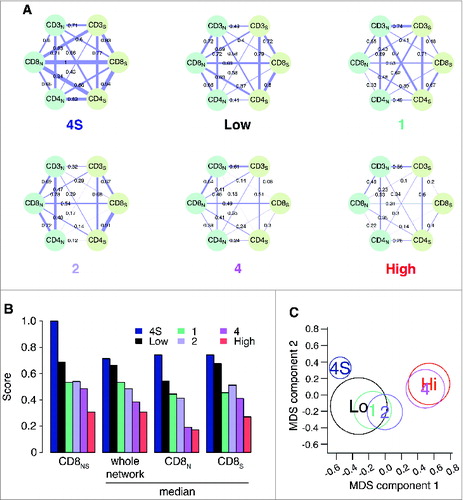
In view of these results, we evaluated the degree of concurrent infiltration of CD3+, CD4+ and CD8+ T cells in neuroblastoma samples of patients belonging to the different COG risk groups and INSS stages (). CD25+ and FOXP3+ T cells were excluded from this analysis because presented only in a small number of patients. The association (Spearman correlation) between the CD3+, CD4+ and CD8+ markers in nests and septa, evaluated over the COG risk groups (low/intermediate and high) and INSS stages (1, 2, 4, 4S), produced 6 correlation networks of 6 nodes and 15 edges each (), revealing strong differences between co-infiltration patterns. Tumors with favorable outcome (stage 4S: median correlation weight 0.70; low-risk: 0.68; stage 1: 0.55; stage 2: 0.50) were characterized by a stronger correlation between T-cell subsets, as compared with tumors with unfavorable outcome (stage 4: 0.38; high-risk: 0.30) (). A differential network analysis based on the Hamming–Ipsen–Mikhailov (HIM) indicatorCitation32 revealed a gradual disruption of the correlation structure that was associated with a drift toward poor outcome (), with the biggest differences measured between stages 4 and 4S (HIM: 0.45) and COG high- and low-risk groups (HIM: 0.35) (Table S7). Furthermore, we found that CD8+ T cells were progressively de-correlated from the other markers from low- to high-risk tumors (; Fig. S11).
Figure 6. Correlation network and survival analyses confirm the importance of collaborative T-cell infiltration in defining neuroblastoma clinical outcome (A). Correlation networks for COG risk groups (Low, High) and INSS stages (1, 2, 4, 4S). Vertices represent the immune cell densities in nests (dark green) and septa (light green), respectively. Edge thickness is proportional to the Spearman correlation coefficient between the connected immune cell densities, also numerically reported on top of each edge. (B) Comparison of the correlation scores most varying in the six correlation networks. From the left, correlation between CD8 nest and CD8 septa (CD8NS), median correlation for the whole network, median correlation for the edges insisting on CD8 nest (CD8N), and median correlation for the edges insisting on CD8 septa (CD8S). Additional comparisons are shown in Fig. S5. (C) Multi-Dimensional Scaling (MDS) of the pairwise distances between the six correlation networks. Networks were compared by the Hamming–Ipsen–Mikhailov (HIM) indicator. The size of each circle is proportional to the number of samples in each class.
These results prompted us to investigate the balance between the different T-cell subsets and its association to the prognosis. Patients were stratified according to the densities of CD3+ (high or low) and the CD4+/CD8+ ratios, in nest or septa tumor regions. The CD4+/CD8+ ratio cut-off thresholds were determined in an unsupervised manner, exploiting the observed multimodal nature of the CD4+/CD8+ ratio distribution in the entire cohort (see Methods). Four different groups were defined for each tumor region (; Table S8). A strong in situ immune reaction (high CD3+ T cells) correlated with a favorable prognosis regardless of the CD4+/CD8+ ratio. Conversely, a weak in situ immune reaction (low CD3+ T cells), differently affected the survival rate of patients depending on the CD4+/CD8+ balance. Specifically, a predominance of CD8+ cells on CD4+ cells (i.e., CD4+/CD8+ ratio less than 2.23 and 1.72, respectively, for septa and nests) was associated with very poor prognosis, whereas a predominance of CD4+ cells on CD8+ cells was associated with a good prognosis (Cox regression p values of 0.018 and 0.004 for nests and septa, respectively) (; Table S8. Thus, we can distinguish two groups of infiltrating T cells, one of “good quality” (high CD3+ or low CD3+ and high CD4+/CD8+ ratio) associated with good prognosis, and another of “bad quality” (low CD3+ and low CD4+/CD8+ ratio) associated with poor prognosis.
Figure 7. High density of tumor-infiltrating T cells predicts the clinical outcome of neuroblastoma patients (A). Kaplan–Meier curves show the disease-free survival of patients according to the CD3+ T cell density and the CD4+/CD8+ ratio in the septa and nest tumor regions. (B) Kaplan–Meier curves of the disease-free survival of patients according to the MYCN amplification status (MYCN amplified and not-MYCN amplified neuroblastoma patients were 23 and 60, respectively). (C) Kaplan–Meier curves of the disease-free survival of patients according to the T-cell density and MYCN amplification status in the septa and nest regions. The number of subjects in each class in A and C is reported in Tables S8 and S9. *** p < 0.0001.
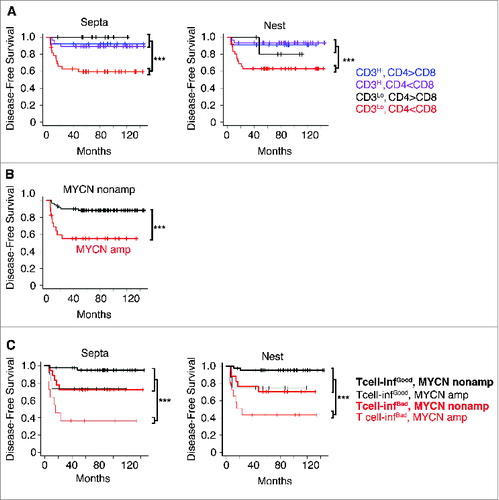
Next, we determined whether these new immunological criteria could improve the prognostic value when combined with MYCN amplification status. Thus, patients were stratified according to the MYCN status alone (), or in combination with infiltrating T cells (). We found that the presence of either “good quality” or “bad quality” infiltrating T cells differently affected disease-free survival of patients with MYCN-amplified and non-MYCN-amplified neuroblastoma. Disease-free survival of non-MYCN-amplified neuroblastoma patients varied from 75% to 95% in the presence of a “bad” or “good quality” infiltrating T cells, while that of MYCN-amplified neuroblastoma patients varied from 38% to 78% (; Table S9). When patients were stratified according to the lowest and the highest CD4+/CD8+ threshold ends of the confidence intervals (1.92 for septa and 1.42 for nests and 3.8 for septa and 3.73 for nests, respectively), similar results were obtained (Fig. S12 and Table S9), suggesting that the use of the CD4+/CD8+ ratio criterion for stratification is rather robust.
Thus, the type, density and composition of immune cells seem to influence the behavior of neuroblastoma and improve the prediction of patient survival when combined with MYCN-amplification status.
Discussion
Herein, we provide new insight into the composition, density and strategic location of tumor-infiltrating T cells in neuroblastoma and their association with clinical outcome. We found that a strong infiltration of CD3+ T cells is significantly associated with better disease-free survival, overall survival and event-free survival. Most important, we showed that T-cell infiltration is an independent prognostic factor and improves the prediction of clinical outcome when combined with the well-established MYCN marker. Intriguingly, we found that neuroblastomas with favorable outcome were characterized by a more structured T-cell infiltration, which was gradually lost in tumors with poor prognosis.
According to the composition of infiltrating T cells, neuroblastoma patients were stratified into groups with different survival. In general, highly infiltrated neuroblastomas had a better outcome than less-infiltrated tumors. In this latter case, the type and composition of immune cells appeared to assume greater importance for patient outcome. A prevalence of CD4+ over CD8+ T cells was associated with a better prognosis in these tumors. We could distinguish infiltrating T cells of “good quality” associated with good prognosis and infiltrating T cells of “bad quality” associated with poor prognosis. Notably, we showed that when patients were stratified according to this immunological criterion together with the MYCN amplification status, the presence of infiltrating T cells of “good quality” significantly improved the survival of MYCN-amplified neuroblastoma patients. Namely, disease-free survival of patients with “bad quality” infiltrating T cells was 38%, while that of patients with “good quality” infiltrating T cells was 78%. These findings underline the higher prognostic value of tumor-infiltrating T cells as compared to conventional markers, and their potential use in clinical practice.
The more structural organization of proliferating T cells in low-risk neuroblastoma reflects the key role of these cells in the spontaneous tumor regression. This hypothesis is supported by a series of dated observations including the strong T-cell infiltration in well-differentiated neuroblastoma,Citation16,33-35 and the transient increase in serum levels of granulysis, an effector molecule released through granule exocytosis pathway by CD8+ T cells,Citation36 during the spontaneous neuroblastoma regression.Citation37 In agreement with these observations, we found that tumors with different outcome displayed a different structural organization and landscape of the various T-cell subsets: neuroblastomas with good prognosis were characterized by a higher number of proliferating CD3+ T cells in close proximity to tumor cells. This picture clearly reflects a different functional state of infiltrating T cells that coincides with the expression levels of MHC class I molecules in neuroblastoma cells. Tumor cells from high-risk neuroblastoma patients express low levels of MHC class I molecules, whereas tumor cells from low-risk neuroblastoma patients express high levels of MHC class I molecules .Citation16,33,38-40 Tumor cells from high-risk neuroblastoma patients are also known to express low levels of components of the antigen processing machineryCitation38-40 and a limited number of tumor-specific CD8+ T cells.Citation41 The scarcity of these cells limits their effectiveness. Recombinant human interferon-γ has been demonstrated to enhance expression of MHC class I molecules and antigen processing components on human neuroblastoma cells, to increase trafficking of human T cells into neuroblastoma tumors in vivo, and to augment the killing of neuroblastoma cells by tumor-specific T cells.Citation42,43 However, immunotherapeutic use of interferon-γ in the treatment of human solid tumors is limited by negative feedback loops preventing long-lasting biological effects.Citation44,45
Adoptive T-cell therapy using autologous ex vivo-expanded tumor-infiltrating T cells transferred back into patients, represents a fascinating option for adjuvant treatment of patients with aggressive neuroblastoma. Our data suggest that infusion of tumor-specific T cells could induce long-lasting complete remission of aggressive neuroblastoma, as already demonstrated in long-term follow-up of melanoma patients.Citation46 In this context, it remains to evaluate the specificity and clonality of T-cell populations infiltrating neuroblastoma, as well as their direct functional involvement in neuroblastoma tissues. A strong T-cell accumulation in tumors is associated with oligoclonal expansion of tumor-infiltrating T cells resulting from a potential selective enrichment of tumor-specific T cells. Recently, high–throughput sequencing of the third complementary-determining region 3 (CDR3) of the T-cell receptor (TCR) β chains, where is contained the specificity of each particular T-cell clone, has been used to study the clonal composition of T-cell population infiltrating ovarian and renal cell carcinomas.Citation47,48 One study revealed a homogeneous antigen receptor repertoire of tumor-infiltrating lymphocytes in ovarian tumors, which is distinct from the T-cell compartment of peripheral blood.Citation47 The other study revealed the complexity and heterogeneity of T-cells clones across different regions of the same tumor.Citation48 Functional activity of tumor-specific T cells can be monitored by their release of effector cytokines. Indeed, upregulation of TNF-α expression in tumor-infiltrating T cells in colorectal cancer has been shown to correlate with an increase of intratumoral TNF-α which is indicative of tumor-specific cytotoxic activity.Citation49
To our knowledge, this is the first study that investigates the prognostic significance of tumor-infiltrating T cells in a fairly numerous collection of neuroblastoma patients. The information presented here might be useful in the clinical management of neuroblastoma with potential impact on patient outcome.
Methods
Patients
Tumor samples from 84 neuroblastoma patients diagnosed between 2002 and 2013 at the Bambino Gesù Children's Hospital were randomly selected and used for this study after obtaining written informed parental consent and approval by the Ethical Committee of the Institution. The clinical information of NB patients including age at diagnosis, disease stage according to the INSSCitation21 and the COG risk groups,Citation22 presence of metastasis, histology, grade of differentiation, MYCN status, 1p aberration are listed in Table S1. Diagnosis and histology were performed according to the INSS and the International Neuroblastoma Pathology Classification (INPC),Citation50 respectively. MYCN and 1p status were evaluated according to current guidelines.Citation51 Two samples classified in the COG intermediate-risk group were included in the COG low-risk group.
Overall survival was defined as the time interval elapsing between the date of diagnosis and the date of death from any cause, or the date of last follow-up for surviving patients. Disease-free survival was defined as the time interval from the date of diagnosis to the date of first relapse/progression, or the date of the last follow-up for surviving patients. Event-free survival was defined as the time interval elapsing between the date of diagnosis and the date of first relapse/progression or death from any cause, or the date of last follow-up for surviving patients.
Immunohistochemistry
Formaldehyde-fixed paraffin-embedded blocks were cut into 3 μm sections for haematoxylin and eosin staining and others immunohistochemical staining. Samples were deparaffinized and subjected to heat-induced antigen retrieval using EnVision FLEX Target retrieval solution at low or high pH (citrate buffer pH 6.1 and Tris/EDTA pH 9.0, respectively) at 96°C for 15 min with PT-link (Dako). For single staining, the avidin/biotin blocking system (Thermo Fisher Scientific, Fremont, CA, USA) was used according to the manufacturer's instructions. Tissue sections were incubated (60 min at room temperature) with monoclonal antibodies (mAb) against CD3 (F7.2.38, Dako), CD4 (1F6, Leica Microsystems) CD8 (C8/144B, Dako), CD25 (4C9, Leica Microsystems), FOXP3 (clone 236A/E7, Abcam) and Ki67 (MM1, Leica Microsystems), β2m-free MHC-I heavy chains (HC10,Citation52) followed by incubation with streptavidin alkaline phosphatase (Dako). Bound streptavidin was detected with Fast Red chromogen substrate (Dako) and levamisole in the reaction mixture for 10 min at room temperature.
For double staining, endogenous peroxidase activity was blocked using FLEX Peroxidase-blocking reagent (Dako) according to the manufacturer's protocol. Sections were incubated (60 min at room temperature) with mAb anti-Ki67 followed by incubation with a secondary antibody coupled with peroxidase (Dako). Bound peroxidase was detected with diaminobenzidine (DAB) solution and EnVision FLEX Substrate buffer containing peroxide (Dako). After performing avidin/biotin blocking system, sections were incubated with mAb CD3 and the detection was performed with biotinylated-secondary antibody (Dako) followed by incubation with streptavidin alkaline phosphatase (Dako) and Fast Red chromogen. Tissue sections were counterstained with EnVision FLEX Haematoxylin (Dako). Sections of normal tonsils were used as positive controls. Isotype-matched mouse mAbs were used as negative controls.
Manual and digital acquisition
Slides were analyzed using an image analysis workstation (D-SIGHT Menarini Diagnostic). The density in nests and in the surrounded fibrovascular septa was recorded by two blinded examiners as the number of positive cells per unit tissue surface area (mm2). The natural logarithm of the mean density of five fields for each sample was used for statistical analysis.
Automatic quantification was performed in the NB samples stained with anti-Ki67 and anti-CD3 and digitally acquired for a total of 852 8-bit RGB images of 1520 × 1017 pixels each. The CRImage image analysis pipelineCitation53 was adapted to count lymphocytes and tumoral cell nuclei in triple stained images. First, in order to correct for staining deviations, color mapping in the LAB space was applied to each image to align the mean and the standard deviation of LAB channels to a reference value (the median values across the entire dataset). Since the process is sensitive to image content differences, white regions in the images were automatically detected and masked, in order to minimize content differences. Afterwards, a color deconvolution process was applied to separate the three staining channels (hematoxylin for nuclei, DAB for Ki67 and Fast Red for CD3).Citation54 Cell segmentation by recursive local Otsu thresholding and Watershed segmentation was separately applied to the Ki67 and the Hematoxylin channels. Segmented cells were then classified into tumor non-proliferating (Ki67-negative cells), tumor proliferating (Ki67-positive cells), and CD3+ T cells, according to the predominance of Ki67 over Hematoxylin, and the presence of CD3 surrounding the cell. The entire pipeline was implemented in R and Python.
Survival analysis and patient stratification
The Kaplan–Meier method was used for the estimation of disease-free survival, overall survival and event-free survival curves. The log-rank test, implemented in the Survival R package, was used to compare disease-free survival, overall survival and event-free survival of groups of patients. Patients were stratified according to the COG stage, the INSS stage, and the cell density for the five markers CD3+, CD4+, CD8+, CD25+ and FOXP3 detected in the two different tumor regions, nest and septa. For each marker, the median of their distribution was used as cut-off to stratify all patients.Citation55,56 To avoid overfitting, no information on the outcome was considered in the process of threshold selection. The cut-off values for CD3+, CD4+, CD8+, CD25+, and FOXP3 cell densities are shown in , while the distribution of the CD3+, CD4+, CD8+, CD25+, and FOXP3 cell densities are shown in Figs. S1 and S6.
To define the CD4+/CD8+ ratio threshold, we exploited the multimodal distribution of the CD4+/CD8+ ratio on the cohort of 84 patients (Hartigans's dip statistic of unimodality p values: 0.007 and 3.2 × 10⁻⁴, respectively, for nest and septa regions). These CD4+/CD8+ distributions were fit separately for nests and septa with a two-component mixture model using the R library mixtools.Citation57 Then, a cut-off threshold was selected as the value at which the probability of drawing a sample at random from the lower component was 0.5. To assess the threshold variability, we repeated the process 100 times considering random subsets of 40 patients each time (∼50% of the entire cohort). The median and the 5%–95% CI of the distribution of thresholds estimated on the subsets of patients were used as CD4+/CD8+ ratio cut-off thresholds in the stratifications (Table S9). No information on the outcome was considered in the process of threshold selection.
Non-parametric Wilcoxon rank-sum test was used to compare density of T-cell subsets between high- and low-risk COG stages, and between INSS stages. The association between automatic and manual CD3+ marker quantification was tested with a permutation test. The Spearman correlation coefficient between the real automatic and manual quantifications was compared to a null distribution of 100,000 Spearman correlation coefficients between randomly permutated quantifications. The fraction of random permutations giving a Spearman correlation coefficient greater than the real one was used as empirical p value. p values were corrected for multiple hypothesis testing by False Discovery Rate, and p values smaller than 0.05 were considered as statistically significant. All the statistical analyses were performed with the R software.
COG stage and MYCN amplification predictive models
Three binary classifiers based on logistic regression for binomial classification of COG stage were trained using the R package glm2 on the cohort of 84 neuroblastomas. The first predictor (MYCN) only considers the MYCN amplification status, the second one (CD) makes use of the density of T-cell subsets (CD3+, CD4+, CD8+, CD25+, FOXP3 in nests and septa) and the third one (CD + MYCN) considers all the features i.e., the density of T-cell subsets and the MYCN amplification status. An additional binary classifier based on logistic regression was trained on the same 84 NB data set, considering all the density of T-cell subsets as features, and the MYCN amplification status (amplified/non-amplified) as the binary label to predict. A 3-fold cross validation scheme was repeated 100 times to evaluate prediction performance avoiding overfitting. In each round, samples were uniformly splitted between training set and validation set (respectively the 66% and the 33% of the total), maintaining the same class ratio (Table S4). For the COG group predictors, in order to reduce feature dimensionality, at each round the logistic model was built on the five density lymphocyte values having highest univariate Wilcoxon rank-sum test scores between classes on the training set. The predictive power of the generalized linear regression models was evaluated with the R package ROCR, selecting the AUC and the MCC as metrics,Citation58 to control for unbalanced classes. In particular, the MCC is computed from the confusion matrix as follows:where TP is the number of True Positives, TN is the number of True Negatives, FP is the number of False Positives and FN is the number of False Negatives. Moreover, the three classifiers were compared to two random predictors to check for potential bias. We considered first the NM, a predictor that assigns all the samples to the most numerous class. The second random predictor, RL, was obtained by training the CD + MYCN predictor with randomly shuffled target class labels. Random predictors are expected to have AUC and MCC close to 0.5 and 0.0, respectively. The Chi-Square test was used to compare the predictors to the NM predictor.
All the analyses were repeated also under a 4-fold cross validation scheme, with training set and validation set containing 75% and 25% of the 84 samples, respectively (Table S4).
Correlation network analysis of tumor-infiltrating T lymphocytes
For each INSS stage (1, 2, 4, 4S) and COG-risk group (low/intermediate and high), a correlation network was generated with Spearman correlation coefficient between six density lymphocyte values, namely CD3+, CD4+ and CD8+ in the nest and septa tumor regions. Correlation networks were compared by applying the HIM indicator,Citation32 a glocal network distance that can quantify at the same time local editing and global structural difference. Multi-Dimensional Scaling (MDS) was used to map the HIM network distances into a 2D space. Correlation networks were plotted with the igraph R library with circular node layout.
Disclosure of Potential Conflicts of Interest
No potential conflicts of interest were disclosed.
Supplemental Material
Supplemental data for this article can be accessed on the publisher's website.
1019981_Supplemental_Materials.zip
Download Zip (4.5 MB)Acknowledgments
The authors thank A. Alisi, G. Jurman and M. Rosado for critical reading of the manuscript.
Funding
This work was supported by Italian Ministry of Health (Rome, Italy) grant PE-2011-02351866 (DF) and the Special Project “5 × 1000” Associazione Italiana per la Ricerca sul Cancro (AIRC, Milan, Italy) grant 9962 (FL). The funders had no role in study design, data collection and analysis, decision to publish, or preparation on the manuscript.
References
- Fridman WH, Pages F, Sautes-Fridman C, Galon J. The immune contexture in human tumours: Impact on clinical outcome. Nat Rev Cancer 2012; 12:298-306; PMID: 22419253; http://dx.doi.org/10.1038/nrc3245
- Galon J, Costes A, Sanchez-Cabo F, Kirilovsky A, Mlecnik B, Lagorce-Pages C, Tosolini M, Camus M, Berger A, Wind P et al. Type, density, and location of immune cells within human colorectal tumors predict clinical outcome. Science 2006; 313:1960-4; PMID: 17008531; http://dx.doi.org/313/5795/1960
- Galon J, Fridman WH, Pages F. The adaptive immunologic microenvironment in colorectal cancer: A novel perspective. Cancer Res 2007; 67:1883-6; PMID: 17332313; http://dx.doi.org/67/5/1883
- Pages F, Berger A, Camus M, Sanchez-Cabo F, Costes A, Molidor R, Mlecnik B, Kirilovsky A, Nilsson M, Damotte D et al. Effector memory T cells, early metastasis, and survival in colorectal cancer. N Engl J Med 2005; 353:2654-66; PMID: 16371631; http://dx.doi.org/353/25/2654
- Bates GJ, Fox SB, Han C, Leek RD, Garcia JF, Harris AL, Banham AH. Quantification of regulatory T cells enables the identification of high-risk breast cancer patients and those at risk of late relapse. J Clin Oncol 2006; 24:5373-80; PMID: 17135638; http://dx.doi.org/24/34/5373
- Gobert M, Treilleux I, Bendriss-Vermare N, Bachelot T, Goddard-Leon S, Arfi V, Biota C, Doffin AC, Durand I, Olive D et al. Regulatory T cells recruited through CCL22/CCR4 are selectively activated in lymphoid infiltrates surrounding primary breast tumors and lead to an adverse clinical outcome. Cancer Res 2009; 69:2000-9; PMID: 19244125; http://dx.doi.org/10.1158/0008-5472.CAN-08-2360
- Gao Q, Qiu SJ, Fan J, Zhou J, Wang XY, Xiao YS, Xu Y, Li YW, Tang ZY. Intratumoral balance of regulatory and cytotoxic T cells is associated with prognosis of hepatocellular carcinoma after resection. J Clin Oncol 2007; 25:2586-93; PMID: 17577038; http://dx.doi.org/25/18/2586
- Fu J, Xu D, Liu Z, Shi M, Zhao P, Fu B, Zhang Z, Yang H, Zhang H, Zhou C et al. Increased regulatory T cells correlate with CD8 T-cell impairment and poor survival in hepatocellular carcinoma patients. Gastroenterology 2007; 132:2328-39; PMID: 17570208; http://dx.doi.org/S0016-5085(07)00628-2
- Iwamoto T, Bianchini G, Booser D, Qi Y, Coutant C, Shiang CY, Santarpia L, Matsuoka J, Hortobagyi GN, Symmans WF et al. Gene pathways associated with prognosis and chemotherapy sensitivity in molecular subtypes of breast cancer. J Natl Cancer Inst 2011; 103:264-72; PMID: 21191116; http://dx.doi.org/10.1093/jnci/djq524
- Sotiriou C, Pusztai L. Gene-expression signatures in breast cancer. N Engl J Med 2009; 360:790-800; PMID: 19228622; http://dx.doi.org/10.1056/NEJMra0801289
- Halama N, Michel S, Kloor M, Zoernig I, Benner A, Spille A, Pommerencke T, von Knebel DM, Folprecht G, Luber B et al. Localization and density of immune cells in the invasive margin of human colorectal cancer liver metastases are prognostic for response to chemotherapy. Cancer Res 2011; 71:5670-7; PMID: 21846824; http://dx.doi.org/10.1158/0008-5472.CAN-11-0268
- Cheung NK, Dyer MA. Neuroblastoma: Developmental biology, cancer genomics and immunotherapy. Nat Rev Cancer 2013; 13:397-411; PMID: 23702928; http://dx.doi.org/10.1038/nrc3526
- Maris JM. Recent advances in neuroblastoma. N Engl J Med 2010; 362:2202-11; PMID: 20558371; http://dx.doi.org/10.1056/NEJMra0804577
- Yamamoto K, Hanada R, Kikuchi A, Ichikawa M, Aihara T, Oguma E, Moritani T, Shimanuki Y, Tanimura M, Hayashi Y. Spontaneous regression of localized neuroblastoma detected by mass screening. J Clin Oncol 1998; 16:1265-9; PMID: 9552024
- Bolande RP. A natural immune system in pregnancy serum lethal to human neuroblastoma cells: A possible mechanism of spontaneous regression. Perspect Pediatr Pathol 1992; 16:120-33; PMID: 1470503
- Martin RF, Beckwith JB. Lymphoid infiltrates in neuroblastomas: Their occurrence and prognostic significance. J Pediatr Surg 1968; 3:161-4; PMID: 5655566; http://dx.doi.org/10.1016/0022-3468(68)91005-1
- Lauder I, Aherne W. The significance of lymphocytic infiltration in neuroblastoma. Br J Cancer 1972; 26:321-30; PMID: 5071193; http://dx.doi.org/10.1038/bjc.1972.43
- Facchetti P, Prigione I, Ghiotto F, Tasso P, Garaventa A, Pistoia V. Functional and molecular characterization of tumour-infiltrating lymphocytes and clones thereof from a major-histocompatibility-complex-negative human tumour: Neuroblastoma. Cancer Immunol Immunother 1996; 42:170-8; PMID: 8640845; http://dx.doi.org/10.1007/s002620050267
- Carlson LM, De Geer A, Sveinbjornsson B, Orrego A, Martinsson T, Kogner P, Levitskaya J. The microenvironment of human neuroblastoma supports the activation of tumor-associated T lymphocytes. Oncoimmunology 2013; 2: e23618; PMID: 23802089; http://dx.doi.org/10.4161/onci.23618
- Maris JM. The biologic basis for neuroblastoma heterogeneity and risk stratification. Curr Opin Pediatr 2005; 17:7-13; PMID: 15659956; http://dx.doi.org/00008480-200502000-00004
- Brodeur GM, Pritchard J, Berthold F, Carlsen NL, Castel V, Castelberry RP, De Bernardi B, Evans AE, Favrot M, Hedborg F. Revisions of the international criteria for neuroblastoma diagnosis, staging, and response to treatment. J Clin Oncol 1993; 11:1466-77; PMID: 8336186
- Cho Y, Miyamoto M, Kato K, Fukunaga A, Shichinohe T, Kawarada Y, Hida Y, Oshikiri T, Kurokawa T, Suzuoki M et al. CD4+ and CD8+ T cells cooperate to improve prognosis of patients with esophageal squamous cell carcinoma. Cancer Res 2003; 63:1555-9; PMID: 12670904
- Zajac AJ, Murali-Krishna K, Blattman JN, Ahmed R. Therapeutic vaccination against chronic viral infection: The importance of cooperation between CD4+ and CD8+ T cells. Curr Opin Immunol 1998; 10:444-9; PMID: 9722921; http://dx.doi.org/S0952-7915(98)80119-2
- Whitmire JK, Ahmed R. Costimulation in antiviral immunity: Differential requirements for CD4(+) and CD8(+) T cell responses. Curr Opin Immunol 2000; 12:448-55; PMID: 10899032; http://dx.doi.org/S0952-7915(00)00119-9
- Bevan MJ. Helping the CD8(+) T-cell response. Nat Rev Immunol 2004; 4:595-602; PMID: 15286726; http://dx.doi.org/10.1038/nri1413
- Zhang N, Bevan MJ. CD8(+) T cells: Foot soldiers of the immune system. Immunity 2011; 35:161-8; PMID: 21867926; http://dx.doi.org/10.1016/j.immuni.2011.07.010
- Matloubian M, Concepcion RJ, Ahmed R. CD4+ T cells are required to sustain CD8+ cytotoxic T-cell responses during chronic viral infection. J Virol 1994; 68:8056-63; PMID: 7966595
- Marzo AL, Lake RA, Robinson BW, Scott B. T-cell receptor transgenic analysis of tumor-specific CD8 and CD4 responses in the eradication of solid tumors. Cancer Res 1999; 59:1071-9; PMID: 10070965
- Preston CC, Maurer MJ, Oberg AL, Visscher DW, Kalli KR, Hartmann LC, Goode EL, Knutson KL. The ratios of CD8+ T cells to CD4+CD25+ FOXP3+ and FOXP3- T cells correlate with poor clinical outcome in human serous ovarian cancer. PLoS One 2013; 8: e80063; PMID: 24244610; http://dx.doi.org/10.1371/journal.pone.0080063
- Hiraoka K, Miyamoto M, Cho Y, Suzuoki M, Oshikiri T, Nakakubo Y, Itoh T, Ohbuchi T, Kondo S, Katoh H. Concurrent infiltration by CD8+ T cells and CD4+ T cells is a favourable prognostic factor in non-small-cell lung carcinoma. Br J Cancer 2006; 94:275-80; PMID: 16421594; http://dx.doi.org/6602934
- Khan H, Pillarisetty VG, Katz SC. The prognostic value of liver tumor T cell infiltrates. J Surg Res 2014; 191:189-95; PMID: 25033707; http://dx.doi.org/10.1016/j.jss.2014.06.001
- Filosi M, Visintainer R, Riccadonna S, Jurman G, Furlanello C. Stability indicators in network reconstruction. PLoS One 2014; 9: e89815; PMID: 24587057; http://dx.doi.org/10.1371/journal.pone.0089815
- Squire R, Fowler CL, Brooks SP, Rich GA, Cooney DR. The relationship of class I MHC antigen expression to stage IV-S disease and survival in neuroblastoma. J Pediatr Surg 1990; 25:381-6; PMID: 2329454; http://dx.doi.org/0022-3468(90)90375-J
- Kataoka Y, Matsumura T, Yamamoto S, Sugimoto T, Sawada T. Distinct cytotoxicity against neuroblastoma cells of peripheral blood and tumor-infiltrating lymphocytes from patients with neuroblastoma. Cancer Lett 1993; 73:11-21; PMID: 8402593; http://dx.doi.org/0304-3835(93)90182-9
- Valteau D, Scott V, Carcelain G, Hartmann O, Escudier B, Hercend T, Triebel F. T-cell receptor repertoire in neuroblastoma patients. Cancer Res 1996; 56:362-9; PMID: 8542593
- Pena SV, Hanson DA, Carr BA, Goralski TJ, Krensky AM. Processing, subcellular localization, and function of 519 (granulysin), a human late T cell activation molecule with homology to small, lytic, granule proteins. J Immunol 1997; 158:2680-8; PMID: 9058801
- Nagasawa M, Kawamoto H, Tsuji Y, Mizutani S. Transient increase of serum granulysin in a stage IVs neuroblastoma patient during spontaneous regression: Case report. Int J Hematol 2005; 82:456-7; PMID: 16533752; http://dx.doi.org/51FW2MBQXVEEWYCT
- Lorenzi S, Forloni M, Cifaldi L, Antonucci C, Citti A, Boldrini R, Pezzullo M, Castellano A, Russo V, van der Bruggen P et al. IRF1 and NF-kB restore MHC class I-restricted tumor antigen processing and presentation to cytotoxic T cells in aggressive neuroblastoma. PLoS One 2012; 7: e46928; PMID: 23071666; http://dx.doi.org/10.1371/journal.pone.0046928
- Forloni M, Albini S, Limongi MZ, Cifaldi L, Boldrini R, Nicotra MR, Giannini G, Natali PG, Giacomini P, Fruci D. NF-kappaB, and not MYCN, regulates MHC class I and endoplasmic reticulum aminopeptidases in human neuroblastoma cells. Cancer Res 2010; 70:916-24; PMID: 20103633; http://dx.doi.org/10.1158/0008-5472.CAN-09-2582
- Raffaghello L, Prigione I, Bocca P, Morandi F, Camoriano M, Gambini C, Wang X, Ferrone S, Pistoia V. Multiple defects of the antigen-processing machinery components in human neuroblastoma: Immunotherapeutic implications. Oncogene 2005; 24:4634-44; PMID: 15897905; http://dx.doi.org/1208594
- Coughlin CM, Fleming MD, Carroll RG, Pawel BR, Hogarty MD, Shan X, Vance BA, Cohen JN, Jairaj S, Lord EM et al. Immunosurveillance and survivin-specific T-cell immunity in children with high-risk neuroblastoma. J Clin Oncol 2006; 24:5725-34; PMID: 17179106; http://dx.doi.org/24/36/5725
- Reid GS, Shan X, Coughlin CM, Lassoued W, Pawel BR, Wexler LH, Thiele CJ, Tsokos M, Pinkus JL, Pinkus GS et al. Interferon-gamma-dependent infiltration of human T cells into neuroblastoma tumors in vivo. Clin Cancer Res 2009; 15:6602-8; PMID: 19825945; http://dx.doi.org/10.1158/1078-0432.CCR-09-0829
- Zhou F. Molecular mechanisms of IFN-gamma to up-regulate MHC class I antigen processing and presentation. Int Rev Immunol 2009; 28:239-60; PMID: 19811323; http://dx.doi.org/10.1080/08830180902978120
- Lesinski GB, Zimmerer JM, Kreiner M, Trefry J, Bill MA, Young GS, Becknell B, Carson WE, 3rd. Modulation of SOCS protein expression influences the interferon responsiveness of human melanoma cells. BMC Cancer 2010; 10:142, 2407-10-142; PMID: 20398276; http://dx.doi.org/10.1186/1471-2407-10-142
- Motzer RJ, Escudier B, Oudard S, Hutson TE, Porta C, Bracarda S, Grunwald V, Thompson JA, Figlin RA, Hollaender N et al. Phase 3 trial of everolimus for metastatic renal cell carcinoma : Final results and analysis of prognostic factors. Cancer 2010; 116:4256-65; PMID: 20549832; http://dx.doi.org/10.1002/cncr.25219
- Hinrichs CS, Rosenberg SA. Exploiting the curative potential of adoptive T-cell therapy for cancer. Immunol Rev 2014; 257:56-71; PMID: 24329789; http://dx.doi.org/10.1111/imr.12132
- Emerson RO, Sherwood AM, Rieder MJ, Guenthoer J, Williamson DW, Carlson CS, Drescher CW, Tewari M, Bielas JH, Robins HS. High-throughput sequencing of T-cell receptors reveals a homogeneous repertoire of tumour-infiltrating lymphocytes in ovarian cancer. J Pathol 2013; 231:433-40; PMID: 24027095; http://dx.doi.org/10.1002/path.4260
- Gerlinger M, Quezada SA, Peggs KS, Furness AJ, Fisher R, Marafioti T, Shende VH, McGranahan N, Rowan AJ, Hazell S et al. Ultra-deep T cell receptor sequencing reveals the complexity and intratumour heterogeneity of T cell clones in renal cell carcinomas. J Pathol 2013; 231:424-32; PMID: 24122851; http://dx.doi.org/10.1002/path.4284
- Reissfelder C, Stamova S, Gossmann C, Braun M, Bonertz A, Walliczek U, Grimm M, Rahbari NN, Koch M, Saadati M et al. Tumor-specific cytotoxic T lymphocyte activity determines colorectal cancer patient prognosis. J Clin Invest 2015; 125:739-51; PMID: 25562322; http://dx.doi.org/10.1172/JCI74894
- Shimada H, Ambros IM, Dehner LP, Hata J, Joshi VV, Roald B, Stram DO, Gerbing RB, Lukens JN, Matthay KK et al. The international neuroblastoma pathology classification (the shimada system). Cancer 1999; 86:364-72; PMID: 10421273; http://dx.doi.org/10.1002/(SICI)1097-0142(19990715)86:23.0.CO;2-7
- Mathew P, Valentine MB, Bowman LC, Rowe ST, Nash MB, Valentine VA, Cohn SL, Castleberry RP, Brodeur GM, Look AT. Detection of MYCN gene amplification in neuroblastoma by fluorescence in situ hybridization: A pediatric oncology group study. Neoplasia 2001; 3:105-9; PMID: 11420745; http://dx.doi.org/10.1038/sj/neo/7900146
- Stam NJ, Spits H, Ploegh HL. Monoclonal antibodies raised against denatured HLA-B locus heavy chains permit biochemical characterization of certain HLA-C locus products. J Immunol 1986; 137:2299-306; PMID: 3760563
- Yuan Y, Failmezger H, Rueda OM, Ali HR, Graf S, Chin SF, Schwarz RF, Curtis C, Dunning MJ, Bardwell H et al. Quantitative image analysis of cellular heterogeneity in breast tumors complements genomic profiling. Sci Transl Med 2012; 4:157ra143; PMID: 23100629; http://dx.doi.org/10.1126/scitranslmed.3004330
- Ruifrok AC, Johnston DA. Quantification of histochemical staining by color deconvolution. Anal Quant Cytol Histol 2001; 23:291-9; PMID: 11531144
- Keane C, Gill D, Vari F, Cross D, Griffiths L, Gandhi M. CD4(+) tumor infiltrating lymphocytes are prognostic and independent of R-IPI in patients with DLBCL receiving R-CHOP chemo-immunotherapy. Am J Hematol 2013; 88:273-6; PMID: 23460351; http://dx.doi.org/10.1002/ajh.23398
- Seo J, Park JS, Nam JH, Bang D, Sohn S, Lee ES, Park KS. Association of CD94/NKG2A, CD94/NKG2C, and its ligand HLA-E polymorphisms with behcet's disease. Tissue Antigens 2007; 70:307-13; PMID: 17767552; http://dx.doi.org/TAN907
- Benaglia T, Chauveau D, Hunter DR, Young D. Mixtools: An R package for analyzing finite mixture models. J Statist Soft 2009; 32:1-29
- Matthews BW. Comparison of the predicted and observed secondary structure of T4 phage lysozyme. Biochim Biophys Acta 1975; 405:442-51; PMID: 1180967; http://dx.doi.org/10.1016/0005-2795(75)90109-9