
Abstract
Metastatic melanoma is a highly aggressive cancer that is very difficult to treat. Additionally, the antitumor immune reaction of melanoma is still unclear. Here we demonstrate an association between the expression and secretion of the antioxidant protein thioredoxin (TRX) and increasing tumor stage and metastasis in melanoma. To elucidate the role of TRX in melanoma, we assessed the correlation of TRX expression with different disease parameters in melanoma. We also examined the in vitro and in vivo effects of modulating TRX levels in melanoma cells using various methods of TRX depletion and augmentation. We further explored the effects of TRX on the cytokine milieu and the ability of TRX to regulate the proportion and specific activities of T-cell populations. We demonstrate that TRX expression correlates with Treg representation in clinical samples and, that modulation of TRX influences the induction of Tregs and the generation of an immunotolerant cytokine profile in mouse serum. Using a murine metastatic melanoma model, we identified a tumor immunoevasion mechanism whereby melanoma cell-secreted TRX enhances Treg infiltration. TRX displays chemotactic effects in recruiting Tregs, stimulates the conversion of conventional T cells to Tregs, and confers survival advantage to Tregs in the tumor microenvironment. In turn, this increase of Tregs generates immunotolerance in tissues and therefore decreases antitumor immune reactions. These results elucidate a mechanism by which TRX promotes metastatic melanoma in part through Treg recruitment to inhibit T-cell antitumor effects and suggest that TRX antibody may be useful in the clinic as a therapy against melanoma.
Introduction
The incidence of melanoma has risen faster than that of any other cancer over the past 4 decades, and it is now reaching epidemic proportions in Caucasian populations worldwide.Citation1 Late-stage metastatic disease is notoriously difficult to treat, resulting in the high mortality rate of melanoma. Hence, the 3-year overall survival of patients with unresectable melanoma is very poor.Citation2
Immunotherapy studies of melanoma patients have reported success in the expansion of tumor-specific effector T cells, but even in the presence of substantial numbers of circulating functional T cells favorable clinical outcomes are scarce.Citation1,3 Immunosuppression in the tumor microenvironment mediated by regulatory T cells (Tregs) is a dominant mechanism of tumor immune escape and presents a major hurdle for tumor immunotherapy.Citation4 Consequently, the depletion of Tregs may serve as a promising strategy to enhance melanoma-specific immunity. Indeed, murine studies have shown that Treg depletion increases the efficacy of immunotherapy. However, the successful depletion of Tregs in patients has not yet provided a major advance in improving overall clinical efficacy of immunotherapy,Citation5 perhaps due a lack of specificity in the available strategies for Treg depletion. Thus, a better understanding of the mechanism of Treg function and accumulation is critically needed.
Antioxidants act as electron donors that neutralize reactive oxygen species (ROS) and other free radicals that may otherwise damage DNA and promote tumorigenesis. Conventional wisdom supported by numerous cellular and preclinical studies holds that antioxidants protect against cancer. However, large randomized clinical trials have produced inconsistent results, with some studies indicating that antioxidants may actually increase cancer risk.Citation6 Thioredoxin (TRX) is a low molecular weight redox protein found in both prokaryotic and eukaryotic cells that participates in various redox reactions through the reversible oxidation of its active center dithiol to a disulfide, which catalyzes dithiol-disulfide exchange reactions.Citation7 TRX is over-expressed in many human cancers including lung, colon, cervical, gastric, and pancreatic cancer.Citation8 However, the role of TRX in melanoma is largely unknown. To elucidate the role of TRX in melanoma, we assessed the correlation of TRX expression with different disease parameters in melanoma. We also examined the in vitro and in vivo effects of modulating TRX levels in melanoma cells using various methods of TRX depletion and augmentation. We further explored the effects of TRX on the cytokine milieu and the ability of TRX to regulate the proportion and specific activities of T-cell populations. Our results suggest that the antioxidant TRX may have a specific role in cancer progression by creating an immunotolerant microenvironment and suppressing antitumor immune responses.
Results
TRX is overexpressed in human melanoma and is positively associated with metastasis
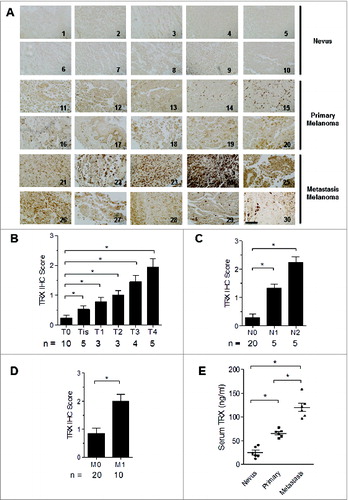
To examine the expression of TRX in human melanoma, we first performed immunohistochemistry of TRX using a tissue microarray containing 10 human primary melanoma samples, 10 human metastatic melanoma samples and 10 control nevus tissues (Table S1). Tissue staining was scored on the basis of the intensity of TRX labeling. TRX protein was weakly detected in most normal nevus tissues but was readily detectable in most primary melanoma and metastatic melanoma tissues (). The TRX staining score increased in a stage-dependent manner in melanoma, with T4 stage tissues having significantly higher scores than T0 stage tissues (). The TRX scores were also significantly higher in metastatic tumors compared to non-metastatic tumors (). Consistently, serum TRX levels were significant higher in metastatic melanoma patients than in both non-metastatic melanoma patients and control patients with nevi (). Further examination suggested that TRX is also expressed by human and murine melanoma cell lines (Fig. S1A) and can be detected in concentrated serum-free media from tumor cell lines by ELISA and Western blotting (Fig. S1B and 1C). These results suggest that TRX expression is correlated with melanoma stage and that human and mouse melanoma cells express and secrete TRX protein into the tumor microenvironment.
Figure 1. TRX is highly expressed in human melanoma and positive related to tumor progression. (A) Immunohistochemistry (IHC) staining of thioredoxin (TRX) in human melanoma samples and control nevus. 1–10: nevus, 11–20: primary melanoma, 21–30: metastasis melanoma. Scale bar, 100 μm. (B-D) Histogram graph showing the quantitative evaluation of TRX staining intensity from . Statistical analysis was performed by Student's t-test; *P < 0.05. T-Primary tumor, T0-No evidence of primary tumor, Tis-Carcinoma in situ; intraepithelial or invasion of lamina propria, T1-Tumor invades submucosa, T2-Tumor invades muscularis propria, T3-Tumor invades through muscularis propria into subserosa or into non-peritonealized pericolic or perirectal tissues, T4-Tumor directly invades other organs or structures and/or perforates visceral peritoneum. N-Regional lymph nodes, N0-No regional lymph node metastasis, N1-Metastasis in 1 to 3 regional lymph nodes, N2-Metastasis in 4 or more regional lymph nodes. M-Distant metastasis, M0-No distant metastasis, M1-Distant metastasis. (E) Relative serum TRX protein levels from nevus, primary melanoma and metastatic melanoma patient groups as determined by ELISA. Statistical analysis was performed by Student's t-test; *P < 0.05.
TRX generates an immunotolerant tumor microenvironment via Treg recruitment
To investigate the possibility that secretion of TRX may confer immune privilege to melanoma cells, we transfected mouse B16 melanoma cells with TRX plasmid (overexpression, OE) or TRX shRNA plasmid (knockdown, KD). We then selected representative clones according to TRX expression levels (). ELISA analysis of supernatants verified the altered levels of TRX secretion in the corresponding cell lines (). Furthermore, 25 to 30 d after tail vein injection of 5 × 10⁶ B16 cells into C57/B6J mice, the serum TRX protein levels were elevated in mice bearing OE cells and reduced in mice bearing KD cells as compared to mice bearing mock-transfected cells (Mock) (). These results validate the use of the OE and KD B16 melanoma cells as a stable model for assessing the effects of TRX modulation in mice. The growth of the tumors correlated with TRX expression levels such that the tumors were larger in OE mice and smaller in KD mice relative to the mock controls (). Representative images of lungs with melanoma metastatic lesions from each group are shown in . To investigate the antitumor immune responses in each group, tumor-bearing mice were sacrificed at day 30, and serum was collected for ELISA analysis. The OE mice had reduced levels of the pro-inflammatory mediator interferon γ (IFNγ), indicating a weak inflammatory response of OE mice relative to the mock control mice, while the KD mice displayed the converse pattern (). Moreover, levels of the anti-inflammatory mediators interleukin 10 (IL-10; () and transforming growth factor β (TGFβ; ) were significantly higher in sera from OE mice and lower in sera from KD mice as compared to sera from mock control mice. These findings suggest that TRX mediates a shift to a less inflammatory tumor microenvironment.
Figure 2. TRX levels correlate with the Treg number in the tumor microenvironment to inhibit T-cell response. (A) Western bolt analysis of thioredoxin (TRX) protein level in B16 cells transfected with empty vector (Mock) or pcDNA3.1-TRX overexpression (OE) or TRX shRNA knockdown (KD). (B) ELISA analysis of TRX protein level in serum-free conditioned medium from transfected B16 cells cultured 24 h. (C) ELISA analysis of serum TRX protein level in blood sera of B16 tumor-bearing mice. (D) Metastatic tumor size in lung from B16 cell tumor-bearing mice (n = 6). (E) Representative image of lung metastases from B16 tumor bearing mice at day 30. (F-H) ELISA analysis of serum interferon γ (IFNγ), interleukin 10 (IL10) and transforming growth factor β (TGFβ) protein levels from tumor-bearing mice (n = 6) 20 d after B16 cell injection. (I) Transfected B16 cells were injected into C57/B6 mice for 3 weeks then tumor-infiltrating regulatory T cell (Treg) numbers per 200 mg tumor sample were calculated in tumor-bearing mice (n = 6) by immunofluorescence staining and cytofluorimetric analysis. Statistical analysis was performed by Student's t-test; *P < 0.05.
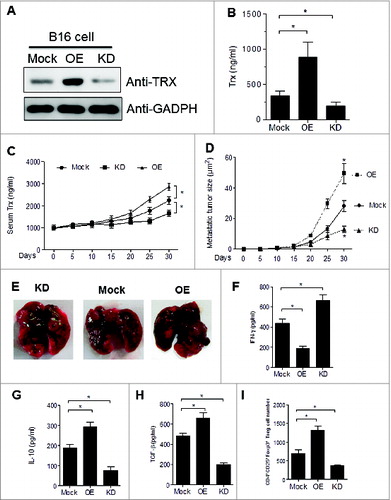
To test the hypothesis that whether TRX mediates a corresponding shift in the balance of Tregs, we performed FACS analysis of tumor-infiltrating lymphocytes from mice bearing mock, OE or KD tumors (Fig. S2). The number of CD4+CD25+ Foxp3+ Tregs were increased in the tumors of OE mice and reduced in those of KD mice (). These results further verify that TRX mediates the establishment of an immunotolerant tumor microenvironment.
CD4+CD25+FOXP3+ Tregs are enriched in the melanoma patient tumor microenvironment correlating with TRX levels
Given that tumor specimens from melanoma patients express high levels of TRX, we postulated that Tregs may also be enriched in the melanoma environment. To test this hypothesis, we collected clinical specimens from melanoma patients at various stages as well as control nevi samples. A small population of cells stained positive for both CD25 and FOXP3 as assessed by immunofluorescence staining and FACS analysis (). Furthermore, CD4+CD25+FOXP3+ Tregs were observed in all melanoma cases, but were hardly detected in control nevus samples, and the number of Tregs was greater for metastatic tumors than for primary tumors (). Among the melanoma samples, the CD4+CD25+FOXP3+ Treg number increased in a stage-dependent manner (). Significantly, the number of infiltrating Tregs was positively correlated with the immunohistochemistry score of TRX in the human melanoma samples tested in this study (). These results provide clinical evidence to support the role of TRX in determining the number of Tregs in the melanoma microenvironment.
Figure 3. Tregs are enriched in the melanoma microenvironment. (A) Cells from melanoma (and nevi control) patient samples immunostained for CD25 and FOXP3 and analyzed by cytofluorimetric analysis. (B) FACS analysis of CD4+CD25+FOXP3+ Treg cell numbers in melanoma patient tumor samples and control nevus. (C-D) FACS analysis of CD4+CD25+FOXP3+ Treg cell numbers in different stage of melanoma samples. N0-No regional lymph node metastasis, N1-Metastasis in 1 to 3 regional lymph nodes, N2-Metastasis in 4 or more regional lymph nodes. M-Distant metastasis, M0-No distant metastasis, M1-Distant metastasis. (E) Correlation analysis between TRX immunohistochemistry (IHC) score and the number of infiltrating Tregs in human melanoma samples and control nevus samples. Statistical analysis was performed by Student's t-test; *P < 0.05.
Chemotactic effect of TRX on Tregs in vitro and in vivo
To understand the potential mechanism of TRX in promoting Treg accumulation in melanoma in situ, we test the chemotactic effect of TRX on Treg migration in vitro. Purified Tregs were much more highly attracted to melanoma B16 cell conditioned medium (CM) compared to standard medium (control) (). Moreover, the migration of Tregs was significantly enhanced when a reduced form of TRX (rTRX) was added to the CM ( and Fig. S3). However, when a neutralizing antibody to TRX was added in the CM, the Treg migration rate was notably reduced (). These results suggest that TRX serves as a chemoattractant of Tregs.
Figure 4. Chemotactic effect of TRX on Tregs in vitro and in vivo. (A) Regulatory T cell (Treg) migratory capacity toward control 3T3 cell or B16 cell conditioned medium (CM) by transwell assay for 2, 4, 8 h. (B) Treg migration toward CM from B16 cells upon addition of 1–20 ng/mL TRX for 8 h. (C) Treg migration toward CM from B16 cells when 1 mg/mL anti–TRX or a control lgG antibody was added in the medium for 8 h. (D) Treg cell number in the local tumor upon injection with 500 ng/mL TRX as determined by immunofluorescence staining and cytofluorimetric analysis (n = 5). (E) Treg cell number in the local tumor upon injection with 5 mg/mL anti–TRX antibody or a control lgG antibody for 4 h as determined by immunofluorescence staining and cytofluorimetric analysis (n = 5). (F) Cell migration index analysis of Treg cells isolated from B16 tumor bearing mice (n = 5). Mock = B16 transfected with empty vector, OE = B16 transfected pcDNA3.1-TRX, KD = B16 transfected with TRX shRNA vector. Statistical analysis was performed by Student's t-test; *P < 0.05.
To verify these observations in an in vivo model, we tested the effects on B16 melanoma migration in B16 tumor-bearing mice. When TRX protein was tail vein injected into tumors for up to 8 h, the number of Treg cells at the tumor site was markedly increased (). In contrast, when TRX antibody was tail injected, the number of tumor-infiltrating Tregs was reduced relative to control lgG-injected mice (). To further verify the findings, we repeated migration assays for Tregs isolated from TRX overexpressing (OE) and TRX knockdown (KD) B16 tumor-bearing mice. The migration activity was much higher in the OE group compared to the mock and KD groups (). These results verify that when administered in vivo, TRX increases the migration activity of Tregs.
TRX induces conversion from conventional T cells (Teffs) to Tregs in vitro
Secondly, as an additional potential mechanism of increasing Treg levels, we tested whether TRX may mediate the conversion of conventional CD4+CD25− effector T (Teff) cells to CD4+CD25+Foxp3+ Tregs. CD4+CD25− Teff cells cultured for 4 d in regular conditioned medium (CM) from B16 melanoma cells displayed an increase in both the number of CD4+CD25+Foxp3+ T cells () and the ratio of CD4+CD25+Foxp3+ cells (). As a confirmation of the Treg phenotype, ELISA analysis demonstrated that these converted T cells secreted more IL-10 and TGFβ and less IFNγ (). Moreover, the addition of rTRX into the CM significantly accelerated the increase of CD4+CD25+Foxp3+ cells after treatment ( and Fig. S4), whereas the addition of TRX antibody had the opposite effect (). These results suggest that TRX may further increase the Treg population by inducing Teff to Treg conversion.
Figure 5. TRX induces conversion from conventional T cells (Teff) to Treg. (A) Immunofluorescence staining and cytofluorimetric analysis to determine the number of CD4+CD25+ Foxp3+T cells arising upon culture of isolated CD4+CD25− T cells with B16 cell conditioned media (CM) in the presence of anti-CD3/CD28 antibodies and 500 U/mL interleukin (IL)-2 for 1–4 d. (B) FACS analysis of CD4+CD25+Foxp3+ and CD4+CD25− Foxp3− T cell ratio when cultured with B16 cell CM in the presence of anti-CD3/CD28 antibodies and 500 U/mL IL-2 for 1–4 d. (C) ELISA measurement of interferon γ (IFNγ), IL-10 and transforming growth factor β (TGFβ) protein levels secreted by isolated CD4+CD25− T cells cultured with B16 cell CM for 4 d. (D) Ratio of Tregs arising in isolated CD4+CD25− T cells cultured with B16 cell CM in the presence of reduced thioredoxin (rTRX) as determined by FACS (n = 3). (E) Ratio of Tregs arising from isolated CD4+CD25− T cells cultured with B16 cell CM in the presence of 1 mg/mL anti-TRX antibody or control lgG antibody (n = 3).
TRX confers enhanced tolerance of Tregs to oxidative stress in melanoma
To assess the ability of TRX-induced Tregs to tolerate environmental stress, we measured the content of reactive oxygen species (ROS) in tumor interstitial fluid from B16 tumor-bearing mice. The tumor interstitial fluid accumulated ROS (), which confirms that B16 tumor produces an environment of oxidative stress. To further examine the physiological effects of the oxidative environment, we exposed freshly isolated Tregs and Teff cells to interstitial fluid. Our results show that Tregs are more resilient than Teffs to cell apoptosis induced by tumor interstitial fluid (). Moreover, rTRX significantly lowered the Treg apoptosis rate ( and Fig. S5), whereas TRX neutralizing antibody had the reverse effect ().
Figure 6. TRX confers Treg enhanced tolerance to oxidative stress in melanoma. (A) Reactive oxygen species (ROS) level in B16 tumor-bearing mice tumor interstitial fluid (n = 3) determined by Acridan Lumigen PS-3 reagent. (B) Cell apoptosis was determined by propidium iodide (PI) and AnnexinV staining and cytofluorimetric analysis of freshly isolated regulatory T cell (Tregs) and effector T (Teff) cells cultured in the presence of tumor interstitial fluid (n = 3). (C-D) Cell apoptosis (PI and AnnexinV staining) of freshly isolated Tregs cultured in the presence of tumor interstitial fluid plus either (C) 10 ng/mL reduced thioredoxin (rTRX; n = 3) or (D) 1 mg/mL anti-TRX antibody (n = 3). (E) FACS analysis of Teff and Treg apoptosis in isolated cells from B16 tumor-bearing mice per 200 mg tumor sample (n = 5). (F) FACS analysis of Treg apoptosis in isolated cells from TRX-overexpressing (OE) and TRX knockdown (KD) B16 tumor-bearing mice per 200 mg tumor sample (n = 5). Statistical analysis was performed by Student's t-test; *P < 0.05.
To test the effect of TRX on cell apoptosis in vivo, we assessed the levels of Teff and Treg cell apoptosis in B16 tumor-bearing mice. FACS data suggest that Teff cell apoptosis increased significantly and Treg cell apoptosis increased slightly in tumor-bearing mice over time (). Furthermore, the apoptosis rate of Tregs was much lower in mice bearing TRX-overexpressing B16 tumor (OE) and much higher in mice bearing TRX knockdown B16 tumor (KD) (). These results verify that TRX confers enhanced tolerance of Tregs to oxidative stress.
Therapeutic effect of TRX antibody on metastatic melanoma
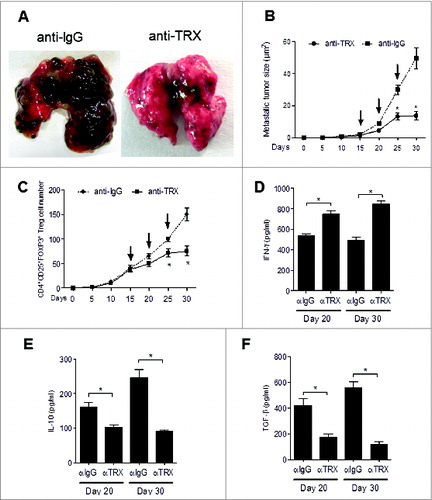
Next, to examine the potential therapeutic effect of inhibiting TRX in the metastatic melanoma mouse model we exposed B16-injected mice to anti-TRX antibody. The melanoma lung metastatic burden was clearly decreased when TRX was blocked by antibody (). Additionally, the average size of the metastatic tumors in the lungs was significantly decreased for mice treated with anti-TRX antibody compared with control lgG (). As expected, the Treg cell number also decreased in lung lesions after anti-TRX antibody treatment (). Furthermore, serum IFNγ levels increased and serum IL-10 and TGFβ levels decreased after TRX blockade at day 20 and day 30 (), and the Treg migration index and Treg conversion incidence decreased after anti-TRX antibody treatment (Fig. S6A and B), whereas the apoptosis rate of Tregs increased after anti-TRX antibody treatment (Fig. S6C). Collectively, these data support a model whereby TRX benefits intratumoral Treg accumulation by inducing chemotaxis, conversion and survival under oxidative stress (Fig. S7).
Figure 7. Therapeutic effect of anti-TRX antibody on metastatic melanoma. (A) Representative image of lung metastases from B16 tumor-bearing mice after tail vein injection of anti-lgG antibody or anti-TRX antibody at day 30. (B) Metastatic tumor size in lung from B16 tumor bearing mice (n = 5) after tail vein injection of anti-lgG antibody or anti-TRX antibody (arrows, at day 15, 20, 25). (C) Treg cell numbers were calculated from 200 mg mouse metastatic lung tissue from B16 tumor bearing mice (n = 5) after tail vein injection of anti-lgG antibody or anti-TRX antibody (at day 15, 20, 25) by immunofluorescence staining and cytofluorimetric analysis. (D-F) ELISA analysis of serum interferon γ (IFNγ), interleukin 10 (IL10) and transforming growth factor β (TGFβ) protein levels in B16 tumor-bearing mice (n = 5) after tail vein injection of anti-lgG (αlgG) antibody or anti-TRX antibody (αTRX) at day 20 or day 30. Statistical analysis was performed by Student's t-test; *P < 0.05.
Discussion
Antioxidants have emerged as regulatory molecules that control fundamental biological processes. TRX is one such antioxidant that is involved in multiple key intracellular and extracellular processes, including redox regulation of gene expression and signal transduction, protection against oxidative stress, anti-apoptotic functions, growth factor and co-cytokine effects, and regulation of the redox state in the extracellular environment.Citation9 TRX has also been linked to the development and expression of tumor phenotypes.Citation10-13 In vivo expression analyses of breast, lung and colorectal cancer support the conclusion that aggressive tumors robustly over-express TRX.Citation14 Such tumors are associated with a high proliferative capacity, a low rate of apoptosis and an elevated metastatic potential, strongly implicating TRX in the processes of oncogenesis and tumorigenesis, and further, providing rationale to target TRX for anticancer therapy against a wide range of human tumors.Citation14 In the current study, we extensively investigated the function of TRX in the tumor microenvironment as a mechanism to explain its tumorigenic effects in melanoma. Our results demonstrate that TRX induces Tregs to generate an immunotolerant tumor microenvironment in metastatic melanoma.
Research studies and clinical trials have shown that melanoma immunological therapeutics are successful in a subset of patients.Citation15-21 However, only a minor fraction of patients have exhibited immune responses against this particular malignancy. CD25+CD4+FOXP3+ Tregs are physiologically present in the immune system and are actively engaged in the maintenance of immunological self-tolerance by suppressing reactive T cells.Citation22,23 Tregs hamper effective antitumor immune responses in cancer patients and can serve as a cellular target to evoke or augment antitumor immunity.Citation24 Preliminary work showed that tumor hypoxia promotes the recruitment of Tregs through induction of expression of the chemokine CCL28, which, in turn, promotes tumor tolerance and angiogenesis.Citation25 Another study suggested that CCR4 antagonists, an emergent class of Treg inhibitor, block recruitment of Tregs mediated by the chemokines CCL22 and CCL17.Citation26 In this study we found that TRX induces an immunosuppressive microenvironment in melanoma resulting in an abundance of Tregs. As a likely mechanism by which Tregs become abundant in tumor tissues, tumor cells produce TRX, which chemo-attracts and recruits Tregs to the lesion. This mechanism of TRX is similar to that of CXCL12,Citation27 which is secreted by ovarian cancer cells in the tumor microenvironment and induces selective migration of Tregs. We also found that TRX has a TGFβ-like effect on Teff cells in stimulating the conversion of conventional T cells to Tregs.Citation28 Finally, we demonstrated that a survival advantage accompanied by tumor-infiltrating Tregs occurs when TRX is abundant in the tumor microenvironment. Thus, these different mechanisms of TRX are likely to function together to create a tumor-permissive environment under the direction of Tregs (Fig. S7).
One limitation of our study is that we focused on the impact of TRX on the tumor microenvironment but we have no data regarding TRX function on tumor cells. In previous studies, antioxidants have been shown to provide protective effects against chemically-induced lung cancer, and it is possible that high amounts of ROS are required for tumor development.Citation29 However, experimental studies and large clinical trials quite convincingly suggest that certain antioxidants, including carotenes, vitamins, and NAC, are contraindicated for the prevention of lung cancer, with their use associated instead with tumor growth.Citation30 Importantly, our work suggests that the antioxidant factor TRX induces Tregs to generate an immunotolerant tumor microenvironment to promote melanoma metastasis. Thus TRX provides an attractive target for therapy based on multiple criteria, and its association with tumor progression in human melanoma suggests that it might serve as an effective serum biomarker for selecting patients for immunotherapy in the future.
Materials and Methods
Patient material
The melanoma tissue microarray (contains 10 cases of primary melanoma, 10 case of malignant melanoma and 10 cases of nevi, respectively; US Biomax Inc.., Rockville, MD) was used to assess potential differences in TRX and FOXP3 expression between samples. Melanoma biopsies and serum were obtained from patients with informed consent. All the study was approved by the institutional review board of The First affiliated Hospital of Jinan University, Guangzhou, China.
Animals
All animal work was approved by the appropriate Ethics and Animal Care and Use Committee of Jinan University, Guangzhou, China. 8-week-old C57BL/6 mice were obtained from the Vital River Laboratories experimental animal technical Co., LTD (Beijing, China). Mice were kept in a 12-hour light/dark cycle with food and water. All efforts were made to minimize animal suffering. To establish a melanoma metastasis model, 5 × 10⁵ B16-F10 cells were tail vein injected into C57/B6J mice. After 15 d, mice were sacrificed, their lungs excised and the number of metastases on the lung surface counted. For antibody treatment, at day 15 following tumor cell injection mice were administered 200 μg anti-TRX antibody (clone C63C6, Cell Signaling Technology, USA) or IgG control intravenously. For each of assays, results are expressed as mean ± standard error of mean (SEM).
Cell culture, transfection and stable cell line generation
B16-F10 and A375 cells were purchased from American Type Culture Collection (ATCC) and cultured in Dulbecco's modified essential medium (DMEM) containing 10% FBS. Cells were incubated at 37°C and maintained at 5% CO2. Prior to transfection, B16-F10 cells were seeded in 25 cm2 culture dishes. After 24 h, the cells were transfected with pcDNA3.1-eGFP-TRX vector or pcDNA3.1-eGFP-TRX-shRNA vector using Lipofectamine 3000 (Invitrogen, Carlsbad, CA) following manufacturer's instructions. The cells were then selected in DMEM at selected with 800 μg/mL G418 for a week before being screened by flow cytometry for GFP expression. GFP positive cells was isolated and selected in DMEM with 200 μg/mL G418 for months until clone formation. Monoclonal populations were selected by limiting serial dilution and gene stability was verified for at least 5 passages. After selection, stable cell lines were screened by TRX Western blot analysis.
Treg isolation from tumor and FACS analyses
Tregs were isolated by Dynabeads FlowComp Mouse CD4+CD25+ Treg Cells Kit (Invitrogen) following manufacturer's instructions. Briefly, after removal of fat, blood, or necrotic areas, tumor tissues were washed in RPMI 1640 containing 50 μg/mL gentamicin (Invitrogen) and cut into 0.5 mm3 pieces in a Petri dish while covered with RPMI 1640 plus antibiotics. Tumor fragments were transferred to flasks and dissociated using 0.05% collagenase (Type IV; Sigma) and 0.02% DNase (Type I; Sigma) in the same medium supplemented with 5% (v/v) fetal bovine serum (Invitrogen). The digest was passed through 90 μm and 50 μm nylon mesh to remove clumps, and the filtrate was washed 2 to 3 times in medium followed by centrifugation at 400 g for 10 min. To separate tumor cells from T lymphocytes, the cell suspension was layered onto a discontinuous Ficoll-Paque gradient of 75% over 100% Ficoll-Paque in medium and centrifuged for 800 g for 20 min at room temperature. Immunofluorescence staining was performed using anti-CD4, anti-FoxP3 and anti-CD25 antibodies. The analysis and sort gates were restricted to the small lymphocyte gate as determined by their characteristic forward and side scatter properties. Cytofluorimetric analysis and cell sorting was performed using an EPICS XL flow cytometer (Beckman Coulter).
Monoclonal antibodies to CD4 (clone L3T4, 1: 100 dilution), CD25 (clone 7D4, 1: 100 dilution) and Foxp3 (clone MF23, 1: 100 dilution) were purchased from BD Pharmingen (San Jose, CA). FACS analysis was performed by using FACSCalibur and LSR II flow cytometers (Becton Dickinson, Palo Alto, CA) and were analyzed with FlowJo software. For flow cytometric analysis of CD4+CD25+Foxp3+ subsets, cell populations were stained with antibodies against the indicated markers, followed by permeabilization in Fix/Perm buffer, and intracellular staining in Perm/Wash buffer (BD Pharmingen).
Immunohistochemistry
The slides were equilibrated in PBS prior to blocking peroxidase activity with Peroxidase Suppressor (Thermo Scientific). Non-specific antibody binding was blocked by incubating sections with 2.5% horse serum (Invitrogen, Carlsbad, CA). TRX was detected using rabbit anti-TRX (CST, C63C6, 1:100 dilution, USA). Followed by anti-rat Immpress and visualized using the 3,3′-Diaminobenzidine kit (Sigma-Aldrich, St. Louis, MO, USA). The scoring for each marker was undertaken by an experienced histopathologist who was blinded to results of other markers or case identity. All the slides were imaged on an Aperio Scanscope CS imager, generating 0.4-μm/pixel whole slide images. These images were compiled and analyzed using the Aperio Spectrum software with a pixel count algorithm.
Cell migration assay
To measure the cell migration activity, Transwell assays were done using a modified Boyden chamber (tissue culture treated, 6.5 mm in diameter, 10-μm thick, 8-μm pores; Transwell, Costar, Cambridge, MA). The lower surface of filters was coated with 10 μg/mL collagen. Tregs suspended in serum-free RPMI 1640 containing 0.1% bovine serum albumin were applied to the upper chamber and B16 tumor cell supernatants were added to the lower chamber. Antibody against TRX and control IgG were obtained from CST Company and the recombinant mouse TRX was obtained from Sino Biological lnc. The chambers were incubated at 37°C for 4 h and then fixed and stained. The cells on the lower surface of the filter were counted (2 fields/well) under a microscope using a 10X objective. Each condition was assayed in triplicate, and each experiment was repeated at least 3 times.
Cell apoptosis assessment
Cell apoptosis was detected by the percentage of propidium iodide (PI) and AnnexinV positive cells. Briefly, before induction of apoptosis, cells were plated with an initial cell number of 2 × 10⁵/mL in 6-well plates in RPMI containing 10% fetal bovine serum and incubated 24 h. The cells were then collected by centrifugation, fixed, and permeabilized in 70% cold ethanol and incubated at −20°C overnight. Samples were washed with cold PBS and incubated with the DNA-binding dye PI (5 μg/mL) at room temperature 30 min before analysis. Apoptosis was also evaluated by the binding of fluorescein isothiocyanate (FITC) conjugated Annexin V to phosphatidylserine exposed on the cell surface, according to the manufacturer's instruction. Moreover, a “supravital” PI staining assay was also done (exposure of unfixed cells to PI) together with Annexin V staining to simultaneously detect living, apoptotic, and necrotic cells. Fluorescence resulting from FITC and PI was measured at 530 and 620 nm, respectively. All the samples were analyzed by EPICS XL flow cytometer (Beckman) equipped with dedicated software. Histograms were then analyzed with EXPO software.
Quantitative reverse transcription-polymerase chain reaction (qRT-PCR) analysis
Total RNA was isolated with TRIzol and further purified with the RNeasy Mini kit (Qiagen Ltd., Germany) in accordance with the manufacturer's instructions. The A260/A280 ratio of total RNA used was typically ≥1.8, and its quality was assessed using the Agilent 2100 Bioanalyzer. qRT-PCR analyses for Foxp3 were performed by using One Step SYBR®PrimeScript™ RT-PCR Kit II following manufacturer's instructions. (Takara, Ohtsu, Japan). Primers used for this study have been previously reportedCitation31 The results were analyzed by using AB7700 system software. The level of 18S rRNA was used as an internal standard.
In vitro Treg suppression assay
The Treg suppression assay was evaluated by cell proliferation, measured by [3H]-thymidine incorporation. Briefly, for anti-CD3 stimulated cultures, 50,000 freshly isolated Teff cells (used as responder cells), 0.5 mg/mL anti-CD3 and anti-CD28, and up to 10,000 expanded Tregs were put in 96-well plates in triplicate. Then one μCi 3 H thymidine was added for the last 24 h of a 6 d culture. Percentage of suppression was calculated according to: 100 × [1 − (CPM of Treg culture/CPM of non-Treg culture)].
Enzyme-linked immunosorbent assay (ELISA)
IL-10, TGFβ and IFNγ secretion was determined using an ELISA kit (eBioscience, North America) following the manufacturer's instructions. The concentration of TRX in culture supernatants and serum were determined using a TRX ELISA kit (Cloud-Clone Corp, USA) according to the manufacturer's instructions. Briefly, each well of flat-bottom 96-well microtiter plates was coated with fusion protein in 0.1 M carbonate buffer, pH 9.6 for 18 h at 4°C, washed 3 times with PBS containing 0.05% (v/v) Tween-20 (Bio-Rad Laboratories, Hercules, CA), pH 7.2 (PBS-T). Each well was blocked with 200 μl of PBS containing 2% (w/v) BSA (Sigma) for 1 h at room temperature, and washed 3 times with PBST. Sample supernatants (100 μL) were added, the plates incubated for 2 h at room temperature, and then washed 3 times. One hundred microliters of horseradish peroxidase (HRP)-conjugated goat anti-mouse IgG (H+L; Sigma) diluted in PBS-0.1% BSA (dilution 1:2000) was added and incubated for 1 h at room temperature. The plates were washed 3 times, then 100 μL of 0.01% (w/v) 3,3′, 5,5′-tetramethylbenzidine dihydrochloride (Sigma) in 0.05 M phosphate-citrate buffer, pH 5.0 was added for 15 min, and the reaction was stopped with 50 μL of 2 N sulfuric acid. Color changes were monitored by automated microtiter plate reader (Bio-Rad) at 450 nm absorbance.
Reactive Oxygen Species detection
ROS Reactive Oxygen Species in B16 cell-bearing mice tumor interstitial fluid was determined by Acridan Lumigen PS-3 reagent as previously reported.Citation32 Briefly, to measure ROS in the medium, the Acridan Lumigen PS-3 assay was developed in a 96-well plate format using the Acridan Lumigen PS-3 reagent, provided as a chemiluminescent substrate for HRP (in the Amersham ECL Plus kit, GE Healthcare). For the purpose of measuring ROS in the culture media, we mixed Reagent A (H2O2 in Tris buffer, Amersham ECL Plus kit, GE Healthcare) and Reagent B (acridan solution in dioxane and ethanol, Amersham ECL Plus kit, GE Healthcare) in a 40:1 ratio; this mixture was named the ALPS-3 substrate.
Statistical analysis
All the results are expressed as mean ± standard error of mean (SEM). Statistical differences among groups were analyzed by one-way analysis of variance (ANOVA) with a post-hoc test (after normalization to baseline in the OVX study and the hindlimb -unloading study) to determine group differences in the study parameters. All statistical analyses were performed with SPSS software, version 13.0. The statistical differences between the 2 groups were determined by the Student's t-test. P < 0.05 was considered statistically significant.
Disclosure of Potential Conflicts of Interest
No potential conflicts of interest were disclosed.
Supplemental Material
Supplemental data for this article can be accessed on the publisher's website.
supplemental_figures.zip
Download Zip (633.5 KB)Funding
This work was supported by The Fundamental Research Funds for the Central Universities (21614608), National Natural Science Foundation Projects (31000386, 81370971, 31101251 and 81300908) and Guangdong Natural Science Funds for Distinguished Young Scholar (S2013050013880).
References
- Umansky V, Sevko A. Melanoma-induced immunosuppression and its neutralization. Semin Cancer Biol 2012; 22:319–26; PMID:22349515; http://dx.doi.org/10.1016/j.semcancer.2012.02.003
- Tsao H, Chin L, Garraway LA, Fisher DE. Melanoma: from mutations to medicine. Genes Dev 2012; 26:1131-55; PMID:22661227; http://dx.doi.org/10.1101/gad.191999.112
- Zeiser R, Schnitzler M, Andrlova H, Hellige T, Meiss F. Immunotherapy for malignant melanoma. Curr Stem Cell Res Ther 2012; 7:217-28; PMID:22329580; http://dx.doi.org/10.2174/157488812799859883
- Facciabene A, Motz GT, Coukos G. T-regulatory cells: key players in tumor immune escape and angiogenesis. Cancer Res 2012; 72:2162-71; PMID:22549946; http://dx.doi.org/10.1158/0008-5472.CAN-11-3687
- Jacobs JF, Nierkens S, Figdor CG, de Vries IJ, Adema GJ. Regulatory T cells in melanoma: the final hurdle towards effective immunotherapy. Lancet Oncol 2012; 13:e32-42; PMID:22225723; http://dx.doi.org/10.1016/S1470-2045(11)70155-3
- Policastro LL, Ibanez IL, Notcovich C, Duran HA, Podhajcer OL. The tumor microenvironment: characterization, redox considerations, and novel approaches for reactive oxygen species-targeted gene therapy. Antioxid Redox Signal 2013; 19:854-95; PMID:22794113; http://dx.doi.org/10.1089/ars.2011.4367
- Lee S, Kim SM, Lee RT. Thioredoxin and thioredoxin target proteins: from molecular mechanisms to functional significance. Antioxid Redox Signal 2013; 18:1165-207; PMID:22607099; http://dx.doi.org/10.1089/ars.2011.4322
- Powis G, Kirkpatrick DL. Thioredoxin signaling as a target for cancer therapy. Curr Opin Pharmacol 2007; 7:392-7; PMID:17611157; http://dx.doi.org/10.1016/j.coph.2007.04.003
- Mahmood DF, Abderrazak A, El HK, Simmet T, Rouis M. The thioredoxin system as a therapeutic target in human health and disease. Antioxid Redox Signal 2013; 19:1266-303; PMID:23244617; http://dx.doi.org/10.1089/ars.2012.4757
- Kakolyris S, Giatromanolaki A, Koukourakis M, Powis G, Souglakos J, Sivridis E, Georgoulias V, Gatter KC, Harris AL. Thioredoxin expression is associated with lymph node status and prognosis in early operable non-small cell lung cancer. Clin Cancer Res 2001; 7:3087-91; PMID:11595699
- Raffel J, Bhattacharyya AK, Gallegos A, Cui H, Einspahr JG, Alberts DS, Powis G. Increased expression of thioredoxin-1 in human colorectal cancer is associated with decreased patient survival. J Lab Clin Med 2003; 142:46-51; PMID:12878985; http://dx.doi.org/10.1016/S0022-2143(03)00068-4
- Kim SJ, Miyoshi Y, Taguchi T, Tamaki Y, Nakamura H, Yodoi J, Kato K, Noguchi S. High thioredoxin expression is associated with resistance to docetaxel in primary breast cancer. Clin Cancer Res 2005; 11:8425-30; PMID:16322305; http://dx.doi.org/10.1158/1078-0432.CCR-05-0449
- Csiki I, Yanagisawa K, Haruki N, Nadaf S, Morrow JD, Johnson DH, Carbone DP. Thioredoxin-1 modulates transcription of cyclooxygenase-2 via hypoxia-inducible factor-1alpha in non-small cell lung cancer. Cancer Res 2006; 66:143-50; PMID:16397226; http://dx.doi.org/10.1158/0008-5472.CAN-05-1357
- Lincoln DT, Ali EEM, Tonissen KF, Clarke FM. The thioredoxin-thioredoxin reductase system: over-expression in human cancer. Anticancer Res 2003; 23:2425-33; PMID:12894524
- Cesana GC, DeRaffele G, Cohen S, Moroziewicz D, Mitcham J, Stoutenburg J, Cheung K, Hesdorffer C, Kim-Schulze S, Kaufman HL. Characterization of CD4+CD25+ regulatory T cells in patients treated with high-dose interleukin-2 for metastatic melanoma or renal cell carcinoma. J Clin Oncol 2006; 24:1169-77; PMID:16505437; http://dx.doi.org/10.1200/JCO.2005.03.6830
- Powell DJ, Jr, Felipe-Silva A, Merino MJ, Ahmadzadeh M, Allen T, Levy C, White DE, Mavroukakis S, Kreitman RJ, Rosenberg SA, et al. Administration of a CD25-directed immunotoxin, LMB-2, to patients with metastatic melanoma induces a selective partial reduction in regulatory T cells in vivo. Journal of immunology (Baltimore, Md.: 1950) 2007; 179:4919-28; PMID:17878392; http://dx.doi.org/10.4049/jimmunol.179.7.4919
- Quezada SA, Peggs KS, Simpson TR, Shen Y, Littman DR, Allison JP. Limited tumor infiltration by activated T effector cells restricts the therapeutic activity of regulatory T cell depletion against established melanoma. J Exp Med 2008; 205:2125-38; PMID:18725522; http://dx.doi.org/10.1084/jem.20080099
- Nicholaou T, Ebert LM, Davis ID, McArthur GA, Jackson H, Dimopoulos N, Tan B, Maraskovsky E, Miloradovic L, Hopkins W, et al. Regulatory T-cell-mediated attenuation of T-cell responses to the NY-ESO-1 ISCOMATRIX vaccine in patients with advanced malignant melanoma. Clin Cancer Res 2009; 15:2166-73; PMID:19276262; http://dx.doi.org/10.1158/1078-0432.CCR-08-2484
- Bjoern J, Brimnes MK, Andersen MH, Thor SP, Svane IM. Changes in peripheral blood level of regulatory T cells in patients with malignant melanoma during treatment with dendritic cell vaccination and low-dose IL-2. Scand J Immunol 2011; 73:222-33; PMID:21204893; http://dx.doi.org/10.1111/j.1365-3083.2010.02494.x
- Goding SR, Wilson KA, Xie Y, Harris KM, Baxi A, Akpinarli A, Fulton A, Tamada K, Strome SE, Antony PA. Restoring immune function of tumor-specific CD4+ T cells during recurrence of melanoma. Journal of immunology (Baltimore, Md.: 1950) 2013; 190:4899-909; PMID:23536636; http://dx.doi.org/10.4049/jimmunol.1300271
- Sim GC, Martin-Orozco N, Jin L, Yang Y, Wu S, Washington E, Sanders D, Lacey C, Wang Y, Vence L, et al. IL-2 therapy promotes suppressive ICOS+ Treg expansion in melanoma patients. J Clin Invest 2014; 124:99-110; PMID:24292706; http://dx.doi.org/10.1172/JCI46266
- Campbell DJ, Koch MA. Phenotypical and functional specialization of FOXP3+ regulatory T cells. Nat Rev Immunol 2011; 11:119-30; PMID:21267013; http://dx.doi.org/10.1038/nri2916
- Burzyn D, Benoist C, Mathis D. Regulatory T cells in nonlymphoid tissues. Nat Immunol 2013; 14:1007-13; PMID:24048122; http://dx.doi.org/10.1038/ni.2683
- Nishikawa H, Sakaguchi S. Regulatory T cells in tumor immunity. Int J Cancer 2010; 127:759-67; PMID:20518016
- Facciabene A, Peng X, Hagemann IS, Balint K, Barchetti A, Wang LP, Gimotty PA, Gilks CB, Lal P, Zhang L, et al. Tumour hypoxia promotes tolerance and angiogenesis via CCL28 and T(reg) cells. Nature 2011; 475:226-30; PMID:21753853; http://dx.doi.org/10.1038/nature10169
- Pere H, Montier Y, Bayry J, Quintin-Colonna F, Merillon N, Dransart E, Badoual C, Gey A, Ravel P, Marcheteau E, et al. A CCR4 antagonist combined with vaccines induces antigen-specific CD8+ T cells and tumor immunity against self antigens. Blood 2011; 118:4853-62; PMID:21908423; http://dx.doi.org/10.1182/blood-2011-01-329656
- Righi E, Kashiwagi S, Yuan J, Santosuosso M, Leblanc P, Ingraham R, Forbes B, Edelblute B, Collette B, Xing D, et al. CXCL12/CXCR4 blockade induces multimodal antitumor effects that prolong survival in an immunocompetent mouse model of ovarian cancer. Cancer Res 2011; 71:5522-34; PMID:21742774; http://dx.doi.org/10.1158/0008-5472.CAN-10-3143
- Wan YY, Flavell RA. TGF-beta and regulatory T cell in immunity and autoimmunity. J Clin Immunol 2008; 28:647-59; PMID:18792765; http://dx.doi.org/10.1007/s10875-008-9251-y
- Sayin VI, Ibrahim MX, Larsson E, Nilsson JA, Lindahl P, Bergo MO. Antioxidants accelerate lung cancer progression in mice. Sci Transl Med 2014; 6:221ra15; PMID:24477002; http://dx.doi.org/10.1126/scitranslmed.3007653
- Watson J. Oxidants, antioxidants and the current incurability of metastatic cancers. Open Biol 2013; 3:120144; PMID:23303309; http://dx.doi.org/10.1098/rsob.120144
- Li W, Katoh H, Wang L, Yu X, Du Z, Yan X, Zheng P, Liu Y. FOXP3 regulates sensitivity of cancer cells to irradiation by transcriptional repression of BRCA1. Cancer Res 2013; 73:2170-80; PMID:23319807; http://dx.doi.org/10.1158/0008-5472.CAN-12-2481
- Uy B, McGlashan SR, Shaikh SB. Measurement of reactive oxygen species in the culture media using Acridan Lumigen PS-3 assay. J Biomol Tech 2011; 22:95-107; PMID:21966257