
Abstract
Patients with glioblastoma multiforme (GBM) are immunosuppressed and have a broad range of immunological defects in both innate and adaptive immune responses. GBMs are frequently infected with human cytomegalovirus (HCMV), a virus capable of causing immunosuppression. In 42 HCMV-positive GBM patients in a clinical trial (VIGAS), we investigated T-cell phenotypes in the blood and assessed their relation to survival. Blood was collected before and 3, 12, and 24 weeks after surgery, and the frequency of T-cell subsets was compared with that in 26 age-matched healthy controls. GBM patients had lower levels of CD3 cells than the controls, but had significantly higher levels of CD4+CD28− T cells before and 3 and 12 weeks after surgery and increased levels of CD4+CD57+ and CD4+CD57+CD28+ T cells at all-time points. These T-cell subsets were associated with both immunosenescence and HCMV infection. GBM patients also had higher levels of γδ T cells at all-times after surgery and lower levels of CD4+CD25+ cells before and 3 weeks after surgery than healthy controls. Overall survival was significantly shorter in patients with higher levels of CD4+CD28− T cells (p = 0.025), CD4+CD57+ T (p = 0.025) cells, and CD4+CD28−CD57+CD28− T cells (p < 0.0004) at 3 weeks after surgery. Our findings indicate that signs of immunosenescence in the CD4+ compartment are associated with poor prognosis in patients with HCMV-positive GBMs and may reflect the HCMV activity in their tumors.
Abbreviations
| GBM | = | glioblastoma multiforme |
| HCMV | = | human cytomegalovirus |
| PBMC | = | peripheral blood mononuclear cell |
| Valcyte | = | valganciclovir |
| WBC | = | white blood cell count |
Introduction
Despite advances in molecular characterization and a better understanding of cancer cell biology, GBM, the most common primary intracranial tumor in adults, has a dismal prognosis. Even with aggressive surgical and concomitant chemo- and radiotherapy, median survival is as low as 12–15 mo after diagnosis.Citation1 GBMs have been divided into four molecular phenotypes: proneural, neural, classical, and mesenchymal, according to genetic alterations in tumor genes, mainly EGFR, NF1, and PDGFRA/IDH1. Each subtype is enriched in gene expression signatures of distinct neural lineages, implying that the expression patterns of the different subtypes reflect the phenotype of their cells of origin.Citation2 However, all signatures seem to be represented in GBMs of different phenotypes, increasing the difficulty of understanding the heterogeneity and complexity of these tumors.Citation3 Despite progress in understanding the genetic alterations in GBM, clinically useful predictive molecular markers of therapeutic response and prognosis are still rare.
GBMs are often positive for HCMV,Citation4-8 a herpes virus carried by 70–100% of people in populations worldwide. After an active primary infection, which is often asymptomatic or subclinical in immunocompetent persons, the virus establishes latency in myeloid cells in the bone marrow.Citation9,10 The virus can be reactivated by inflammation, leading to differentiation of monocytes into macrophages or dendritic cells. HCMV may cause severe infections in immunosuppressed individuals, who are often highly viremic.Citation11,12 GBM patients are rarely viremic, although about 20% are positive for HCMV IgM, which is very uncommon among healthy persons.Citation13 The level of HCMV infection in GBMs appears to predict survival; patients with low amounts of HCMV in their tumors at diagnosis have a better prognosis.Citation4 When added to standard therapy, anti-HCMV treatment markedly improves survival among GBM patients.Citation4 Thus, HCMV may be important in the pathobiology of GBM and may be a novel target for therapy.
HCMV can trigger immunosenescence, which is characterized by increased frequency of CD28− CD4+ and CD8+ T cells and CD57 expression.Citation14,15 Loss of CD28 expression on T cells is the most consistent biological indicator of aging or replicative senescence of the immune system. Higher levels of CD28− T cells in the elderly and patients with chronic heart failure and chronic kidney disease are associated with increased mortality.Citation16,17 CD28− T cells are also more abundant in patients with inflammatory disorders.Citation18-21 Interestingly, CD4+CD28− T cells are only considered to be found in HCMV-seropositive individuals.Citation22 HCMV likely triggers differentiation of these cells in vivo by chronic antigen stimulation.Citation23 It is not known why this virus and not other pathogens expand CD4+CD28− T cells.
CD57+ T cells accumulate in patients with different forms of cancer,Citation15 perhaps as a result of constant stimulation in the absence of effective tumor clearance mediated by tumor-associated antigens.Citation24 CD57 expression on CD4+ and CD8+ T cells was once considered to indicate immune senescence in HCMV-infected patients.Citation25 However, CD57 is mainly a marker of general proliferative instability, and CD57 expression is increased in patients with defective immune responses, such as those with HIV, active HCMV infection, autoimmune disorders, and cancer.Citation26 CD57 is also a marker of natural killer cells with poor proliferation but increased cytotoxicity.Citation27
Another T cell phenotype correlated with immune modulation and cancer is the γδ T cell. These cells account for only 2–5% of peripheral T-cells but are abundant in mucous tissues and different organs. In murine cancer models and in vitro experiments, γδ T cells delay or even halt tumor growth and decrease metastatic spread.Citation28 Their role in GBM progression and patient survival has been debated. γδ T cells kill GBM cells in vitro and reduce tumor progression in vivo.Citation29,30 A subset of γδ T cells is expanded in HCMV-infected persons.Citation31
In this study, we investigated T-cell phenotypes in relation to overall survival after diagnosis in 42 patients with HCMV-positive GBMs who were enrolled in the VIGAS trial. We found that signs of immunosenescence linked to HCMV infection predict poor survival in patients with GBM.
Results
GBM patients have lower levels of CD3 T cells but higher levels of CD4+CD28− and γδ T cells than healthy controls
Forty-two GBM patients were enrolled in this study. Their clinical characteristics are shown in , and their T-cell phenotypes are shown in and are summarized in . As in other studies,Citation32,33 these patients had significantly lower median levels of CD3 T cells than age-matched healthy controls (37.1% at baseline, 44.6% at 3 weeks, 40.9% at 12 weeks, and 43% at 24 weeks after surgery vs. 62%, in healthy controls, ). However, the CD4+ and CD8+ T-cell populations were similar in the two groups (). Thus, the decreased levels of CD3 T cells reflect depletion of other cellular subtypes. GBM patients also had significantly higher median levels of γδ T cells at all-time points compared to the healthy controls (11.6% at baseline, 12.1% at 3 weeks, 10.2% at 12 weeks, and 11.8% at 24 weeks vs. 3.6% in healthy controls, ) and of CD4+CD28− T cells before and 3 and 12 weeks after (9.0% at baseline, 7.0% at 3 weeks, and 7.0% at 12 weeks vs. 3.0% in healthy controls, ). The levels of CD8+CD28− cells did not differ in the two groups ().
Figure 1. Levels of CD3+ T cells, γδ T cells, and CD4+CD28− T cells are lower after surgery in GBM patients than in healthy controls (HC). T-cell phenotype was analyzed in PBMCs from GBM patients before and 3, 12, and 24 weeks after surgery. (A) CD3+ T cells were less abundant than in controls at all-time points (B and C) Levels of CD4+ and CD8+ T cells did not differ. (D) Levels of γδ T cells were higher in GBM patients than controls at all-time points. (E) Levels of CD4+CD28− T cells were higher before and 3 and 12 weeks after surgery. (F) Levels of CD8+CD28− T cells did not differ.
Table 1. Characteristics of glioblastoma patient cohort
Table 2. Summary of the analysis of immunological cell types (%) in blood in glioblastoma patients after surgery (weeks). Data shown in the table: median (significant p values)
GBM patients have higher levels of CD4+CD57+ and CD4+CD57+CD28+ T cells
In T cells, CD57 expression increases when CD28 expression is lost.Citation15 GBM patients had significantly higher median levels of CD4+CD57+ T cells than controls at all-time points compared to healthy controls (7.7% at baseline, 7.2% at 3 weeks, 8.1% at 12 weeks, and 7.0% at 24 weeks vs. 4.5% in controls, ). However, the number of CD8+CD57+ T cells or CD8+CD57+/CD28− T cells did not differ in GBM patients and controls ().
Figure 2. Levels of CD4+CD57+, CD4+CD57+CD28+, CD4+CD25+ and CD8+CD25+ T cells are higher after surgery in GBM patients than in healthy controls (HC). T-cell phenotype was analyzed in PBMCs from GBM patients before and 3, 12, and 24 weeks after surgery. (A) Levels of CD4+CD57+ T cells were higher in GBM patients at all-time points compared to HC. (B–D) Levels of CD8+CD57+, CD4+CD57+CD28−, and CD8+CD57+CD28−T cells did not differ. (E) Levels of CD4+CD57+CD28+ T cells were higher in GBM patients than in controls at all-time points. (F) Levels of CD8+CD57+CD28+ T did not differ. (G) Levels of CD4+CD25+T cells were lower at baseline and 3 weeks after surgery. (H) Levels of CD8+CD25+T cells were lower at 24 weeks after surgery.
The levels of CD57+CD28− CD4+ and CD8+ T cells did not differ in GBM patients and controls (). However, median levels of CD57+CD28+ CD4 cells () were higher in GMB patients (6.2% at baseline, 5.0% at 3 weeks, 6.0% at 12 weeks, and 5.7% at 24 weeks vs. 2.0% in controls). CD8+ T-cell levels did not differ significantly (). There was a trend toward lower levels of CD25 positive CD4+ and CD8+ cells in GBM patients. CD4+CD25+ T cells were significantly less abundant in GBM patients than controls at baseline (1.3% vs. 4.5%) and at 3 weeks (1.8% vs. 4.5%) (), as were levels of CD8+CD25+ cells at 24 weeks (1.0% vs. 4.0%, ). This was unexpected, as these cells are expected to serve as regulatory T cells, and GBM patients are considered to have an immunosuppressive phenotype. Unfortunately, Foxp3 — which together with CD25 is considered to be a more accurate marker for regulatory T cells — was not among the markers analyzed in blood cells from VIGAS patients. Therefore, we analyzed Foxp3 levels in cells from 15 other GBM patients. Interestingly, Foxp3-positive CD4+ and CD8+ T-cell subsets showed a trend toward greater abundance in GBM patients than healthy controls (Fig. S1). Thus, CD25 and Foxp3 subsets may be different in GBM patients, and these patients may also have higher levels of Foxp3-positive regulatory T cells.
Long-term survival in GBM patients is associated with higher levels of CD3 T cells
GBM patients are known to be immunosuppressed. Therefore, to determine whether overall survival correlates with T-cell subset levels in GBM patients, we analyzed T-cell levels at different times in long-term survivors (≥20 mo) and short-term survivors (<20 mo). CD3 T-cell levels were significantly lower in short-term survivors compared to long-term survivors of GBM patients at 3 (p = 0.002) and 12 weeks (p = 0.0367) after surgery (). However, no survival differences were found when analyzed with Kaplan–Meier graphs using the median value of CD3 T-cell level as a cut-off for low or high T-cell levels ().
Figure 3. GBM patients with longer survival time (≥20 mo) have higher levels of CD3+ but not CD4+ and CD8+ T cells. Survival was analyzed with respect to CD3, CD4+, and CD8+ expression (median values were used as a cut-off for Kaplan–Meier graphs). (A) Patients who survived longer had higher levels of CD3+ T cells at 3 and 12 weeks after surgery. (B and C) Survival did not differ in patients with high vs. low levels of CD3+ cells before and 3 weeks after surgery (D and G). No significant differences in CD4+ and CD8+ T-cell levels were observed in GBM patients with long-term survival. (E–H) Survival did not differ in patients with high vs. low levels of CD4+ cells at baseline and 3 weeks after surgery and low levels CD8+ cells at baseline. (I) GBM patients with higher levels of CD8+ T cells have shorter survival than patients with lower levels of these cells.
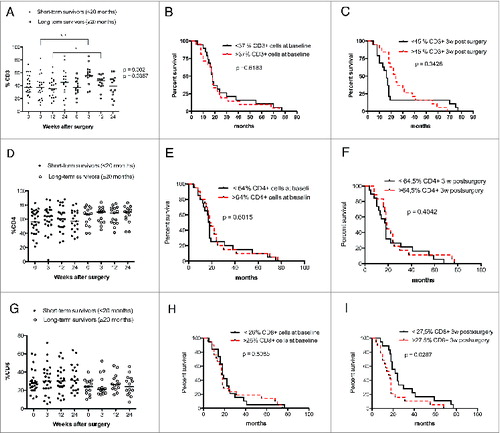
We also observed trends for lower levels of CD4+ T cells and higher levels of CD8+ T cells among short-term survivors (). Survival was not related to baseline levels of CD4+ () or CD8+ cells () but was significantly longer among GBM patients with lower levels of CD8+ T cells at 3 weeks (p = 0.029) (). The level of γδ T cells did not differ in short- vs. long-term survivors and was not associated with overall survival ().
Figure 4. GBM patients with shorter overall survival have higher levels of CD4+CD28− cells. (Median values were used as a cut-off for Kaplan–Meier analysis). Long-term GBM survivors had lower levels of CD4+CD28− at 3 weeks after surgery. (A) γδ T-cell levels did not differ in GBM patients with longer or shorter survival. (B and C) Survival did not differ in patients with high vs. low levels of γδ T cells before and at 3 weeks after surgery. (D) Among GBM patients, short-term survivors had significantly higher levels CD4+CD28− cells 3 weeks after surgery than long-term survivors. (E) Survival did not differ in patients with high vs. low levels of CD4+CD28− T cell at baseline. (F) GBM patients with higher levels of CD4+CD28− cells have shorter overall survival than those with lower levels of these T cells. (G) CD8+CD28− T-cell levels did not differ in GBM patients with longer vs. shorter survival. (H and I) Survival did not differ in patients with high vs. low levels of CD8+CD28− cells at baseline and 3 weeks after surgery.
Higher levels of CD4+CD28− T cells are associated with poor overall survival in GBM patients
Interestingly, among GBM patients, long-term survivors generally had lower levels of CD4+CD28− cells than short-term survivors; the difference was significant at 3 weeks after surgery (p = 0.009) (). Survival was also significantly longer in GBM patients with lower levels of CD4+CD28− cells at 3 weeks than in those with higher levels (p = 0.024) (). CD8+CD28− T-cell levels were similar in short- and long-term survivors, and survival did not differ in patients with higher or lower CD8+CD28− T cell levels ().
High levels of CD4+CD57+, especially CD4+CD57+CD28− T cells, are associated with shorter overall survival in GBM patients
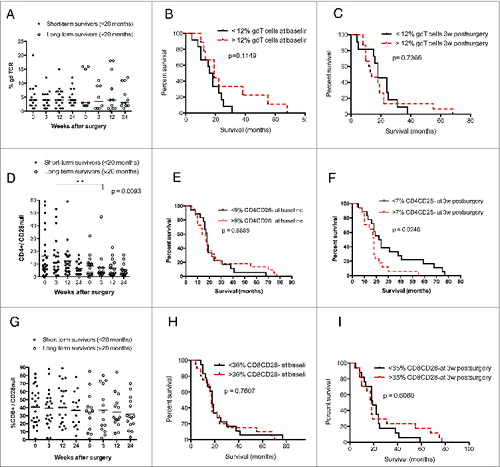
Further examination revealed a trend toward higher levels of both CD57+ CD4+ and CD8+ T cells among short-term survivors; CD4+CD57+ T-cell levels were significantly higher at 3 and 24 weeks (p = 0.036 and p = 0.019, respectively) () in short-term survivors. Overall survival was significantly longer in GBM patients with lower levels of CD4+CD57+ cells at 3 weeks (p = 0.025) (); baseline levels were not associated with survival (). The levels of CD8+CD57+ T cells were also higher among short-term survivors. The difference was significant at 24 weeks after surgery (p = 0.03) (), but Kaplan–Meier analysis showed no difference in survival ().
Figure 5 (See previous page). Higher levels of CD4+CD57+ and CD4+CD57+CD28− T cells are associated with poor survival in GBM patients using median values as a cut-off for Kaplan–Meier analysis. Direct correlation between expression of CD57 and loss of CD28 on T cells was observed. (A) GBM patients with short-term survival time had significantly higher levels of CD4+CD57+ cells at 3 and 24 weeks after surgery than long-term survivors. (B) Survival did not differ in patients with high vs. low levels of CD4+CD57+ T cell at baseline (C). GBM patients with higher levels of CD4+CD57+ T cells have shorter overall survival than those with lower levels of these cells. (D) Among GBM patients, short-term survivors had significantly higher levels of CD8+CD57+ cells at 24 weeks after surgery than long-term survivors. (E and F) Survival did not differ in patients with high vs. low levels of CD8+CD57+ cells before and 3 weeks after surgery. (G) GBM patients with shorter survival times (<20 mo) had significantly higher levels CD4+CD57+CD28− cells 3 weeks after surgery than those with long-term survival. (H) Survival did not differ in patients with high vs. low levels of CD4+CD57+CD28− cells at baseline. (I) GBM patients with higher levels of CD4+CD57+CD28− cells have shorter overall survival than those with lower levels of these cells. (J) Linear regression analysis of direct correlation between expression of CD57 and loss of CD28 on CD4+ cells.
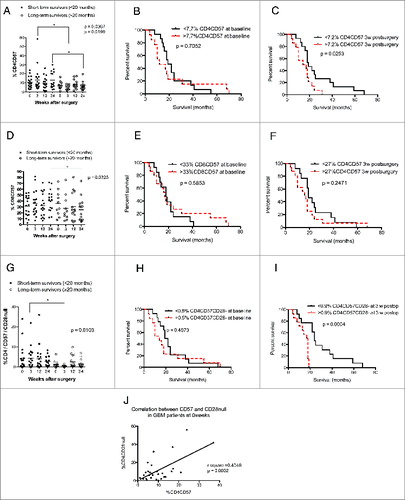
Since CD57 expression increases after loss of CD28 on CD4+ T cells in HCMV-infected patients, we further investigated whether T cells that express CD57 but had lost CD28 expression were correlated to survival. There was a clear trend toward increased levels of these T cells at 3 weeks in short-term survivors (p = 0.01) (). Interestingly, median overall survival was longer in GBM patients with lower levels of CD57+CD28− CD4 T cells than in those with higher levels (24 vs. 17.5 mo) (). Loss of CD28 expression correlated with increased expression of CD57 (r2 = 0.40, p = 0.0002) ().
The levels of CD4+ and CD8+ T cells expressing CD57 with or without CD28 expression and the survival rate did not differ in short-term and long-term survivors (). Furthermore, the number and percentage of CD25 CD4+ T cells were unrelated to survival among short-term or long-term survivors ().
Figure 6. In GBM patients, levels of CD8+CD57+CD28−, CD4+CD57+CD28+ and CD8+CD57+CD28+ T cells do not correlate with survival (median values were used as a cut-off for Kaplan–Meier analysis) and did not differ in long-term vs. short-term survivors. (A–C) Survival did not differ in patients with high vs. low levels of CD8+CD57+CD28− T-cells as well as in short-term vs. long-term GBM survivors. (D–I) Survival did not differ in patients with high vs. low CD4+CD57+CD28+ or CD8+CD57+CD28+ T-cell levels as well as in short-term vs. long-term GBM survivors.
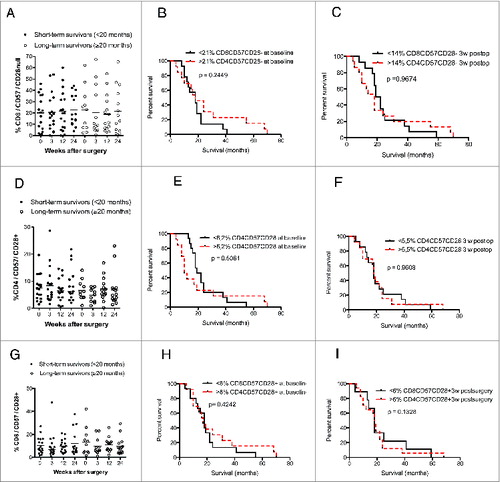
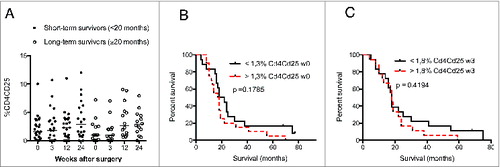
Figure 7. (A–C) Levels of CD4+CD25+ T cells did not correlate with GBM patient survival.
Neither corticosteroid treatment nor antiviral treatment affects T-cell subsets
Steroids have immunological effects on numerous immune cell types, and most GBM patients receive corticosteroids before and for a short time after surgery. In the VIGAS cohort, all patients had short-term corticosteroid treatment. A high dose was given before and directly after surgery; postoperatively, the corticosteroid dose was rapidly decreased to the minimum effective dose to control cerebral edema. We therefore analyzed whether T-cell subsets were affected by steroid intake longer than 3 weeks. T-cell subsets did not differ in the patients with longer vs. shorter steroid treatment in the cohorts with significant T cell findings (). Since VIGAS patients were given Valcyte or placebo during the study, we next examined whether antiviral treatment affected T-cell phenotypes. Antiviral treatment did not influence T cells phenotypes over time in the cohorts with significant T cell findings. (). We also analyzed total white blood cell counts (WBCs) in these patients. As expected, WBCs were reduced in patients treated with valganciclovir; however, this change was not significant (Fig. S1). This drug affects the number of leukocytes and platelets, but does not affect T-cell numbers according to the manufacturer and our clinical experience. Thus, we conclude that neither corticosteroid nor valganciclovir treatment significantly affected WBCs during the study phase.
Table 3. Linear regression analysis of patient cohorts with steroid treatment longer then 3 weeks versus shorter than 3 weeks post surgery
Table 4. Linear regression analysis comparing patient cohorts with Valcyte treatment versus placebo
Discussion
In this study, we investigated the frequency of T-cell subsets in the blood and their association with survival of GBM patients. We found that GBM patients had lower levels of CD3+ T cells than controls, as in other reports,Citation34 and lower levels of CD4+CD25+T cells, but a trend toward higher numbers of Foxp3-positive T cells. GBM patients also had increased levels of CD4+ T cells that expressed CD57 but had lost CD28 expression, which may indicate increased proliferative instability and senescence. Survival times were shorter among GBM patients with lower levels of CD3+ T cells, higher levels of CD28− T cells, or higher levels of CD57+ T cells. These subsets are highly associated with HCMV infection, which was present in all the GBM patients and can cause immunosuppression and immunosenesence.Citation35 Furthermore, γδ T cells were more abundant in GBM patients than controls. These cells have potent antitumor effects, and a subset of them is highly associated with HCMV infection.Citation31 Thus, our results indicate that GBM patients have greater immunosuppression and immunosenesence, possibly reflected by higher levels of HCMV activity in these patients than controls. Both phenotypes were associated with a poor outcome.
For unknown reasons, GBM patients exhibit multiple immunosuppressive features affecting different cellular processes of the host. HCMV proteins are frequently detected in GBMs, and this virus induces immunosuppression both directly and indirectly. Earlier studies implied that GBM patients have an impaired cell-mediated immune response (reviewed in ref.Citation33). Likewise, HCMV-infected patients show clear signs of immunosuppression, impaired cell-mediated immune responses, and higher rates of bacterial and fungal infections.Citation36 Biologically, HCMV suppresses antigen presentation, impairs the activation of T cells, natural killer cells, and B cells, and has many other immunomodulatory functions.Citation35,37 The virus enhances production of the immunosuppressive factors TGF-β and IL-10 and can produce a functional virus-encoded IL-10 homolog (cmvIL-10) during active or latent infection.Citation38 HCMVIL-10, produced by CD133+ cells in the tumor of GBM patients, has been suggested to mediate immunosuppressive effects on tumor macrophages.Citation39
In patients with GBM or other cancers, HCMV proteins are readily detected in tumor tissue by immunohistochemistry and western blot; however, only low levels of HCMV DNA and RNA are detectable, and the virus does not seem to replicate its DNA in tumors. These observations sparked controversy about whether the virus is truly present in GBMs. However, GBM lysates used for dendritic cell vaccination result in expansion of HCMV-specific T cells in patients, and HCMV pp65-specific T cells recognize and kill autologous GBM cells.Citation40-42 These observations provide indisputable immunological evidence that GBM cells express HCMV peptides. HCMV peptides expressed in GBM cells may thus in theory provide a chronic antigen stimulation, which may trigger expansion of CD4+T cells that express CD57 and later lose CD28 expression; this T cell phenotype was highly associated with HCMV infection.
Since CD28 is important in T-cell activation and mediates proliferative stability, loss of its expression on CD4+ T cells in GBM patients may severely impair immune responses. CD28 has a crucial role during T-cell activation: it mediates induced cytokine production (IL-2), procession and generation of cytotoxic T lymphocytes, activation of B cells, and promotion of cell proliferation.Citation43 CD28− T cells are therefore believed to inhibit the immune response through various suppressive functions,Citation44 and lack of this co-stimulatory signal reduces the immune response to pathogens.Citation45 Loss of CD28 expression on T cells is also one of the most consistent biological indicators of human immune senescence, and the frequency of CD28− T cells predicts immune incompetence in the elderly.Citation46 Interestingly, CD4+ T cells lacking CD28 expression exist only in HCMV-seropositive individuals, and HCMV activity is strongly correlated with enhanced expansion of CD4+CD28− T cells in humans,Citation22 a phenomenon related to immunoscenesensce.Citation14,23 Expansion of this T-cell subset is believed to be dependent on chronic antigen stimulation, and most of these T cells recognize HCMV peptides.Citation47 Nevertheless, although they have limited proliferative capacity, CD28− T cells are functionally active and can produce both IFNγ and TNF-α.Citation48 These cells are abundant in patients with chronic inflammatory diseases.Citation14
CD4+ T cells that had lost CD28 expression were first identified as a unique cell type that expressed CD57 in HCMV-infected patients; they were later shown to have lost expression of CD28, CD2, or both. Patients with a history of infection with HCMV, Epstein–Barr virus, or HIV are today known to have an increased frequency of CD57+ T cells.Citation49 T cells are not considered to express CD57 at birth; CD57 expression increases with age and is found in 20–30% of young adults and 50–60% of the elderly (above 80 years old).Citation27 Levels of CD4+, CD8+, and CD57+ cells are also frequently increased in many cancers.Citation26,27,50 Expanded subsets of T cells expressing CD57 but not CD28 were highly associated with survival in our GBM patient cohort. All these patients were HCMV positive, as this was an inclusion criterion for the study. Since CD28− T cells are expanded in HCMV-infected individuals; the expansion of these cells may reflect greater activity of HCMV in GBM patients. These observations would confirm our previous report of the prognostic value of HCMV activity in the GBMsCitation4 and explain why control of HCMV infection with antiviral treatment improves the survival of GBM patients.Citation4 Several previous studies also found increased levels of CD28− T cells in various malignancies (reviewed in ref.Citation15). Expansion of late-differentiated T cells was associated with the tumor in patients with head and neck cancer; expanded CD8+CD28− T-cell populations returned to normal levels after tumor removal.Citation51 Taken together, our observations suggest that HCMV affects GBM progression and that expansion of certain T-cell phenotypes reflects viral activity in GBM patients. We provide further indirect evidence that higher levels of viral activity in GBMs is associated with poor survival, although it cannot be excluded that the functional immune status may be linked directly to survival.
In summary, we found that GBM patients have lower levels of CD3 T cells and CD25 T cells than healthy controls, as well as higher levels of γδ T cells, CD4+CD28− T cells, and CD4+CD57+ and CD4+CD57+CD28+ T cells. GBM patients with higher grade of immunosuppression — and thus lower levels of CD3 T cells and higher levels of CD28− T cells, CD57+ T cells, and CD28−CD57+ T cells — had significantly shorter overall survival. As CD28 loss and CD57 expression are strongly associated with HCMV infection, our findings suggest that GBM patients show signs of immunosenescence that may be linked to HCMV infection and predict poor survival. Extended antiviral treatment to control HCMV infection markedly improves the survival of patients with GBM.Citation4 Our results should encourage additional studies to understand the direct biological link between HCMV and immunosenescence and its impact in GBM patients.
Materials and Methods
Patient data
Peripheral blood mononuclear cells (PBMCs) were obtained from 42 patients (13 women and 29 men; mean age 60 ± 10 years) with GBM treated surgically at Karolinska University Hospital between 20 December 2006 and 3 June 2008. All 42 patients had World Health Organization grade IV GBM and received standard treatment with concomitant radio- and chemotherapy. PBMCs were obtained before and 3, 12, and 24 weeks after surgery. PBMCs were also obtained from 26 healthy controls (18 women and 8 men; mean age 55 ± 5 years). The control cohort included age-matched, healthy individuals without a history of cancer. These GBM patients were also part of a randomized, double-blinded, placebo-controlled phase I study to evaluate the efficacy and safety of the antiviral drug valganciclovir for 24 weeks in combination with temozolomide and/or radiation therapy in patients with HCMV-positive GBMs (VIGAS study). HCMV positivity was determined by immunohistochemistry and was an inclusion criterion. The study was registered at the Swedish Medical Agency (Eudra number 2006-002022-29) and at ClincalTrials.gov and was approved by the Karolinska ethics committee (2006/755-31).
Flow cytometry analysis
PBMCs were isolated from blood samples with Lymphoprep (Medinor, Cat. No. 30066.03) according to the manufacturers instructions. Fresh PBMCs were stained with the following antibodies as recommended by the manufacturers: anti-CD3-CY, anti-CD8-Pacific Blue (both from Dako, Cat. Nos. CA696 and PB984, respectively) anti-CD4-PerCP, anti-CD28-PE (both from BD Biosciences, Cat. Nos. 345770 and 556622, respectively), anti-CD25-PE/Cy7, anti-FoxP3 ( Biolegend, Cat. No. 320216) and anti-CD57-APC (both from Biolegend, Cat. Nos. 302612 and 322314, respectively), anti-TCR γ/δ-PE (Beckman Coulter, Cat. No. pnim1418u). Cells were analyzed by fluorescence-activated cell sorting on a Cyan (Beckman Coulter) with Summit v4.3.02 software.Citation52 Cells were initially gated as CD3+. This population was thereafter separately gated for CD4+ and CD8+. The CD4+ and CD8+ cells were further gated according expression of CD25, CD 28, and CD57 and γδ expression.
Statistical analysis
Protein expression levels were analyzed by the nonparametric Mann–Whitney U-test, yielding two-tailed p values. Survival was analyzed with descriptive statistic and Kaplan–Meier survival curves with median values of protein expression as a cut-off. Patient survival was analyzed by log-rank test. Long-term survivors were defined as patients who lived ≥20 mo and short-term survivors as those who lived <20 mo; all calculations were made on this definition. The effects of steroid or antiviral therapy on T-cell phenotypes were determined by linear regression analysis, adjusting for the patient age using STATA 11.2 (StataCorp LP) and Prism 5, which were also used to correlate expression of CD57 and loss of CD28 expression in CD4+ T cells. All differences were considered significant at the 5% level.
Disclosure of Potential Conflicts of Interest
No potential conflict of interest was disclosed.
Supplemental Material
Supplemental data for this article can be accessed on the publisher's website.
Supplemental_Material.pptx
Download MS Power Point (193 KB)Funding
This work was supported by BILTEMA Foundation, Stichting af Jochnicks Foundation, Sten A Olssons Foundation for Research and Culture, Familjen Erling-Perssons Stiftelse, RATOS, independent grants from Hoffmann La Roche, Torsten and Ragnar Söderbergs Foundations, Dan och Jane Olssons Foundation, Swedish Cancer Foundation, Swedish Medical Research Council, Swedish Society for Medical Research (SLS), Goljes Memory Foundation, Magnus Bergvalls Foundation, Swedish Society for Medical Research (SSMF), IngaBritt och Arne Lundbergs Foundation, Nexttobe and Tore Nilsons Foundation.
References
- Wen PY, Kesari S. Malignant gliomas in adults. N Engl J Med 2008; 359:492-507; PMID:18669428; http://dx.doi.org/10.1056/NEJMra0708126
- Verhaak RG, Hoadley KA, Purdom E, Wang V, Qi Y, Wilkerson MD, Miller CR, Ding L, Golub T, Mesirov JP et al. Integrated genomic analysis identifies clinically relevant subtypes of glioblastoma characterized by abnormalities in PDGFRA, IDH1, EGFR, and NF1. Cancer Cell 2010; 17:98-110; PMID:20129251; http://dx.doi.org/10.1016/j.ccr.2009.12.020
- Patel AP, Tirosh I, Trombetta JJ, Shalek AK, Gillespie SM, Wakimoto H, Cahill DP, Nahed BV, Curry WT, Martuza RL et al. Single-cell RNA-seq highlights intratumoral heterogeneity in primary glioblastoma. Science 2014; 344:1396-401; PMID:24925914; http://dx.doi.org/10.1126/science.1254257
- Rahbar A, Orrego A, Peredo I, Dzabic M, Wolmer-Solberg N, Straat K, Stragliotto G, Soderberg-Naucler C. Human cytomegalovirus infection levels in glioblastoma multiforme are of prognostic value for survival. J Clin Virol 2013; 57:36-42; PMID:23391370; http://dx.doi.org/10.1016/j.jcv.2012.12.018
- Cobbs CS, Harkins L, Samanta M, Gillespie GY, Bharara S, King PH, Nabors LB, Cobbs CG, Britt WJ. Human cytomegalovirus infection and expression in human malignant glioma. Cancer Res 2002; 62:3347-50; PMID:12067971
- Ranganathan P, Clark PA, Kuo JS, Salamat MS, Kalejta RF. Significant association of multiple human cytomegalovirus genomic Loci with glioblastoma multiforme samples. J Virol 2012; 86:854-64; PMID:22090104; http://dx.doi.org/10.1128/JVI.06097-11
- Bhattacharjee B, Renzette N, Kowalik TF. Genetic analysis of cytomegalovirus in malignant gliomas. J Virol 2012; 86:6815-24; PMID:22496213; http://dx.doi.org/10.1128/JVI.00015-12
- Mitchell DA, Xie W, Schmittling R, Learn C, Friedman A, McLendon RE, Sampson JH. Sensitive detection of human cytomegalovirus in tumors and peripheral blood of patients diagnosed with glioblastoma. Neuro Oncol 2008; 10:10-8; PMID:17951512; http://dx.doi.org/10.1215/15228517-2007-035
- Soderberg-Naucler C, Fish KN, Nelson JA. Reactivation of latent human cytomegalovirus by allogeneic stimulation of blood cells from healthy donors. Cell 1997; 91:119-26; PMID:9335340; http://dx.doi.org/10.1016/S0092-8674(01)80014-3
- Sinclair J. Human cytomegalovirus: Latency and reactivation in the myeloid lineage. J Clin Virol 2008; 41:180-5; PMID:18164651; http://dx.doi.org/10.1016/j.jcv.2007.11.014
- Cheung TW, Teich SA. Cytomegalovirus infection in patients with HIV infection. Mt Sinai J Med 1999; 66:113-24; PMID:10100416
- Peggs KS, Mackinnon S. Cytomegalovirus: the role of CMV post-haematopoietic stem cell transplantation. Int J Biochem Cell Biol 2004; 36:695-701; PMID:15072052; http://dx.doi.org/10.1016/j.biocel.2003.08.008
- Rahbar A PI, Wolmer Solberg N, Taher C, Dzabic M, Xu X, Skarman P, Fornara O, Tammik C, Yaiw K, Wilhelmi V et al. Discordant humoral and cellular immune responses to cytomegalovirus (CMV) in glioblastoma patients whose tumors are positive for CMV. Oncoimmunology 2015; 4(2):e982391
- Vallejo AN. CD28 extinction in human T cells: altered functions and the program of T-cell senescence. Immunol Rev 2005; 205:158-69; PMID:15882352; http://dx.doi.org/10.1111/j.0105-2896.2005.00256.x
- Strioga M, Pasukoniene V, Characiejus D. CD8+ CD28- and CD8+ CD57+ T cells and their role in health and disease. Immunology 2011; 134:17-32; PMID:21711350; http://dx.doi.org/10.1111/j.1365-2567.2011.03470.x
- Koller L, Richter B, Goliasch G, Blum S, Korpak M, Zorn G, Brekalo M, Maurer G, Wojta J, Pacher R et al. CD4+ CD28(null) cells are an independent predictor of mortality in patients with heart failure. Atherosclerosis 2013; 230:414-6; PMID:24075776; http://dx.doi.org/10.1016/j.atherosclerosis.2013.08.008
- Betjes MG, Meijers RW, de Wit LE, Litjens NH. A killer on the road: circulating CD4(+)CD28null T cells as cardiovascular risk factor in ESRD patients. J Nephrol 2012; 25:183-91; PMID:22135034; http://dx.doi.org/10.5301/jn.5000057
- Fasth AE, Snir O, Johansson AA, Nordmark B, Rahbar A, Af Klint E, Bjorkstrom NK, Ulfgren AK, van Vollenhoven RF, Malmstrom V et al. Skewed distribution of proinflammatory CD4+CD28null T cells in rheumatoid arthritis. Arthritis Res Ther 2007; 9:R87; PMID:17825098; http://dx.doi.org/10.1186/ar2286
- Pandya JM, Fasth AE, Zong M, Arnardottir S, Dani L, Lindroos E, Malmstrom V, Lundberg IE. Expanded T cell receptor Vbeta-restricted T cells from patients with sporadic inclusion body myositis are proinflammatory and cytotoxic CD28null T cells. Arthritis Rheum 2010; 62:3457-66; PMID:20662057; http://dx.doi.org/10.1002/art.27665
- Kobayashi T, Okamoto S, Iwakami Y, Nakazawa A, Hisamatsu T, Chinen H, Kamada N, Imai T, Goto H, Hibi T. Exclusive increase of CX3CR1+CD28-CD4+ T cells in inflammatory bowel disease and their recruitment as intraepithelial lymphocytes. Inflamm Bowel Dis 2007; 13:837-46; PMID:17285595; http://dx.doi.org/10.1002/ibd.20113
- Dumitriu IE, Araguas ET, Baboonian C, Kaski JC. CD4+ CD28 null T cells in coronary artery disease: when helpers become killers. Cardiovasc Res 2009; 81:11-9; PMID:18818214; http://dx.doi.org/10.1093/cvr/cvn248
- van Leeuwen EM, Remmerswaal EB, Heemskerk MH, ten Berge IJ, van Lier RA. Strong selection of virus-specific cytotoxic CD4+ T-cell clones during primary human cytomegalovirus infection. Blood 2006; 108:3121-7; PMID:16840731; http://dx.doi.org/10.1182/blood-2006-03-006809
- van Leeuwen EM, Remmerswaal EB, Vossen MT, Rowshani AT, Wertheim-van Dillen PM, van Lier RA, ten Berge IJ. Emergence of a CD4+CD28- granzyme B+, cytomegalovirus-specific T cell subset after recovery of primary cytomegalovirus infection. J Immunol 2004; 173:1834-41; PMID:15265915; http://dx.doi.org/10.4049/jimmunol.173.3.1834
- Di Girolamo W, Coronato S, Portiansky E, Laguens G. Profile of immune cells in lymph nodes draining human malignant tumors. Medicina (B Aires) 2008; 68:423-7; PMID:19147422
- Wang EC, Borysiewicz LK. The role of CD8+, CD57+ cells in human cytomegalovirus and other viral infections. Scand J Infect Dis Suppl 1995; 99:69-77; PMID:8668946
- Focosi D, Bestagno M, Burrone O, Petrini M. CD57+ T lymphocytes and functional immune deficiency. J Leukoc Biol 2010; 87:107-16; PMID:19880576; http://dx.doi.org/10.1189/jlb.0809566.
- Nielsen CM, White MJ, Goodier MR, Riley EM. Functional Significance of CD57 Expression on Human NK Cells and Relevance to Disease. Front Immunol 2013; 4:422; PMID:24367364; http://dx.doi.org/10.3389/fimmu.2013.00422
- Marquez-Medina D, Salla-Fortuny J, Salud-Salvia A. Role of gamma-delta T-cells in cancer: another opening door to immunotherapy. Clin Transl Oncol 2012; 14:891-5; PMID:23054752; http://dx.doi.org/10.1007/s12094-012-0935-7
- Bryant NL, Suarez-Cuervo C, Gillespie GY, Markert JM, Nabors LB, Meleth S, Lopez RD, Lamb LS Jr. Characterization and immunotherapeutic potential of gammadelta T-cells in patients with glioblastoma. Neuro Oncol 2009; 11:357-67; PMID:19211933; http://dx.doi.org/10.1215/15228517-2008-111
- Bryant NL, Gillespie GY, Lopez RD, Markert JM, Cloud GA, Langford CP, Arnouk H, Su Y, Haines HL, Suarez-Cuervo C et al. Preclinical evaluation of ex vivo expanded/activated gammadelta T cells for immunotherapy of glioblastoma multiforme. J Neurooncol 2011; 101:179-88; PMID:20532954; http://dx.doi.org/10.1007/s11060-010-0245-2
- Dechanet J, Merville P, Lim A, Retiere C, Pitard V, Lafarge X, Michelson S, Meric C, Hallet MM, Kourilsky P et al. Implication of gammadelta T cells in the human immune response to cytomegalovirus. J Clin Invest 1999; 103:1437-49; PMID:10330426; http://dx.doi.org/10.1172/JCI5409
- Morford LA, Dix AR, Brooks WH, Roszman TL. Apoptotic elimination of peripheral T lymphocytes in patients with primary intracranial tumors. J Neurosurg 1999; 91:935-46; PMID:10584838; http://dx.doi.org/10.3171/jns.1999.91.6.0935
- Dix AR, Brooks WH, Roszman TL, Morford LA. Immune defects observed in patients with primary malignant brain tumors. J Neuroimmunol 1999; 100:216-32; PMID:10695732; http://dx.doi.org/10.1016/S0165-5728(99)00203-9
- Bhondeley MK, Mehra RD, Mehra NK, Mohapatra AK, Tandon PN, Roy S, Bijlani V. Imbalances in T cell subpopulations in human gliomas. J Neurosurg 1988; 68:589-93; PMID:3258364; http://dx.doi.org/10.3171/jns.1988.68.4.0589
- Spencer JV, Lockridge KM, Barry PA, Lin G, Tsang M, Penfold ME, Schall TJ. Potent immunosuppressive activities of cytomegalovirus-encoded interleukin-10. J Virol 2002; 76:1285-92; PMID:11773404; http://dx.doi.org/10.1128/JVI.76.3.1285-1292.2002
- van den Berg AP, Klompmaker IJ, Haagsma EB, Peeters PM, Meerman L, Verwer R, The TH, Slooff MJ. Evidence for an increased rate of bacterial infections in liver transplant patients with cytomegalovirus infection. Clin Transplant 1996; 10:224-31; PMID:8664524
- Hengel H, Brune W, Koszinowski UH. Immune evasion by cytomegalovirus-survival strategies of a highly adapted opportunist. Trends Microbiol 1998; 6:190-7; PMID:9614343; http://dx.doi.org/10.1016/S0966-842X(98)01255-4
- Kotenko SV, Saccani S, Izotova LS, Mirochnitchenko OV, Pestka S. Human cytomegalovirus harbors its own unique IL-10 homolog (cmvIL-10). Proc Natl Acad Sci U S A 2000; 97:1695-700; PMID:10677520; http://dx.doi.org/10.1073/pnas.97.4.1695
- Dziurzynski K, Wei J, Qiao W, Hatiboglu MA, Kong LY, Wu A, Wang Y, Cahill D, Levine N, Prabhu S et al. Glioma-associated cytomegalovirus mediates subversion of the monocyte lineage to a tumor propagating phenotype. Clin Cancer Res 2011; 17:4642-9; PMID:21490182; http://dx.doi.org/10.1158/1078-0432.CCR-11-0414
- Prins RM, Wang X, Soto H, Young E, Lisiero DN, Fong B, Everson R, Yong WH, Lai A, Li G et al. Comparison of glioma-associated antigen peptide-loaded vs. autologous tumor lysate-loaded dendritic cell vaccination in malignant glioma patients. J Immunother 2013; 36:152-7; PMID:23377664; http://dx.doi.org/10.1097/CJI.0b013e3182811ae4
- Hegde M, Bielamowicz KJ, Ahmed N. Novel approaches and mechanisms of immunotherapy for glioblastoma. Discov Med 2014; 17:145-54; PMID:24641957
- Nair SK, De Leon G, Boczkowski D, Schmittling R, Xie W, Staats J, Liu R, Johnson LA, Weinhold K, Archer GE et al. Recognition and killing of autologous, primary glioblastoma tumor cells by human cytomegalovirus pp65-specific cytotoxic T cells. Clin Cancer Res 2014; 20:2684-94; PMID:24658154; http://dx.doi.org/10.1158/1078-0432.CCR-13-3268
- Effros RB. Loss of CD28 expression on T lymphocytes: a marker of replicative senescence. Dev Comp Immunol 1997; 21:471-8; PMID:9463780; http://dx.doi.org/10.1016/S0145-305X(97)00027-X
- Saurwein-Teissl M, Lung TL, Marx F, Gschosser C, Asch E, Blasko I, Parson W, Bock G, Schonitzer D, Trannoy E et al. Lack of antibody production following immunization in old age: association with CD8(+)CD28(−) T cell clonal expansions and an imbalance in the production of Th1 and Th2 cytokines. J Immunol 2002; 168:5893-9; PMID:12023394; http://dx.doi.org/10.4049/jimmunol.168.11.5893
- Godlove J, Chiu WK, Weng NP. Gene expression and generation of CD28-CD8 T cells mediated by interleukin 15. Exp Gerontol 2007; 42:412-5; PMID:17204390; http://dx.doi.org/10.1016/j.exger.2006.11.015
- Chou JP, Effros RB. T cell replicative senescence in human aging. Curr Pharm Des 2013; 19:1680-98; PMID:23061726
- Pourgheysari B, Khan N, Best D, Bruton R, Nayak L, Moss PA. The cytomegalovirus-specific CD4+ T-cell response expands with age and markedly alters the CD4+ T-cell repertoire. J Virol 2007; 81:7759-65; PMID:17409149; http://dx.doi.org/10.1128/JVI.01262-06
- Moro-Garcia MA, Alonso-Arias R, Lopez-Larrea C. When Aging Reaches CD4+ T-Cells: Phenotypic and Functional Changes. Front Immunol 2013; 4:107; PMID:23675374; http://dx.doi.org/10.3389/fimmu.2013.00107
- Vasudev A, Tan Tze Ying C, Ayyadhury S, Joo Puan K, Kumar Andiappan A, Shwe Zin Nyunt M, Binte Shadan N, Mustafa S, Low I, Rotzschke O et al. gamma/delta T cell subsets in human aging using the classical α/β T cell model. J Leukoc Biol 2014; 96(4):647–55; PMID:25001861; http://dx.doi.org/10.1189/jlb.5A1213-650RR
- Sinclair JH, Reeves MB. Human cytomegalovirus manipulation of latently infected cells. Viruses 2013; 5:2803-24; PMID:24284875; http://dx.doi.org/10.3390/v5112803
- Tsukishiro T, Donnenberg AD, Whiteside TL. Rapid turnover of the CD8(+)CD28(−) T-cell subset of effector cells in the circulation of patients with head and neck cancer. Cancer Immunol Immunother 2003; 52:599-607; PMID:12827303; http://dx.doi.org/10.1007/s00262-003-0395-6
- Fedio WM, Wendakoon CN, Zapata R, Carrillo C, Browning P. Comparison of Petrifilm Staph Express Count System with the bacteriological analytical manual direct-plating method for enumeration of Staphylococcus aureus in artificially contaminated hard cheese. J AOAC Int 2008; 91:1138-41; PMID:18980130