
Abstract
There is increasing evidence that some cancer therapies can promote tumor immunogenicity to boost the endogenous antitumor immune response. In this study, we used the novel combination of agonistic anti-TRAIL-R1 antibody (mapatumumab, Mapa) with low dose bortezomib (LDB) for this purpose. The combination induced profound myeloma cell apoptosis, greatly enhanced the uptake of myeloma cell apoptotic bodies by dendritic cell (DC) and induced anti-myeloma cytotoxicity by both CD8+ T cells and NK cells. Cytotoxic lymphocyte expansion was detected within 24 h of commencing therapy and was maximized when myeloma-pulsed DC were co-treated with low dose bortezomib and mapatumumab (LDB+Mapa) in the presence of NK cells. This study shows that Mapa has two distinct but connected modes of action against multiple myeloma (MM). First, when combined with LDB, Mapa produced powerful myeloma cell apoptosis; secondly, it promoted DC priming and an NK cell-mediated expansion of anti-myeloma cytotoxic lymphocyte (CTL). Overall, this study indicates that Mapa can be used to drive potent anti-MM immune responses.
Abbreviations:
- anti-myeloma cytotoxic lymphocyte, AMCL
- bortezomib, btz
- chymotrypsin, Ch
- cytotoxic lymphocyte, CTL
- dendritic cell, DC
- human myeloma cell line, HMCL
- low dose bortezomib, LDB
- low dose bortezomib and mapatumumab, LDB+Mapa
- mapatumumab, Mapa
- monocyte-derived dendritic cell, MoDC
- Multiple myeloma, MM
- TRAIL receptor 1, TRAIL-R1
- tumor necrosis factor apoptosis inducing ligand, TRAIL
Introduction
MM is incurable by either conventional chemotherapy or recently developed novel therapies including immunomodulatory drugs and proteasome inhibitors.Citation1,2,3 This underscores the need for the further development of therapies that target all aspects of myeloma control including cell survival, proliferationCitation4 and anti-myeloma immunity.Citation5 MM is associated with defects in both cellular and humoral immunityCitation6-9 that must be overcome to optimize immunotherapeutic approaches.Citation10 Ideal anti-MM therapy would be that which delivers maximal myeloma cell apoptosis whilst simultaneously promoting anti-myeloma immune responses by promoting immunogenic cell death.Citation11 Recent studies in pre-clinical models,Citation12-16 and promising results in clinical trialsCitation17-20 suggest that antibodies directed against plasma cells including those against SLAM-F7 (Elotuzumab, Bristol-Myers Squibb) or CD38 (Daratumumab, Janssen Biotech) have the potential to significantly improve immunotherapy against MM. The effect of these antibodies at promoting secondary cytotoxic cellular immune responses has not yet been full explored. Monoclonal antibodies directed against the tumor necrosis factor-related apoptosis-inducing ligand receptor-1 (TRAIL-R1) may also offer an opportunity to induce myeloma cell apoptosis, promote immunogenic cell death and generate cytotoxic cellular immune responses.
Tumor necrosis factor-related apoptosis-inducing ligand (TRAIL or Apo2L) induces apoptosis by activation of either TRAIL-R1 (DR4) or TRAIL-R2 (DR5).Citation21-24 Soluble TRAIL induces apoptotic cell death in a wide range of tumors, including MM, but not in normal cells, however its therapeutic utility is limited by its relatively short half-life. The agonistic humanized IgG1 antibody to TRAIL-R1, Mapa, has been previously shown to induce apoptosis in MM cells;Citation25 however, the immune potentiating effect of this antibody has not been previously explored. The combination of TRAIL ligand and bortezomib (btz) has been shown to induce apoptosis in MM cell lines and primary human samples.Citation26 Furthermore, Mapa and Velcade (btz) have been used in a clinical trial with no additional effect of the antibody above that of Velcade.Citation27 This combination however may not be optimal at the current bortezomib doses used clinically. btz has numerous immunosuppressive effects on the human immune system,Citation28-30 contributing to a demonstrable increase in the incidence of Varicella infections in btz-treated MM patients.Citation31 Monoclonal antibody combination therapies using standard dose btz, may therefore be limited in their ability to promote immune responses by the immunosuppressive effects of btz.
In this study, we addressed this problem by adjusting the dose of btz to below that able to induce single agent myeloma cell apoptosis and then explored whether myeloma cells pre-treated with LDB potentiated Mapa-induced apoptosis. We also explored whether antibody-mediated tumor cell death induction also promoted antitumor immune responses and the mechanisms required to do so. Our results indicate that in an NK cell-dependent manner, the combination of LDB+Mapa therapy induces myeloma cell immunogenic death and promotes potent anti-myeloma cytotoxic cell immunity.
Results
TRAIL receptor-1 expressing human multiple myeloma cell lines are sensitive to Mapa plus low dose bortezomib
Six MM cell lines, when tested for sensitivity to titrated doses of btz (Fig. S1), revealed two features. First, MM cell lines were sensitive to btz from a 5 nM dose and above. Secondly, the sub-optimal apoptosis-inducing dose was established for each cell line and was 1 nM btz for RPMI8226, U266 and NCIH929; 2.5 nM btz for OPM-2, JJN-03 and 5 nM for LP-1. This btz dose was used in subsequent studies to stress the MM cell without inducing apoptosis, and was termed “LDB”. MM cell line expression of TRAIL-R1 was shown to be variable; thus, LP-1, RPMI8226, NCI-H929, U266 and OPM-2 all express TRAIL-R1 (Fig. S2A) constitutively. In contrast, JJN-03 was consistently negative for TRAIL-R1. Subsequently, all cell lines were treated with titrated doses of Mapa, and apoptosis assessed at 48 h. The TRAIL-R1 expressing cell lines (OPM-2, U266 and LP-1) showed 60%, 30% and 25% apoptosis in response to 10 μg/mL Mapa respectively (Fig. S2B). RPMI8226 is exquisitely sensitive to Mapa and undergoes apoptosis (90–100)% in response to 0.14 μg/mL Mapa (Fig. S2C). Two cell lines (NCI-H929 and JJN-03) were resistant to Mapa therapy in the dose range 0–10 μg/mL (Fig. S2B). Whilst TRAIL-R1 expression was required for the Mapa response, TRAIL-R1 expression level did not correlate with the extent of Mapa-induced apoptosis (Fig. S2D), consistent with that observed previously by Menoret et al. Citation25 Thus, whilst OPM-2 was sensitive to Mapa therapy, OPM-2 constitutively expressed relatively lower levels of TRAIL-R1 than LP-1, a low responder to Mapa-induced apoptosis.
Subsequently, all six MM cell lines were treated with LDB (established above for each cell line) and titrated doses of Mapa to establish whether combination therapy was more effective than Mapa alone. RPMI8226, OPM-2 and U266 were all significantly more sensitive to combination therapy rather than Mapa alone (); however, the Mapa-resistant cell lines (NCI-H929 and JJN-03) were also resistant to LDB+Mapa therapy. Interestingly, LP-1 was only partially sensitive to combination therapy (30% apoptosis); there was no statistical significance in the extent of LP-1 apoptosis induction by Mapa alone and LBM+M combination therapy.
Figure 1. Combination low dose bortezomib plus mapatumumab induce human myeloma cell apoptosis. (A) Six human myeloma cell lines were cultured for 48 h in triplicate wells in the previously determined sub-optimal btz dose, or increasing doses of Mapa (0.01–50 μg/mL) alone, or the combination of LDB+M. HMCL apoptosis was measured by annexin V binding and is presented as the mean ± SE of three separate experiments, * designates a statistical significant difference (where p = <0.05) in HMCL apoptosis between Mapa alone and the combination of Mapa and low dose bortezomib. (B) HMCL were either untreated, or treated for 24 h with LDB. TRAIL-R1 expression was determined by FACS staining. Data is shown as histogram overlays for each HMCL, and is representative of triplicate wells from three separate experiments showing constitutive TRAIL-R1 (thick black line), TRAIL-R1 after 24 h LDB treatment (dotted line), isotype control (shaded light gray) or secondary only control (dashed line). In brackets are MFI values for HMCL TRAIL-R1 expression after 24 h LDB treatment (Pre-btz) or untreated (U/T). In C, LP-1 cells were either untreated (black) or pre-treated with 5 nM Btz (white) for 24 h prior to the addition of Mapa (0.01–50 μg/mL) for 48 h. LP-1 apoptosis was measured by annexin V binding and is presented as the mean ± SE of three separate experiments, * designates a statistical significant difference (student t-test where p = <0.05) in LP-1 apoptosis between untreated versus LDB pre-treated cells.
We next asked whether sequential treatment (LDB followed by Mapa) would render the myeloma cells more sensitive to LDB+Mapa-induced apoptosis. Pre-treatment of human myeloma cell lines (HMCL) with LDB induced increased TRAIL-R1 expression (compared to untreated cells) in LP-1 and OPM-2 cells (). To explore whether this LDB pre-treatment could significantly improve LDB+Mapa-induced myeloma cell apoptosis, three HMCL's (LP-1, NCI-H929 and JJN-03) were tested as they previously showed no increase in apoptosis in response to the LDB+Mapa combination (compared to Mapa alone). Following pre-treatment with LDB, LP-1 cells were significantly more sensitive to LDB+Mapa combination therapy than when treated with combination therapy alone (). In contrast, JJN-03 and NCI-H929 cells were resistant to the two phase ‘LDB’ followed by combination therapy (data not shown).
Taken together, this data showed the combination LDB+Mapa treatment effectively induced myeloma cell apoptosis in vitro and that sequential treatment of myeloma cell lines with LDB followed by Mapa also shows promising antitumor activity.
Human dendritic cells treated with low dose bortezomib function normally
Human DC viability and function is compromised in vitro by btz,Citation28,29 this occurs from a 10 nM dose upwards (data not shown). Furthermore, a prior study using a xenotransplant model of MMCitation32 showed proteasome inhibition occurs in the peripheral tissues and lymphoid organs within 1 h of dosing. Lastly, the btz dose used in clinical practice (1.3 mg/m2/dose i.v.) results in proteasome inhibitor activity in the peripheral blood (PB), based on animal studies and antitumor activity, and this is likely the case in peripheral tissues too. We examined whether using lower dose btz combined with Mapa would retain anti-myeloma immune activity, including DC function. To do this, we performed a series of studies examining DC function in increasingly stringent drug conditions. Initially, inhibition of proteasome chymotrypsin (Ch)-like activity was assessed on LDB, Mapa or LDB+Mapa-treated monocyte-derived dendritic cells (MoDCs) (Fig. S3). This experiment showed that LDB and LDB+Mapa inhibited proteasome Ch-like activity by 10%, whereas Mapa alone had no effect.
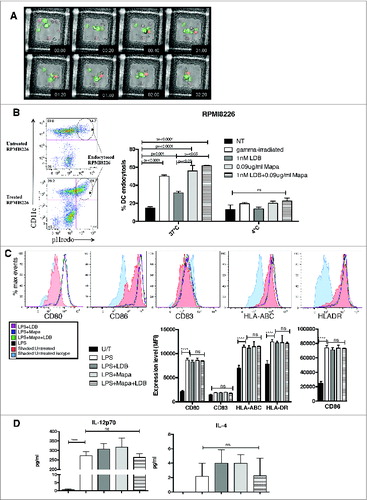
We then performed complementary studies to examine MoDC phagocytosis of apoptotic myeloma cells. First, live video microscopy was used to examine the kinetics and morphology of apoptotic myeloma (apo-MM) phagocytosis by DCs (). This study showed that Apo-MM were phagocytosed by DCs as one large body within 20 min of co-culture, and that by 40 min the Apo-MM phagosome had matured (drop in pH reflected by pHrodobright fluorescence). The pHrodobright Apo-MM remained in a mature phagosome for a further 1.5 h. Second, FACS was used to examine whether there was a quantitative difference in DC phagocytosis of Apo-MM depending on the drug used to induce MM cell apoptosis (). Thus, DCs phagocytosed untreated RPMI8226 cells (15.69 ± 2.5)%; in contrast, a significant increase in MM phagocytosis was observed when the RPMI8226 cells were pre-treated with 1 nM Btz alone, Mapa alone or LDB+Mapa (). Interestingly, pre-treatment with Mapa alone or LDB+Mapa induced a significantly higher level of DC phagocytosis compared to LDB pre-treatment alone, indicating that Mapa-mediated the dominant role in the increased DC phagocytosis observed with LDB+Mapa treated MM cells. Equivalent results were observed using treated U266 cells in the DC phagocytosis assay (Fig. S4). Next, the effect of combination drug treatment on lipopolysaccharide (LPS)-induced DC maturation was examined. Thus, when MoDCs were stimulated with LPS, there was no significant difference in DC maturation (CD80, CD86, CD83, HLA-ABC and HLADR expression levels) between untreated DCs or DCs treated with LDB, Mapa or LDB+Mapa (). There was also no significant difference in the level of IL-12p70 or IL-4 induced by LPS in the presence or absence of drug co-treatment ().
Figure 2. For figure legend, see next page. Figure 2 (See previous page). Combination LDB+M treatment of human myeloma cells induced increased MoDC cell phagocytosis, but does not affect MoDC response to the TLR ligand LPS. HMCL (U266 and RPMI8226) were labeled with the pH sensitive dye pHrodo, pre-treated with LD btz and Mapa for 48 h, then co-cultured with MoDCs (as per Methods). The kinetics of MoDC phagocytosis of apoptotic HMCLs was monitored by live video microscopy (A), then quantitated by flow cytometry (B). The effect of LDB+M combination or single drug treatment on MoDC responses to LPS were assessed in C and D. In C, changes in MoDC expression of CD80, CD86, CD83, HLA-ABC and HLADR and CD83 were investigated. Data shown is representative histogram overlays, and collated mean fluorescence intensity (MFI) data from triplicate wells of a single experiment. In D, MoDC secretion of IL-12p70 and IL-4 is shown. Data presented is either representative data from three separate experiments (A) and (C). Quantitative data in B and D is the mean ± SE for three separate experiments, p values (student t-test) are provided in B for test conditions that are significantly different to the control, and in D **** represents p < 0.0001.
Despite the immunosuppressive nature of apoptotic myeloma cells, myeloma-pulsed dendritic cells induce an anti-myeloma immune response
Whilst LDB treatment did not inhibit LPS-induced MoDC maturation, phagocytosis of apoptosis MM cells was associated with impairment of DC maturation. Prior co-culture of DCs with LDB+Mapa-treated U266 or RPMI8226 cells significantly inhibited LPS-induced DC maturation (Fig. S5), as assessed by CD80, CD83 and CD86 expression. LPS-induced MoDC CD80 and CD86 expression was more significantly inhibited by Apo-RPMI8226 (p < 0.01) than by Apo-U266 (p < 0.05).
Using this information, a modified in vitro expansion culture of anti-MM lymphocytes was devised using either no myeloma cells, untreated U266, or LDB+Mapa treated U266 as an antigen source. Furthermore, U266-pulsed DCs were then either treated with LDB+Mapa or LPS. Autologous peripheral blood mononuclear cells (PBMCs) were added to the MM-pulsed MoDCs for 7 d, and anti-myeloma cytotoxic lymphocyte (AMCL) expansion performed (as per methods) for a further 14 d. The MM killing assay showed untreated or LDB+Mapa-treated U266 suppressed the ability of DCs to induce expansion of an anti-MM cytotoxic response (). In contrast, a significant expansion of MM-specific CTLs occurred when Apo-U266-pulsed DCs were also treated with LDB+Mapa during the priming phase of the culture (). The level of CTL expansion was similar to that observed when Apo-U266-pulsed DCs were activated with LPS (). This cytotoxic response was specific to the HMCL, since autologous PBMCs were not lysed by effector cells (). In addition, the AMCL expansion required DCs pulsed with myeloma antigen, as the ‘no antigen’ DC control did not induce AMCL effectors ().
Figure 3. Combination LDB+M induced increased effector cell killing of human myeloma cells. HLA-A2*01 MoDCs were pulsed with apoptotic U266 cells (induced by LDB+M treatment) in the presence or absence of LDB+M. MM pulsed-DCs were then cultured with autologous PBMCs and the responder T cells expanded for 21 d in vitro (see Methods for details). The expansion of MM-specific effector cells was then assessed by CTL assay using Cr-labeled U266 cells as targets. Data presented is the percentage lysis (mean ± SE) of targets for three separate experiments on four HLA-A2*01 donors. Data series include four separate test conditions in the in vitro culture. These include DC pulsed with untreated or treated U266, DC pulsed with treated U266 in the presence of btz+Mapa, DC pulsed with treated U266 and then matured with LPS. Additional controls included ‘unloaded DC’ used at the priming phase in the culture (but U266 as targets in the killing assay), or control targets (autologous PBMC control) to show specificity of the AMCL response. A statistical (student t-test) difference in U266 lysis between the test and control combinations was shown, where * p < 0.05, and ** p < 0.01.
LDB+Mapa combination therapy does not exert the immune-modulating effect via a direct effect on dendritic cells or by differential induction of TRAIL-R1 on immune subsets
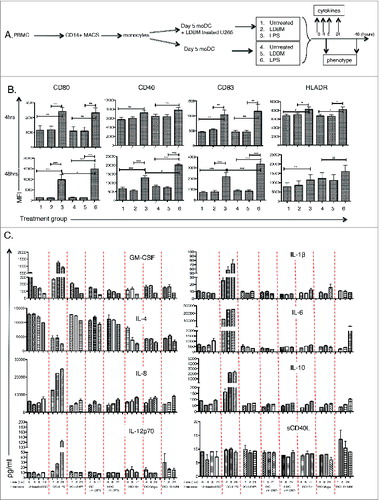
To explore the mechanism/s whereby LDB+Mapa expanded AMCLs, we first examined the direct effect of LDB+Mapa on MoDC function. We know that MoDC effectively phagocytose LDB+Mapa treated MM cells; however, does this facilitate MoDC maturation/licensing in the absence of a toll-like receptor (TLR)-mediated signal? To address this question, we assessed whether MoDC maturation was affected by co-treatment with LDB-Mapa in the presence or absence of U266 MM cells (as depicted in ). We examined MoDC CD80, CD83, CD40 and HLADR expression levels at 4 and 48 h after initiation of LDB+Mapa treatment. In the absence of LPS, we showed no change in MoDC maturation kinetics in the context of LDB+Mapa alone (), whether the MoDCs were also pulsed with U266 or not. In the presence of LPS, MoDCs up-regulated CD80, CD40, CD83 and HLADR by 48 h, this response (CD80, CD83 and CD40) was significantly decreased when the MoDCs were first pulsed with LDB+Mapa-treated U266 (). In addition, we explored whether the LDB+Mapa co-treatment could directly alter MoDC-secreted cytokine levels. To address this, drug treated MoDC culture supernatant was collected at early and late timepoints (0, 4,8 and 24 h) and a cytokine bead array performed for GM-CSF, IL-4, IL-6, IL-12p70, IL-1β, IL-6, IL-10 and sCD40L levels (). We showed the LPS control MoDCs secreted increased levels of all cytokines except IL-4. In the absence of LPS, apo-U266 pulsed MoDCs secreted higher levels of IL-4 than non-pulsed MoDCs. This was true whether the MoDCs were also treated with LDB, Mapa or LDB+Mapa (). There was no data to indicate that LDB+Mapa treatment of MoDCs induced increased IL-12p70 or Il-1β secretion.
Figure 4. For figure legend, see next page. Figure 4 (See previous page). Combination LDB+Mapa treatment does not directly alter MoDC maturation or cytokine secretion. MoDCs were cultured with U266 myeloma cells and the effect of subsequent LDB+Mapa treatment on MoDC maturation compared to MoDCs activated with LPS. MoDCs were harvested at 4 and 24 h post drug or LPS treatment (as depicted in A) and assessed for the changes in the MoDC maturation markers CD80, CD40, CD83 and HLADR (B). Data show is protein expression assessed by FACS in mean fluorescence intensity (MFI). This is pooled data of therapy responses from three separate normal donor MoDC cultures. A statistically significant difference between test and control groups is represented by * (p < 0.05), **(p < 0.01), ***(p < 0.001). In addition, in C culture supernatant was collected from the co-cultures at 4, 8 and 24 h and cytokine levels (IL-12p70, IL-8, IL-4, GM-CSF, IL-1β, IL-6, IL-10 and sCD40 ligand) assessed by Luminex assay. In these co-culture conditions, ‘tr’ refers to cells treated with LDB+Mapa. Data is from triplicate wells of a single experiment, representative of two experiments.
An alternate potential mechanism for the LDB+Mapa-treatment effect on CTL expansion was a differential effect on the effector:suppressor ratio of T cells and their expression of TRAIL-R1, the target for Mapa. To address the latter, human PBMCs were directly treated with LDB+Mapa and TRAIL-R1 assessed at 4 and 48 hours (depicted in Fig. S6A). TRAIL-R1 expression on regulatory CD4+ T cells (Treg), CD4+ or CD8+ T cells was not affected by LDB+Mapa treatment during this 48 h time course (Fig. S6B). In addition, lymphocyte subset frequencies and their TRAIL-R1 expression were also assessed during the anti-myeloma expansion culture, using the expansion culture conditions described in Fig. S7. Data showed the percentage of different lymphocyte subsets changed during the expansion culture, although this was not specific to the LDB+Mapa treatment group. For example, NK cell percentage increased at one week after 1st restimulation; however, this was the case for all treatment groups. The percentage of TRAIL-R1+ Tregs increased in all culture conditions across the timecourse; in contrast, NK and B cells had a specific TRAIL-R1 increase in the Apo-U266 MoDC+LPS control. Taken together, in the LDB+Mapa versus other treatment groups, there was no data to indicate a relative increase in Teff or NK cell:Treg ratio, or a specific increased expression of TRAIL-R1 on these subsets.
NK cells play a key role in expansion of anti-myeloma cytotoxic lymphocytes
Having excluded an immediate direct effect of LDB+Mapa treatment on DCs, we next explored whether the LDB+Mapa-induced AMCL expansion occurred via an indirect effect at the priming phase of the culture (). We postulated that FcγR expressing NK cells or monocytes could be activated via Mapa and change the subsequent expansion of AMCL by an indirect mechanism. Thus, when NK cells (and not monocytes) were depleted at the start of the culture from the autologous PBMCs, anti-myeloma cytotoxic function was significantly decreased (). Using the 51Cr-release assay to test anti-myeloma killing capacity of the ensuing expanded cells, we showed that both T cells (U266 killing in the presence of cold K562 targets) and NK cells participated in the myeloma target killing ().
Figure 5. NK cells are required at the priming phase for efficient effector cell killing of human myeloma cells. A myeloma-specific effector cell culture was established as for . Thus, MM-pulsed MoDCs were co-cultured with autologous PBMCs for 7 d. In addition, monocytes or NK cells were depleted from the priming phase of the effector cell culture. MM-specific effector cells were expanded with re-stimulation and expansion steps up to day 21. Harvested effector cells were used in a killing assay with Cr-labeled U266 as targets (E:T = 25:1). Results presented are percentage lysis (mean ± SE), pooled data from three separate experiments. Where a statistical difference (student t-test) in U266 killing was observed ** p = <0.005, ***p = <0.0005, ****p = <0.0001.
Mapatumumab plays a key role in NK cell direct activation by LDB+Mapa-treated myeloma cells
To explore how NK cells may be affected during the AMCL expansion culture-priming phase, we examined potential direct molecular interactions between the drug-treated U266 and immune system cells, with a focus on NK cells and their activation. To do this, we first examined whether drug treatment of U266 cells affects their immunogenicity or expression of NK-activating ligands. We showed that U266 cell immunogenicity (CD80, CD83, CD86, HLA-ABC and HLA-DR levels) was not affected by single LDB, Mapa or LDB+Mapa treatment (). Furthermore, we observed that U266 cells constitutively expressed the NKG2D ligand MIC-A and low levels of the DNAM-1 ligand CD112; expression of these NK cell-activating ligands was not altered by single LDB, Mapa or combination LDB+Mapa treatment (). When the drug-treated U266 cells were then co-cultured with PBLs, NK cells were activated at both the 4 and 24 h time points (). Higher levels of NK activation were observed in wells where PBLs were co-cultured with Mapa- or LDB+Mapa-treated U266 cells, suggesting that Mapa plays the key role in mediating the LDB+Mapa mediated NK cell activation (). We also observed a lower but significant increase in NK cell activation in the context of untreated U266 cells (vs. PBL alone control), this is likely due to recognition of U266 NK activating ligands by the responding NK cell (ie.NKG2D/MIC-A and DNAM-1/CD112) ().
Figure 6. Myeloma induced activation of NK cells is increased by Mapatumumab pre-treatment. U266 myeloma cells were either untreated, or treated with LDB, Mapa or LDB+Mapa for 48 h (as per methods) and the effect of drug treatment on myeloma cell immunogenicity assessed by FACS for expression of CD80, CD86, CD83, HLA-ABC, HLA-DR (A). The effect of drug treatment on myeloma cell NK cell activating ligand expression was also investigated (B). NK activating ligands included the NKG2D ligands MIC-A, MIC-B, ULBP-1, ULBP-2,5,6 and the DNAM-1 ligands CD155 and CD112. Data is presented as representative histogram overlays for the isotype control (filled light gray), untreated (filled dark gray), Mapa (black dotted line), LDB (black line), or LDB+Mapa (black dashed line) treated U266 cells. In addition, in B a statistical comparison was made between treatment groups for NK cell activating ligand expression. In C at 48 h, the treated U266 cells were also co-cultured with HLA-A2+ PBLs. Cells were harvested at 4 (A) or 24 (B) h and the effect of drug treated myeloma cells on NK cell and T cell subset activation assessed by CD69 and CD25 expression. Data is presented for triplicate wells in a single experiment, representative of two separate experiments.
Myeloma-pulsed DCs induce NK and CD8+ T cell activation and proliferation
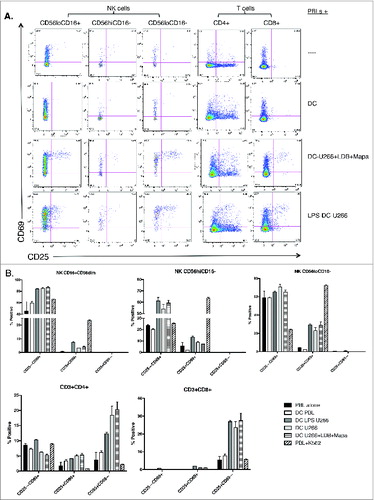
In the final phase of this study, we explored whether the MoDCs (pulsed with drug-treated U266) induced activation of NK and T cell subsets within 24 h of co-culture. To do this, U266 cells were pre-treated with LDB+Mapa for 48 h, MoDCs were pulsed with the drug-treated U266 and then co-cultured with autologous PBLs. Co-cultured cells were assessed for changes in the activation markers CD25 and CD69 at 4 and 24 h. At 24 h, MoDCs induced an increased percentage of activated (CD69+CD25– and CD69+CD25+) NK, CD4+ and CD8+ T cells when the MoDCs were pulsed with untreated U266 (+LPS) or pulsed with LDB+Mapa treated U266 (). Analysis of NK subset responses () showed an increased percentage of CD25–CD69+ cells within both the CD16+CD56+ and CD56hiCD16− NK cells when the MoDCs were pulsed with U266 cells (in the presence or absence of LDB+Mapa). In the same culture conditions, both CD4+ and CD8+ T cells showed an increased percentage of CD25+CD69− cells.
Figure 7. For figure legend, see next page. Figure 7 (See previous page). Myeloma-pulsed DCs induce increased activation of autologous NK, CD4+ and CD8+ T cells. Monocyte-derived DCs were pulsed with untreated or drug (Mapa, LDB or LDB+Mapa) treated U266 cells (as per methods) for 2 h, then co-cultured with autologous normal donor (n = 2) PBLs for a further 24 h. Cells were collected at 4 and 24 h, and activation of NK cells and T cell subsets assessed by CD69 and CD25 expression. Data presented in A are representative dot plots of NK and T cell activation in cultures from a single normal donor. Shown are PBL alone, PBL+DC, PBL+U266 pulsed MoDC (where U266 were pre-treated with LDB+Mapa), and PBL+U266 pulsed MoDC in the context of 1 μg/mL LPS. Collated data in B is from duplicate co-culture wells (single normal donor representative of two normal donor experiments) and shows the percentage of CD25−CD69+, CD25+CD69+ and CD25+CD69− cells in NK cell subsets, CD4+ and CD8+ T cells.
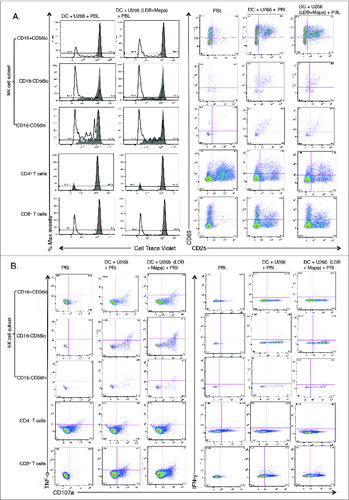
Having revealed that U266 pulsed MoDCs activated NK and T cell subsets within the first 24 h of the co-culture with autologous PBLs, we next explored whether these activated cells proliferated over 7 d of culture. To do this, we labeled the autologous PBLs with Cell Trace Violet (CTV) and examined NK and T subset proliferation by CTV dilution assay plus their activation status. This study revealed that all NK cell subsets and CD8+ T cells, (but not CD4+ T cells) undergo increased proliferation when co-cultured with MoDCs pulsed with U266, either after LDB+Mapa pre-treatment or with LPS activation (). In the same co-cultures, all NK cell subsets and CD8+ T cells had an increased percentage of CD25+cells, this correlated with increased proliferation in the context of U266-pulsed MoDCs (). Interestingly, CD4+ T cells displayed a marked increase in the percentage of CD25+cells when PBLs were cultured alone, this decreased when the PBLs were co-cultured with U266 pulsed MoDCs. In addition, day 7 expanded cells from the co-culture were also re-stimulated with U266 cells to assess effector function status at this time point (). To assess the functional status of these activated proliferating NK and T cells, we co-cultured the cells with either LDB+Mapa-treated or untreated U266 cells for a 4 h period and assessed whether they degranulated (CD107a), and/or secreted cytokines. The LDB+Mapa treated or untreated myeloma cells induced NK cell subset and CD8+ T cell degranulation (CD107a+), a subset of these cells also produced IFNγ and TNF-α (). This shows the U266-pulsed MoDCs induce effector NK and CD8+ T cells; in these culture conditions, there was no apparent difference in responses by these cells when re-stimulated in the context of untreated or LDB+Mapa-treated U266.
Figure 8. For figure legend, see next page. Figure 8 (See previous page). Myeloma-pulsed DCs induce increased proliferation of NK cells, CD4+ and CD8+ T cells. Monocyte-derived DCs were pulsed with untreated or drug (Mapa, LDB or LDB+Mapa) treated U266 cells (as per methods) for 2 h, then co-cultured with autologous normal donor (n = 2) PBLs (pre-labeled with Cell trace Violet, CTV) for 7 d. Cells were harvested, labeled with conjugated antibodies and analyzed on the FACS. In A, the proliferation and activation status of NK and T cell subsets was shown by gating first on lineage markers (NK subsets: CD56hiCD16−, CD16-CD56lo,CD56loCD16+, and T cells CD3+CD4+and CD3+CD8+) followed by CTV dilution (left panels) or CD69,CD25 expression (right panels). Cell proliferation data is shown as individual histogram overlays with the PBL alone control (filled light gray) with the test groups (thick black line) either PBL+U266-pulsed MoDC or PBL+U266 pulsed MoDC (where U266 were pre-treated with LDB+Mapa). In B day 7 cells were recovered from the co-culture and stimulated by co-culture for 4 h, cells were stained for activation markers (CD25,CD69), degranulation (CD107a), and cytokines (IFNγ and TNF-α). Data is presented as dot plots showing CD107a expression and TNF-α (left panel) or IFNγ (right panel) production by NK or T cell subsets.
In summary, LDB+Mapa treatment of myeloma-pulsed DCs induces a powerful CTL response, this does not occur via a direct effect on DCs, effector T cells or Tregs. Rather Mapa has two distinct modes of action which co-opt the immune system indirectly. First, Mapa induces NK cell activation within 24 h of contact with LDB+Mapa treated myeloma cells. Second, Mapa promotes DC phagocytosis of LDB+Mapa treated myeloma cells. We also know there is an ensuing antigen-specific response by both NK and CD8+ T cells within 24 h and proliferation by 7 d to produce fully functional effector cells.
Discussion
Until recently, it has proven difficult to develop effective immunotherapies against MM. This is in part due to the absence of effective myeloma targeting antibodies. Recently, two monoclonal antibodies, Elotuzumab (anti-SLAMF7) and Daratumumab (anti-CD38), have shown pre-clinical and early clinical trial success. Whilst both clearly rely on NK cell function to induce maximal plasma cell apoptosis, little is known about their downstream ability to induce immunogenic cell death and prime cytotoxic cellular immunity. We show that the agonistic TRAIL-R1 antibody Mapa may also act as a myeloma-targeting antibody. We revealed that Mapa has at least two distinct modes of anti-myeloma activity. First, Mapa induces myeloma cell apoptosis directly, which is increased via pre- or concurrent treatment with LDB. These results compare favorably to studies where Mapa was used in vitro to induce HMCL and primary myeloma cell death.Citation25,33
Secondly, we show that Mapa induced plasma cell killing elicited a powerful anti-myeloma cytotoxic response. Critically, this anti-myeloma CTL expansion occurred optimally when both Mapa and NK cells were present during the priming phase. Indeed, compared to LDB treatment, Mapa-treated myeloma cells significantly increased NK cell activation and led to the maximal uptake of apoptotic cells by DCs, which in turn resulted in reproducible expansion and activation of cytotoxic CD4+ and CD8+ T cells.
Prior studies have shown that apoptotic myeloma cells inhibit LPS-induced DC maturation due to a combination of IL-10, TGF-β and VEGF inducing activated phospho-STAT-3.Citation34,35 Our study confirms this observation. However, despite this, when autologous PBMCs were primed in a co-culture system containing LDB+Mapa, myeloma targets, PBMC and DCs, an expanded population of myeloma-specific cytotoxic cells was consistently generated. The importance of NK cells during the co-culture priming phase suggests cross-talk between NK cells and the Apo-MM pulsed DCs. It is known that NK-DC cross talk involves a number of mechanisms including soluble factors IL-12, IL-18, IL-15 and type I interferon and contact-dependent signals (NKG2DL-NKG2D, GITRL-GITR, LFA1-ICAM1),Citation36 which can have a dramatic effect on the functional capacity of the DC and ensuing T and NK cell responses. We did not see any effect of LDB+Mapa treatment on cytokine secretion by MoDCs in the context of treated myeloma cells. However, this does not exclude the possibility that the cross-talk occurs between NK cells and DCs at a later time point in our culture system. It is likely the NK cells are initially activated via interactions between activating receptors and activating ligands expressed on myeloma cells. In addition, Mapa-bound to either apoptotic or viable myeloma cells will be bound by NK cell FcγRIII. The net effect of these interactions is increased NK cell activation, degranulation and production of cytokines,Citation37 including IFNγ, which has a DC licensing effect.Citation38 This DC licensing is likely to have occurred following cross-talk with activated NK cells present within the culture.Citation39,40 Whilst FcγR-mediated phagocytosis of antigen is known to be an efficient pathway by which to load DCs with antigenCitation41,42 induction of an antigen-specific T cell response requires a further licensing signal for the DCs. In our study, this is efficiently achieved by Mapa-activated NK cells providing a DC licensing signal.
Taken together, our study showed Mapa is a novel anti-myeloma antibody that has multiple effector arms. The rational combination with LDB enhanced optimal myeloma cell apoptosis leading to effective immunogenic cell death mediated by preserved DC function and NK cell mediated licensing. Our study provides a strong rationale for the application of LDB+Mapa in clinical trials of MM immunotherapy.
Methods and Materials
Cell lines and materials
Human myeloma cell lines RPMI8226, U266 and NCI-H929 cell lines were obtained from American Type Cell Collection (ATCC); LP-1, OPM-2, and JJN-03 cell lines were from DSMZ (Braunschweig, Germany). Cell lines were cultured in RPMI1640 supplemented with 10% heat-inactivated fetal bovine serum and 2 mM L-glutamine. btz was from Millenium Pharmaceuticals, MA; Mapa from Human Genome Sciences Inc., NJ; Annexin V-FITC, 7-AAD, anti-mouse Ig-PE, the monoclonal antibodies CD11c-PECy7, CD83-APC and HLADR-FITC were from BD Biosciences, CA and the IL-12p70 EIA kit from BD PharMingen, CA. pHrodoTM (Invitrogen, Carlsbad, CA); lipopolysaccharide (from E.coli, SIGMA ALDRICH, St Louis, Mo).
Myeloma therapy experiments
Myeloma cells (2 × 10⁶/mL) were treated with mono- or combination therapy for 48 h in 24 well plates. Initially, drugs were used as monotherapy including btz (0–10 nM) or Mapa (0–10 μg/mL) and apoptosis induction assessed. To do this, after 48 h treatment, cells were harvested, washed once in Dulbecco's PBS and then stained with Annexin V-FITC and 7AAD for 10 min at room temperature. Stained cells were then analyzed on the BD LSRII flow cytometer. For combination therapy, myeloma cell lines were treated with the highest dose of btz that did not induce apoptosis (termed ‘low dose’, this dose was established from the monotherapy titration) combined with titrated amounts of Mapa (from 0–10 μg/mL) for 48 h prior to evaluation of myeloma cell apoptosis.
Combination Mapa and low dose bortezomib therapy do not inhibit dendritic cell function
MoDCs were established from fresh PB monocytes as described previously.Citation43,44 Briefly, purified monocytes were cultured for 5 d in 10 ng/mL IL-4 and 20 ng/mL GM-CSF (Peprotech, NJ), the media was renewed at day 3. On day 5, non-adherent cells were removed by gentle aspiration from the culture flask and the purity of immature MoDCs checked by FACS using the phenotype CD11chi/CD14−/CD11bint.
DC phagocytosis of treated myeloma cells
MoDCs were harvested from the above cultures and used for myeloma cell phagocytosis assays. To induce myeloma cell apoptosis, RPMI8226 were either γ-irradiated (30 Gy), or treated with 1 nM btz alone, 0.9 μg Mapa alone or a combination of both drugs for 48 h. Treated myeloma cells were stained with 0.5 μg/mL pHrodo, washed with PBS twice before co-culture with MoDCs (1:2 myeloma:DC ratio) for 4 h at 37°C. A negative control co-culture was also performed at 4°C. Harvested cells were then stained with anti-CD11c-PECy7 and Fluorogold (Invitrogen); stained cells were analyzed on the BD LSRII flow cytometer, 5000 CD11chi events were collected and the frequency of CD11chi/pHrodohi collected. In other experiments, the MoDC myeloma cell phagocytosis assay was performed in the presence of 1 nM btz. pHrodoTM is a pH sensitive dye and undergoes a quantum yield in red fluorescence when stained apoptotic bodies are processed to the low pH environment of an endosome. Thus, cells that are CD11chi/pHrodohi are MoDCs with endocytosed myeloma cells and CD11chi/pHrodolo are likely MoDCs with adherent myeloma apoptotic bodies. To verify that the FACS data did indeed represent MoDC phagocytosis of treated myeloma cells we examined an aliquot of the same cells by fluorescent live video microscopy. To do this, apoMM-pulsed MoDCs (1 × 10⁵) were added to optimally manufactured grids [125 μm (l) × 125 μm (w) × 60 μm (h)], which are individual paddocks designed to contain the cells within the microscope field of view (as described previouslyCitation45 The grids were then placed in imaging chamber slides (Ibidi, DKSH, Martinsried, Germany). Images were taken on the Leica SP5 confocal microscope (Leica, Wetzlar, Germany). Voltage gain, offset and focus were set on compensation wells before the first image was taken. DCs were then added to wells and positions were selected to maximise the wells in the field of view with DCs clearly visible. The tumor target cells were added (2 × 10⁵) just prior to the image sequence starting. Images were taken at each position every 4–5mins for 3–4 h. The objective of the microscope was 20×. The images were collated and analyzed using Metamorph Software (MDS Analytical Technologies, Downington USA), which allows single frame images to be viewed as a multi-frame video.
LPS-induced DC responses
MoDCs were cultured with 1 μg/mL LPS for 48 h at 37°C in the presence or absence of 1 nM btz. MoDCs were harvested and stained with antibodies to CD11c, CD83 and HLA-DR, cells were analyzed on the BDLSRII flow cytometer to examine upregulation of CD83 and HLA-DR as an indicator of LPS-induced MoDC maturation. In addition, culture supernatant was collected at 48 h of LPS treatment and an IL-12p70 assay performed (as per manufacturer's instructions).
DC proteasome activity assay (chymotrypsin-like functional subunit)
MoDCs were cultured (as described above), proteasomes were extracted from the DCs and treated with 1 nM btz alone, 1 μg/mL Mapa alone or a combination of both drugs for 4 h at 37°C. Treated proteasomes were pelleted and then a Ch-like proteasome assay performed (Millipore), as per manufacturer's instructions, andCitation46,47 using Suc-Leu-Leu-Val-Tyr-MCA as the 20S proteasome substrate.
Expansion of myeloma-specific cytotoxic lymphocytes in vitro and detection of cytotoxic function
U266 myeloma cells were either untreated, or treated with LDB+Mapa for 48 h to induce apoptosis (Apo-U266). U266 or Apo-U266 cells were washed twice in RPMI1640 containing 10% fetal bovine serum, complete medium (CM). MoDCs (HLA-A2*01 normal donor) were pulsed with either untreated or Apo-U266 cells for 4 h in the presence or absence of LDB+Mapa. Subsequently, the U266-pulsed MoDCs were co-cultured with autologous PBMCs for 7 d in CM containing 20 U/mL IL-2, 10 ng/mL of IL-7 and IL-15 (priming phase). On days 7 and 14, cells were harvested and re-stimulated with autologous myeloma-pulsed MoDCs, expansion of CTL during these time points occurred in CM supplemented with 25 U IL-2. On day 21, cells were harvested and their anti-myeloma activity assessed by a chromium-release assay. Controls for the CTL expansion culture include unpulsed MoDCs, or U266-pulsed MoDCs that were activated with 1 μg/mL LPS. Chromium-release assay was performed as described previously.Citation9 Briefly, chromium-labeled U266 cells were cultured (in triplicate wells) with effector cells from the CTL expansion culture at an effector-target ratio (E:T) from 6.25 to 50:1. After 4 h, culture supernatant was collected from each well and the amount of Cr released by U266 cells measured on a γ-counter (Wallac Wizard 1470, Perkin Elmer, MA, USA). The amount of U266 cell death (percentage lysis) was compared to total U266 Cr-release wells (U266 plus 2M HCl). Thus, percentage lysis was calculated using the formula (mean cpm – spontaneous cpm)/total cpm. To assess the contribution of different effector cells (NK versus T cell) to the killing of U266 cells, a ‘cold target assay’ was performed. To do this, the Cr-release assay was performed as above, except that in addition to the Cr-labeled U266 cells, equal numbers of unlabeled K562 cells (the cold target) were included. To assess the relative importance of NK cells or monocytes at the priming phase of the CTL expansion culture, NK cells (CD3−/CD56+) or monocytes (CD14+) were removed from the autologous PBMCs by FACS-sorting, purity was >95%. The NK- or monocyte-depleted PBMCs were then co-cultured with MM-pulsed MoDCs as above.
Direct effect of LDB±Mapa treatment on MoDC maturation and cytokine secretion
Day five MoDCs were divided into two groups, one was unpulsed and the other pulsed with LDB+Mapa treated U266 myeloma cells for 4 h. Both MoDC groups were then each further dissected into three arms (either untreated, treated with LDB+Mapa or 1 μg/mL LPS) and cultured for 48 h as depicted in . LDB+Mapa treatment comprised 1 nM btz and 1 μg/mL Mapa. Cells were harvested at 4 and 48 h to assess MoDC maturation at an early vs. late timepoint. Maturation was assessed by FACS following labeling with antibodies to CD80, CD40, CD83 and HLADR. In addition, culture supernatant was harvested at 0, 4, 8 and 24 h and a multiplex Luminex assay performed to assess changes in cytokine levels (GM-CSF, IL-4, IL-8, IL-12p70, IL-1β, IL-6, IL-10 and sCD40L) in response to the drug treatment.
Effect of drug treatment on human myeloma cell immunogenicity and NK-activating ligand expression levels
U266 and RPMI8226 myeloma cells were either untreated, or treated with LDB, Mapa or LDB+Mapa for 48 h (as per methods above) and the effect of drug treatment on myeloma cell immunogenicity assessed. Treated myeloma cells were labeled with antibodies to CD80-FITC, CD86-PE, CD83-APC, HLA-DR-APC-H7 (all from BD Biosciences) and HLA-ABC-V450 (e-Bioscience) and changes in protein expression detected by FACS analysis. In addition, treated myeloma cells were labeled with the antibodies CD155-FITC, MIC-A-PE, MIC-B-APC, CD112-FITC, ULBP-2,5,6-APC, ULBP-1-PE (all RnD Systems) and changes in NK-activating ligand expression assessed by FACS analysis.
Assessment of direct activation of NK and T cells by drug treated myeloma cells
Drug-treated U266 cells (prepared as above) were harvested at 48 h, washed twice in media and then co-cultured with HLA-A2+ PBLs. The PBLs from two normal donors were co-cultured with treated U266 cells in separate cultures in triplicate wells. Cells were harvested 4 or 24 h later and labeled with antibodies to CD45-BV510, CD3-BV711, CD4-BV605 (Biolegend) CD14- and CD19-APCH7, CD56-PE, CD8-PECy5.5, CD25-APC, CD69-PECy7 (BD Biosciences). Labeled cells were then analyzed by FACS, and co-culture induced activation of NK or T cell subsets assessed following a devised gating strategy depicted in Fig. S8.
Detection of NK or T cell subset activation following co-culture with myeloma-pulsed MoDCs
Day 5 MoDCs were pulsed with drug-treated U266 cells at a 1:1 ratio as in the protocol for CTL expansion culture (see above). After 4 h, cells were washed twice and left overnight. Recovered autologous PBLs were washed, counted and added to the pulsed MoDCs at a 5:1 ratio. Co-cultured cells were recovered 4 and 24 h later. Four hours prior to each timepoint, Golgi stop and CD107a-PeCy5 (BD) antibody were added to the appropriate wells for intracellular staining. Cells were washed and stained for NK, CD4 and CD8 T cell markers (CD3-BV711, CD4-BV605 (both Biolegend), CD56-PECy7, CD8-PerCPCy5.5, CD14/CD19-APCH7, CD16-PE (all BD Biosciences). Cells were then fixed and permeabilized (BD Cytofix/Cytoperm) before staining for intracellular cytokines (TNFα-APC and IFNγ-FITC (both BD Biosciences). In addition, for activation status, appropriate wells were stained with a separate antibody panel for NK, CD4 and CD8 T cell markers combined with activation markers (CD3-BV711, CD4-BV605 (Biolegend), CD8-PerCPCy5.5, CD14/CD19-APCH7, CD56-PE, CD16-FITC, CD69-PECy7, CD25-APC (BD Biosciences). Labeled cells were acquired on the BD Fortessa FACS analyzer, FACS data was then analyzed using FlowJo analysis software and a gating strategy (depicted in Fig. S9) to derive the percentage of NK and T cell subsets expressing activation markers (CD25 and CD69), the degranulation marker (CD107a) and cytokines IFNγ and TNF-α.
Detection of NK or T cell subset proliferation following co-culture with myeloma-pulsed MoDCs
Day 5 MoDCs were pulsed with drug-treated U266 cells at a 1:1 ratio as in the protocol for CTL expansion culture (as described above). After 4 h, cells were washed twice with culture media and left overnight. Autologous PBLs (from two separate normal donors) were washed, counted and stained with 2.5uM CTV (Life Technologies) for 20 min, washed and added to the myeloma pulsed MoDCs and cultured for 7 d at a 5:1 ratio in 0.5 mL RPMI1640 plus 10% FCS, IL-2 (20 U/mL) in 48-well plates. On day 4, culture media was replaced with fresh RPMI plus 10% FCS and low dose IL-2 (20 U/mL). Co-cultured cells were harvested on day 7 and stained for NK, CD4, CD8 T cell and activation markers (CDD3-BV785, CD4-BV605 (both from Biolegend), CD8-PerCP Cy5.5, CD14/CD19-APCH7, CD16-FITC, CD56-PE, CD69-PECy7, and CD25-APC (all from BD Biosciences). Cells were analyzed by FACS and the level of activation and proliferation assessed on NK and T cell subsets using the same gating strategy depicted in Fig. S9.
Detection of expansion culture NK and T cell effector status
Day 7 co-cultured cells (from above) were re-stimulated with antigen (untreated or treated U266 cells) for 4 h prior to staining. Golgi stop and CD107a-PeCy5 (BD) antibody were added to the appropriate wells. Staining panels were the same as for the NK, CD4 and CD8 activation protocol (above).
Disclosure of Potential Conflicts of Interest
No potential conflicts of interest were disclosed.
Supplemental Material
Supplemental data for this article can be accessed on the publisher's website.
Ethics Statement
Normal donor cells were acquired from Red Cross Blood Bank donors following approval from the Peter MacCallum Cancer Center Human Ethics Committee.
1038011_supplemental_files.zip
Download Zip (24.7 MB)Funding
This work was completed with funding from Human Genome Sciences Inc. and National Health and Medical Research Council of Australia (program grants 454569 and 1013667).
References
- Attal M, Harousseau JL. Autologous peripheral blood progenitor cell transplantation for multiple myeloma. Baillieres Best Pract Res Clin Haematol 1999; 12:171-91; PMID:11000991; http://dx.doi.org/10.1053/beha.1999.0015
- Child JA, Morgan GJ, Davies FE, Owen RG, Bell SE, Hawkins K, Brown J, Drayson MT, Selby PJ. High-dose chemotherapy with hematopoietic stem-cell rescue for multiple myeloma. N Engl J Med 2003; 348:1875-83; PMID:12736280; http://dx.doi.org/10.1056/NEJMoa022340
- Palumbo A, Anderson K. Multiple myeloma. N Engl J Med 2011; 364:1046-60; PMID:21410373; http://dx.doi.org/10.1056/NEJMra1011442
- Ocio EM, Richardson PG, Rajkumar SV, Palumbo A, Mateos MV, Orlowski R, Kumar S, Usmani S, Roodman D, Niesvizky R et al. New drugs and novel mechanisms of action in multiple myeloma in 2013: a report from the international myeloma working group (IMWG). Leukemia 2014; 28:525-42; PMID:24253022; http://dx.doi.org/10.1038/leu.2013.350
- Donato F, Gay F, Bringhen S, Troia R, Palumbo A. Monoclonal antibodies currently in Phase II and III trials for multiple myeloma. Expert Opin Biol Ther 2014; 14:1127-44; PMID:24749510; http://dx.doi.org/10.1517/14712598.2014.908848
- Brimnes MK, Svane IM, Johnsen HE. Impaired functionality and phenotypic profile of dendritic cells from patients with multiple myeloma. Clin Exp Immunol 2006; 144:76-84; PMID:16542368; http://dx.doi.org/10.1111/j.1365-2249.2006.03037.x
- Schutt P, Brandhorst D, Stellberg W, Poser M, Ebeling P, Muller S, Buttkereit U, Opalka B, Lindemann M, Grosse-Wilde H et al. Immune parameters in multiple myeloma patients: influence of treatment and correlation with opportunistic infections. Leuk Lymphoma 2006; 47:1570-82; PMID:16966269; http://dx.doi.org/10.1080/10428190500472503
- Chan AC, Neeson P, Leeansyah E, Tainton K, Quach H, Prince HM, Harrison SJ, Godfrey DI, Ritchie D, Berzins SP. Natural killer T cell defects in multiple myeloma and the impact of lenalidomide therapy. Clin Exp Immunol 2014; 175:49-58; PMID:24032527; http://dx.doi.org/10.1111/cei.12196
- Hsu AK, Quach H, Tai T, Prince HM, Harrison SJ, Trapani JA, Smyth MJ, Neeson P, Ritchie DS. The immunostimulatory effect of lenalidomide on NK-cell function is profoundly inhibited by concurrent dexamethasone therapy. Blood 2011; 117:1605-13; PMID:20978269; http://dx.doi.org/10.1182/blood-2010-04-278432
- Rapoport AP, Stadtmauer EA, Aqui N, Badros A, Cotte J, Chrisley L, Veloso E, Zheng Z, Westphal S, Mair R et al. Restoration of immunity in lymphopenic individuals with cancer by vaccination and adoptive T-cell transfer. Nat Med 2005; 11:1230-7; PMID:16227990; http://dx.doi.org/10.1038/nm1310
- Tesniere A, Apetoh L, Ghiringhelli F, Joza N, Panaretakis T, Kepp O, Schlemmer F, Zitvogel L, Kroemer G. Immunogenic cancer cell death: a key-lock paradigm. Curr Opin Immunol 2008; 20:504-11; PMID:18573340; http://dx.doi.org/10.1016/j.coi.2008.05.007
- Hsi ED, Steinle R, Balasa B, Szmania S, Draksharapu A, Shum BP, Huseni M, Powers D, Nanisetti A, Zhang Y et al. CS1, a potential new therapeutic antibody target for the treatment of multiple myeloma. Clin Cancer Res 2008; 14:2775-84; PMID:18451245; http://dx.doi.org/10.1158/1078-0432.CCR-07-4246
- Tai Y-T, Dillon M, Song W, Leiba M, Li X-F, Burger P, Lee AI, Podar K, Hideshima T, Rice AG et al. Anti-CS1 humanized monoclonal antibody HuLuc63 inhibits myeloma cell adhesion and induces antibody-dependent cellular cytotoxicity in the bone marrow milieu. Blood 2008; 112:1329-37; PMID:17906076; http://dx.doi.org/10.1182/blood-2007-08-107292
- de Weers M, Tai YT, van der Veer MS, Bakker JM, Vink T, Jacobs DC, Oomen LA, Peipp M, Valerius T, Slootstra JW et al. Daratumumab, a novel therapeutic human CD38 monoclonal antibody, induces killing of multiple myeloma and other hematological tumors. J Immunol 2011; 186:1840-8; PMID:21187443; http://dx.doi.org/10.4049/jimmunol.1003032
- Nijhof IS, Groen RW, Noort WA, van Kessel B, de Jong-Korlaar RA, Bakker JM, Lammerts-van Bueren JJ, Parren PW, Lokhorst HM, van de Donk NW et al. Preclinical evidence for the therapeutic potential of CD38-targeted immuno-chemotherapy in multiple myeloma patients refractory to lenalidomide and bortezomib. Clin Cancer Res 2014; 21(12):1–9; PMID:25398450
- van der Veer MS, de Weers M, van Kessel B, Bakker JM, Wittebol S, Parren PW, Lokhorst HM, Mutis T. Towards effective immunotherapy of myeloma: enhanced elimination of myeloma cells by combination of lenalidomide with the human CD38 monoclonal antibody daratumumab. Haematologica 2011; 96:284-90; PMID:21109694; http://dx.doi.org/10.3324/haematol.2010.030759
- Jakubowiak AJ, Benson DM, Bensinger W, Siegel DS, Zimmerman TM, Mohrbacher A, Richardson PG, Afar DE, Singhal AK, Anderson KC. Phase I trial of anti-CS1 monoclonal antibody elotuzumab in combination with bortezomib in the treatment of relapsed/refractory multiple myeloma. J Clin Oncol 2012; 30:1960-5; PMID:22291084; http://dx.doi.org/10.1200/JCO.2011.37.7069
- Lonial S, Vij R, Harousseau JL, Facon T, Moreau P, Mazumder A, Kaufman JL, Leleu X, Tsao LC, Westland C et al. Elotuzumab in combination with lenalidomide and low-dose dexamethasone in relapsed or refractory multiple myeloma. J Clin Oncol 2012; 30:1953-9; PMID:22547589; http://dx.doi.org/10.1200/JCO.2011.37.2649
- Lokhorst HM, Laubach J, Nahi H, Plesner T, Gimsing P, Hansson M, Minnema M, Lassen UN, Krejcik J, Ahmadi T et al. Dose-dependent efficacy of daratumumab (DARA) as monotherapy in patients with relapsed or refractory multiple myeloma (RR MM). ASCO Meet Abs 2014; 32:8513
- Plesner T, Arkenau H-T, Lokhorst HM, Gimsing P, Krejcik J, Lemech CR, Minnema M, Lassen UN, Ahmadi T, Yeh H et al. Safety and efficacy of daratumumab with lenalidomide and dexamethasone in relapsed or relapsed, refractory multiple myeloma. ASCO Meet Abstr 2014; 32:8533
- Ashkenazi A, Pai RC, Fong S, Leung S, Lawrence DA, Marsters SA, Blackie C, Chang L, McMurtrey AE, Hebert A et al. Safety and antitumor activity of recombinant soluble Apo2 ligand. J Clin Invest 1999; 104:155-62; PMID:10411544; http://dx.doi.org/10.1172/JCI6926
- Evdokiou A, Bouralexis S, Atkins GJ, Chai F, Hay S, Clayer M, Findlay DM. Chemotherapeutic agents sensitize osteogenic sarcoma cells, but not normal human bone cells, to Apo2L/TRAIL-induced apoptosis. Int J Cancer 2002; 99:491-504; PMID:11992538; http://dx.doi.org/10.1002/ijc.10376
- Kothny-Wilkes G, Kulms D, Poppelmann B, Luger TA, Kubin M, Schwarz T. Interleukin-1 protects transformed keratinocytes from tumor necrosis factor-related apoptosis-inducing ligand. J Biol Chem 1998; 273:29247-53; PMID:9786937; http://dx.doi.org/10.1074/jbc.273.44.29247
- Lawrence D, Shahrokh Z, Marsters S, Achilles K, Shih D, Mounho B, Hillan K, Totpal K, DeForge L, Schow P et al. Differential hepatocyte toxicity of recombinant Apo2L/TRAIL versions. Nat Med 2001; 7:383-5; PMID:11283636; http://dx.doi.org/10.1038/86397
- Menoret E, Gomez-Bougie P, Geffroy-Luseau A, Daniels S, Moreau P, Le Gouill S, Harousseau JL, Bataille R, Amiot M, Pellat-Deceunynck C. Mcl-1L cleavage is involved in TRAIL-R1- and TRAIL-R2-mediated apoptosis induced by HGS-ETR1 and HGS-ETR2 human mAbs in myeloma cells. Blood 2006; 108:1346-52; PMID:16638930; http://dx.doi.org/10.1182/blood-2005-12-007971
- Mitsiades CS, Treon SP, Mitsiades N, Shima Y, Richardson P, Schlossman R, Hideshima T, Anderson KC. TRAIL/Apo2L ligand selectively induces apoptosis and overcomes drug resistance in multiple myeloma: therapeutic applications. Blood 2001; 98:795-804; PMID:11468181; http://dx.doi.org/10.1182/blood.V98.3.795
- Belch A, Sharma A, Spencer A, Tarantolo S, Bahlis NJ, Doval D, Gallant G, Kumm E, Klein J, Chanan-Khan AA. A multicenter randomized phase II trial of mapatumumab, a TRAIL-R1 agonist monoclonal antibody, in combination with bortezomib in patients with relapsed/refractory multiple myeloma (MM). ASH Ann Meet Abstr 2010; 116:5031
- Straube C, Wehner R, Wendisch M, Bornhauser M, Bachmann M, Rieber EP, Schmitz M. Bortezomib significantly impairs the immunostimulatory capacity of human myeloid blood dendritic cells. Leukemia 2007; 21:1464-71; PMID:17495970; http://dx.doi.org/10.1038/sj.leu.2404734
- Subklewe M, Sebelin-Wulf K, Beier C, Lietz A, Mathas S, Dorken B, Pezzutto A. Dendritic cell maturation stage determines susceptibility to the proteasome inhibitor bortezomib. Hum Immunol 2007; 68:147-55; PMID:17349869; http://dx.doi.org/10.1016/j.humimm.2006.12.005
- Blanco B, Pérez-Simón JA, Sánchez-Abarca LI, Carvajal-Vergara X, Mateos J, Vidriales B, López-Holgado N, Maiso P, Alberca M, Villarón E et al. Bortezomib induces selective depletion of alloreactive T lymphocytes and decreases the production of Th1 cytokines. Blood 2006; 107:3575-83; PMID:16282346; http://dx.doi.org/10.1182/blood-2005-05-2118
- Chanan-Khan A, Sonneveld P, Schuster MW, Stadtmauer EA, Facon T, Harousseau J-L, Ben-Yehuda D, Lonial S, Goldschmidt H, Reece D et al. Analysis of herpes zoster events among bortezomib-treated patients in the phase III APEX study. J Clin Oncol 2008; 26:4784-90; PMID:18711175; http://dx.doi.org/10.1200/JCO.2007.14.9641
- LeBlanc R, Catley LP, Hideshima T, Lentzsch S, Mitsiades CS, Mitsiades N, Neuberg D, Goloubeva O, Pien CS, Adams J et al. Proteasome inhibitor PS-341 inhibits human myeloma cell growth in vivo and prolongs survival in a murine model. Cancer Res 2002; 62:4996-5000; PMID:12208752
- Surget S, Chiron D, Gomez-Bougie P, Descamps G, Ménoret E, Bataille R, Moreau P, Le Gouill S, Amiot M, Pellat-Deceunynck C. Cell death via DR5, but not DR4, is regulated by p53 in myeloma cells. Cancer Res 2012; 72:4562-73; PMID:22738917; http://dx.doi.org/10.1158/0008-5472.CAN-12-0487
- Ratta M, Fagnoni F, Curti A, Vescovini R, Sansoni P, Oliviero B, Fogli M, Ferri E, Della Cuna GR, Tura S et al. Dendritic cells are functionally defective in multiple myeloma: the role of interleukin-6. Blood 2002; 100:230-7; PMID:12070032; http://dx.doi.org/10.1182/blood.V100.1.230
- Yang D-H, Park J-S, Jin C-J, Kang H-K, Nam J-H, Rhee J-H, Kim Y-K, Chung S-Y, Choi S-J-N, Kim H-J et al. The dysfunction and abnormal signaling pathway of dendritic cells loaded by tumor antigen can be overcome by neutralizing VEGF in multiple myeloma. Leukemia Res 2009; 33:665-70; PMID:18922577; http://dx.doi.org/10.1016/j.leukres.2008.09.006
- Barreira da Silva R, Münz C. Natural killer cell activation by dendritic cells: balancing inhibitory and activating signals. Cell Mol Life Sci 2011; 68:3505-18; PMID:21861182; http://dx.doi.org/10.1007/s00018-011-0801-8
- Fauriat C, Long EO, Ljunggren HG, Bryceson YT. Regulation of human NK-cell cytokine and chemokine production by target cell recognition. Blood 2010; 115:2167-76; PMID:19965656; http://dx.doi.org/10.1182/blood-2009-08-238469
- Piccioli D, Sbrana S, Melandri E, Valiante NM. Contact-dependent stimulation and inhibition of dendritic cells by natural killer cells. J Exp Med 2002; 195:335-41; PMID:11828008; http://dx.doi.org/10.1084/jem.20010934
- Walzer T, Dalod M, Robbins SH, Zitvogel L, Vivier E. Natural-killer cells and dendritic cells: “l'union fait la force”. Blood 2005; 106:2252-8; PMID:15933055; http://dx.doi.org/10.1182/blood-2005-03-1154
- Walzer T, Dalod M, Vivier E, Zitvogel L. Natural killer cell-dendritic cell crosstalk in the initiation of immune responses. Exp Opin Biol Ther 2005; 5(Suppl 1):S49-59; PMID:16187940; http://dx.doi.org/10.1517/14712598.5.1.S49
- Kalergis AM, Ravetch JV. Inducing tumor immunity through the selective engagement of activating Fcgamma receptors on dendritic cells. J Exp Med 2002; 195:1653-9; PMID:12070293; http://dx.doi.org/10.1084/jem.20020338
- Dhodapkar KM, Kaufman JL, Ehlers M, Banerjee DK, Bonvini E, Koenig S, Steinman RM, Ravetch JV, Dhodapkar MV. Selective blockade of inhibitory Fcgamma receptor enables human dendritic cell maturation with IL-12p70 production and immunity to antibody-coated tumor cells. Proc Natl Acad Sci U S A 2005; 102:2910-5; PMID:15703291; http://dx.doi.org/10.1073/pnas.0500014102
- Dauer M, Obermaier B, Herten J, Haerle C, Pohl K, Rothenfusser S, Schnurr M, Endres S, Eigler A. Mature dendritic cells derived from human monocytes within 48 hours: a novel strategy for dendritic cell differentiation from blood precursors. J Immunol 2003; 170:4069-76; PMID:12682236; http://dx.doi.org/10.4049/jimmunol.170.8.4069
- Sallusto F, Lanzavecchia A. Efficient presentation of soluble antigen by cultured human dendritic cells is maintained by granulocyte/macrophage colony-stimulating factor plus interleukin 4 and downregulated by tumor necrosis factor alpha. J Exp Med 1994; 179:1109-18; PMID:8145033; http://dx.doi.org/10.1084/jem.179.4.1109
- Day D, Pham K, Ludford-Menting MJ, Oliaro J, Izon D, Russell SM, Gu M. A method for prolonged imaging of motile lymphocytes. Immunol Cell Biol 2009; 87:154-8; PMID:18982018; http://dx.doi.org/10.1038/icb.2008.79
- Adams J, Palombella VJ, Sausville EA, Johnson J, Destree A, Lazarus DD, Maas J, Pien CS, Prakash S, Elliott PJ. Proteasome inhibitors: a novel class of potent and effective antitumor agents. Cancer Res 1999; 59:2615-22; PMID:10363983
- Lightcap ES, McCormack TA, Pien CS, Chau V, Adams J, Elliott PJ. Proteasome inhibition measurements: clinical application. Clin Chem 2000; 46:673-83; PMID:10794750