
ABSTRACT
Cancer immunotherapy is revolutionizing the clinical management of several tumors, but has demonstrated limited activity in breast cancer. The development of more effective treatments is hindered by incomplete knowledge of the genetic determinant of immune responsiveness. To fill this gap, we mined copy number alteration, somatic mutation, and expression data from The Cancer Genome Atlas (TCGA). By using RNA-sequencing data from 1,004 breast cancers, we defined distinct immune phenotypes characterized by progressive expression of transcripts previously associated with immune-mediated rejection. The T helper 1 (Th-1) phenotype (ICR4), which also displays upregulation of immune-regulatory transcripts such as PDL1, PD1, FOXP3, IDO1, and CTLA4, was associated with prolonged patients' survival. We validated these findings in an independent meta-cohort of 1,954 breast cancer gene expression data. Chromosome segment 4q21, which includes genes encoding for the Th-1 chemokines CXCL9-11, was significantly amplified only in the immune favorable phenotype (ICR4). The mutation and neoantigen load progressively decreased from ICR4 to ICR1 but could not fully explain immune phenotypic differences. Mutations of TP53 were enriched in the immune favorable phenotype (ICR4). Conversely, the presence of MAP3K1 and MAP2K4 mutations were tightly associated with an immune-unfavorable phenotype (ICR1). Using both the TCGA and the validation dataset, the degree of MAPK deregulation segregates breast tumors according to their immune disposition. These findings suggest that mutation-driven perturbations of MAPK pathways are linked to the negative regulation of intratumoral immune response in breast cancer. Modulations of MAPK pathways could be experimentally tested to enhance breast cancer immune sensitivity.
Abbreviations
| CNA | = | copy number alteration |
| DC | = | dendritic cell |
| DEG | = | differentially expressed genes |
| DMG | = | differentially mutated gene |
| DMFS | = | distant metastasis free survival |
| FDR | = | false discovery rate |
| GO | = | gene ontology |
| GSEA | = | gene set enrichment analysis |
| GDP | = | genome decoration page |
| GISTIC | = | genomic identification of significant targets in cancer |
| HR | = | hazard ratio |
| ICR | = | immunologic constant of rejection |
| IMS | = | intrinsic molecular subtypes |
| OS | = | overall survival |
| SNP | = | single nucleotide polymorphism |
| SML | = | somatic mutational load |
| SSP | = | single sample predictor |
| Th | = | T helper |
| TCGA | = | The Cancer Genome Atlas |
| TNBC | = | triple-negative breast cancer |
| TIL | = | tumor-infiltrating lymphocyte |
| wt | = | wild type |
Introduction
It is now broadly accepted that the presence of an active immune microenvironment can inhibit tumor growth and prevent metastatic processes. Several studies in humans across multiple cancers have conclusively shown that the presence of tumor-infiltrating lymphocytes (TILs) is often associated with favorable prognosis.Citation1 The Immunoscore worldwide consortium has recently validated and ratified the prognostic role of TILs by analyzing more than 1,300 individuals affected by stage I–III colon cancer.Citation2
In breast cancer, the prognostic role of TILs has been conclusively demonstrated in patients bearing triple-negative breast cancer (TNBC).Citation3-5,6 The density of TILs has also been associated with favorable response to neoadjuvant chemotherapyCitation6-8 and adjuvant anti-HER2/neu therapy. Transcriptomic studies added molecular precision to these observations.
Early gene expression profiling investigations in the context of cancer immunotherapy have defined molecular pathways activated in responding lesions following immunotherapy.Citation9-14 Overlapping pathways have been observed in tumors with a better prognostic connotation,Citation15-18 and in those that are more likely to respond to immune manipulations, such as interleukin-2 (IL-2) Citation13,14 adoptive therapy,Citation19 vaccination,Citation20,21 and checkpoint inhibition.Citation22-25
These pathways include activation of the interferon (IFN)-stimulated genes through the signal transducers and activator of transcription 1 (STAT1)/IFN-regulatory factor 1 (IRF1) axis, the recruitment of NK, cytotoxic, and T helper-1 (Th-1) cells mediated by the release of CXCR3 and CCR5 ligands, like CXCL9-11 and CCL5, respectively, and the induction of immune-effector mechanisms, such as perforin (PRF1), granzymes (GZMs), and granulysin (GNLY).
Such modules have been found to be coordinately activated in other forms of immune-mediated tissue destruction such as autoimmunity, graft-versus-host disease or allograft rejection.Citation26-29 We refer to the genes behind these modules as the Immunologic Constant of Rejection (ICR).Citation9,17,21,30-32 The activation of this pro-inflammatory cascade is accompanied by the counter-activation of immune-regulatory mechanisms.Citation30,30,33 In fact, the expression of immune-regulatory markers such as programmed cell death-ligand 1 (PD-L1) and Indoleamine 2,3-Dioxygenase 1 (IDO1) associates with better responsiveness to checkpoint inhibition therapy.Citation22,23,34
In breast cancer, most published prognostic and/or predictive gene signatures invariably include components of the ICR,Citation8,15,35-46 as reviewed elsewhere.Citation47 Based on this observation, we have hypothesized that two opposing cancer immune phenotypes exist.Citation30
The first phenotype is typified by the presence of an inflammatory status dominated by a Th-1 immune response. Such tumors also display the counter-activation of suppressive mechanisms (e.g., expression of IDO1, CTLA4, CD274 [or PD-L1], PDCD1 [or PD1], and FOXP3) and have a more favorable prognosis and responsiveness to immune manipulations and to chemotherapy. The second phenotype lacks such features and is typified by unfavorable prognosis and resistance to immune manipulations and chemotherapy.Citation30,47 We tested up-front this hypothesis comparing phenotypes with overall survival (OS) by querying The Cancer Genome Atlas (TCGA) breast cancer datasets.
Despite checkpoint inhibitor-based immunotherapy is revolutionizing the treatment of several neoplastic conditions such as melanoma and lung cancer,Citation30,33,47 their efficacy in breast cancer remains limited.Citation48-50 The development of more effective treatments is hindered by incomplete knowledge of the genetic mechanism governing host–tumor interaction.
A recent study in melanoma has convincingly demonstrated that pathways implicated in neoplastic transformation such as the β-catenin-WNT signal can exert immune-suppressive functions leading to T-cell exclusion,Citation51 and corroborating previous observations.Citation52,53 Mutational load increases the likelihood to express altered proteins that were not subject to developmental tolerance mechanisms and may constitute neoantigens. Indeed, the number of mutations has been correlated to responsiveness of checkpoint inhibitor therapy in melanoma and lung cancer.Citation25,54,55 In summary, efforts to elucidate molecular determinants of immune responsiveness are increasing.Citation30,56,57
Since the causality of breast cancer immune phenotype remains elusive, we sought to disentangle the relationship between cancer genetic programs and antitumor immunity using multi-dimensional genome-scale analyses. RNA-sequencing (RNA-seq) data from TCGA consortium were used to define discrete cancer immune phenotypes. Somatic mutations and copy number alterations (CNAs) were mined to capture genetic features associated with such immune phenotypes. The main findings were validated in an independent meta-cohort of breast cancer samples.
Results
Breast cancer immune phenotypes
To define discrete categories of breast cancer according to their immune composition, we mined RNA-seq data from 1,004 breast cancer samples collected by the TCGA consortium. We used the ICR genes and classic immune-regulatory genes (e.g., CD274/PD-L1, PDCD1/PD1, CTLA4, FOXP3, and IDO1). The ICR reflects the activation of the following pathways: Th-1 signaling (IFNG, TXB21, CD8B, CD8A, IL12B, STAT1, and IRF1), CXCR3/CCR5 chemokine ligands (CXCL9, CXCL10, and CCL5) and effector immune functions (GNLY, PRF1, GZMA, GZMB, and GZMH).Citation9,17,21 As shown in , these transcripts strongly correlated with each other (average correlation coefficient = 0.72).
Figure 1. Consensus clustering of TCGA RNA-seq dataset defines distinct immune phenotypes of breast cancer. (A) Spearman correlation of immune activatory (red) and immune regulatory (blue) transcripts, N = 1,004; correlation coefficients are represented numerically on the top and by green color gradient on the bottom. (B) Consensus cluster matrix generated by ConsensusClusterPlus R package, repeats = 5,000, and agglomerative hierarchical clustering with ward criterion (Ward.D2) inner and complete outer linkage, N = 1,004. Both rows and columns represent RNA-seq samples: consensus values range from 0 (never clustered together) to 1 (always clustered together) marked by white to dark blue. The consensus matrices are ordered by the consensus clustering which is depicted as a dendrogram in the top the heatmap. The cluster memberships are marked by colored rectangles between the dendrogram. (C) RNA-seq expression heatmap, N = 1,004. Clusters assignment is the one generated by the consensus clustering (panel B). The clusters are reordered from ICR4 to ICR1 (left to right) according to the decreasing average level of expression of the signature genes; no reordering within the clusters. (D) Unsupervised hierarchical cluster of ICR1 and ICR4 samples (N = 355, color labeled as in panels B and C) using cell-specific immune-signatures. Hierarchical clustering with ward criterion (Ward.D2) was applied to the matrix of the enrichment scores calculated through single sample GSEA. Cell-specific signatures enriched in ICR4 vs ICR1 (q-value < 0.05) are in red, and those significantly depleted in blue. (E) Functional enrichment of supervised differentially analysis between ICR4 and ICR1 clusters using GSEA (genes were ranked according to absolute log FC). Cytoscape and enrichment map tools have been used for network-visualization of the GSEA results (p ≤ 0.05, q-value ≤ 0.01, and similarity ≤ 0.5). Nodes represent enriched gene sets, which are grouped and annotated by their similarity. Node size is proportional to the total number of genes within each gene set. Proportion of shared genes between gene sets is represented as the thickness of the line between nodes. Nodes highly enriched with up-regulated genes in ICR4 tumors are shown in red, whereas those with downregulated genes are shown in blue (ICR: Immunological Constant of Rejection). (F) Circos Plot for ICR cluster vs stage, N = 987. (G) Circos Plot for ICR cluster vs intrinsic molecular subtype, N =1,002.
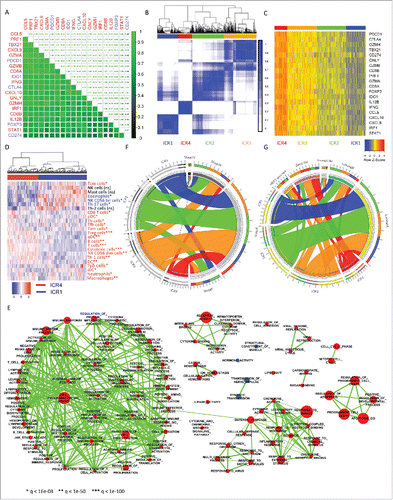
We then performed unsupervised consensus clustering based on the expression of these 20, a priori selected, representative immune genes (; gene list is recapitulated in ). The optimal number of clusters was selected using the Calinski index. This metrics indicated that the best segregation a part trivial solution (i.e., number of clusters = 2) was obtained by dividing the cohort into four clusters that reflect differing magnitudes of overall gene expression (K = 4; Fig. S1). The four clusters were designated as ICR1 (N = 213), ICR2 (N = 322), ICR3 (N = 327), and ICR4 (N = 142; ). We posited that ICR4 tumors, marked by the highest levels of immune gene expression, equate with a strong and coordinated Th-1 immune activation, whereas by contrast, ICR1 tumors characterized by the lowest immune gene expression lack an activated immune polarization. Furthermore, these opposing immune phenotypes were separated by two intermediate expression groups exhibiting medium-low (ICR2) and medium-high (ICR3) levels of immune activation (). Indeed, functional pathway analysis of the differentially expressed genes (DEG; File S1) corroborated that ICR1 and ICR4 tumors dramatically differ in terms of immune composition. As expected, the ICR4 tumors exhibited an intense activation of pathways associated with other forms of immune mediated rejection such as thyroiditis, rheumatoid arthritis, type-1 diabetes, allograft rejection, and graft-versus-host disease, reflecting an immune response and adaptive immunity cross talk consistent with Th-1 activation (Ingenuity Pathway Analysis; Fig. S2). Additional functional analyses further confirmed the broad immune divergence of the opposing ICR phenotypes.
First, we wanted to identify the specific immune cell types activated among the ICR clusters. In particular, we deconvolved the gene-expression signals of the ICR1 and ICR4 samples with single sample GSEA Citation58 using 24 cell-specific signatures (597 genes).Citation59 Doing so we obtained a vector of cell-specific enrichment scores (ES) for each patient. When hierarchical clustering was applied to the matrix of the ES, samples naturally segregate in two major clusters that perfectly separated ICR1 and ICR4 samples (; statistics in File S2). Overall, ICR4 tumors were enriched in B- and T-cell transcripts. In ICR4 specimens, T cells infiltration was clearly associated with a Th-1 immune polarization, with overrepresentation of transcripts associated with cytotoxic and Th-1 cells. T-regulatory (T-reg) cells, monocyte, macrophages, neutrophils, and dendritic cells (DCs) were also more represented in the ICR4 tumors. Conversely, in ICR1, the cell-specific signatures were consistent with a scant adaptive immune response oriented toward a Th-17 polarization. Eosinophil-related transcripts were also more abundant in ICR1 samples. NK cells displayed a differential enrichment, being NK CD56dim and NK CD56bright transcripts more represented in ICR4 and ICR1 clusters, respectively.
Second, we performed supervised differential expression analysis between ICR4 vs ICR1. Network visualization based on Gene Set Enrichment Analysis (GSEA) of Gene Ontology gene sets demonstrated, in ICR4, a strong and coordinate positive regulation of adaptive immune response including pathways involved in leukocyte differentiation, cytokine production, immune effector processes, B-/T-cell activation, T-cell proliferation, and metabolic processes (). Conversely, only few pathways were activated in ICR1 (e.g., synaptic transmission, structural component of muscle, and hormonal activity).
We then investigated the distribution of tumor stage and intrinsic molecular subtypes (IMS) within the ICR clusters. While stage distribution was similar across ICR groups (being stage II the most frequently represented in each subtype, ), an imbalance in term of IMS was noticed (). Only a small proportion of Luminal A (5.4%) and Luminal B (10.9%) tumors displayed the Th-1/ICR4 phenotype in contrast with 31.9% of Basal-like and 28.6% of HER2-enriched tumors. However, as the majority of breast tumors are Luminals, the relative small proportion of Luminal cancers harboring the ICR4 phenotype constituted almost 40% of the ICR4 group. More in detail, 57% of ICR4 tumors consisted of non-Basal like subtypes (21.8% Luminal A, 15.5% Luminal B, 16.9% HER2-enriched, and 2.8% Normal-like).
We then proceeded to compare the different immune subtypes in term of survival. Although the ICR4 cluster was enriched in Basal-like tumors, which are classically characterized by worse prognosis, OS of patients bearing such immune phenotype was greater as compared with subjects bearing the other immune phenotypes (overall p value = 0.02; ICR1–ICR2–ICR3 vs ICR4: HR [95% CI] = 2.88 [1.34–6.19], p = 0.005; ICR1 vs ICR4: HR [95% CI] = 3.48 [1.54–7.87], p = 0.001); ).
Figure 2. The T-helper 1 immune phenotype (ICR4) is associated with prolonged survival. (A) Kaplan–Meier overall survival curves of TCGA breast cancer RNA-seq dataset. (B) Kaplan–Meier distant metastasis free survival curves of the validation micro array meta-cohort; p value determined by log-rank test comparing ICR4 vs ICR1 (left) or ICR4 vs ICR1, ICR2, and ICR3 (right); Hazard ratio (HR) determined by Cox proportional hazards regression model (95% CI).
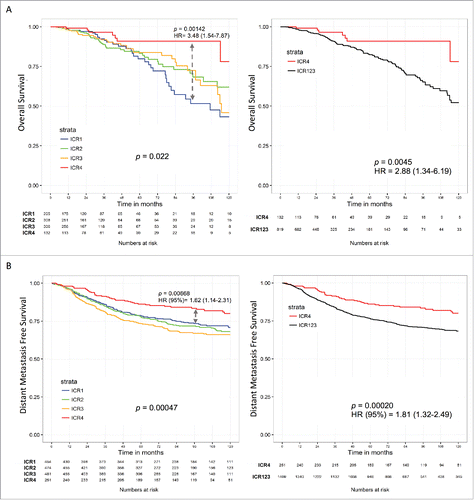
Using quantile classifications (i.e., comparing either the lowest or the highest quartile or tertile), all the transcripts tended to be associated with increased OS (Fig. S3A). A statically significant level of association was reached using both the tertile and quartile classifications by GZMH, PRF1, GZMA, CD8A, IL12B, CCL5, and IRF1; by PDCD1/PD1, GZMB, and TBX21 using the tertile classification, and by STAT1 in the quartile comparison. The ICR score (Z-score) based on all the selected immune genes was significantly associated with improved survival in both tertile and quartile classifications. Importantly, the ICR classification was more tightly predictive of OS than quantile classifications. The median expression of all the ICR transcripts progressively decreased from ICR4 to ICR1 (Fig. S3B).
We validated our findings by applying the same stratification criteria to an integrated dataset of publicly available breast cancer gene expression data (). Again, patients bearing ICR4 tumors experienced prolonged distant metastasis free survival (DMFS) as compared with other subgroups (heatmap, consensus cluster matrix, and Calinski metrics for this data set can be found in Fig. S4).
Breast cancer immune phenotypes and mutational burden
Recent work suggests an association between number of mutations and responsiveness to immunotherapy.Citation25,54,55 Therefore, we compared the mutational load among the ICR groups. The number of non-silent mutations significantly differed among the four immune phenotypes (p = 1.10e−5, Kruskal–Wallis test), progressively increasing from ICR1 to ICR4 cluster (). Nevertheless, a considerable proportion of samples belonging to ICR4 group had a relatively low mutational burden and, vice versa, a fraction of ICR1 tumors had a relatively high number of mutations, suggesting that mutational load cannot fully explain the observed differences in term of immune activations. However, mutational burden was strongly related to the IMS (p = 1.20e−32, ). The median (and average) number of mutations was the highest in Basal-like and HER2-enriched tumors followed by Luminal B and Luminal A subtypes, consistent with the observations of Kobolt et al.Citation60 As expected, the number of mutations of Normal-like tumors, which are often believed to represent a mere contamination of samples with normal breast tissue,Citation61 was extremely low. When comparison of mutational burden was performed within specific IMS, the association between mutational load and immune phenotype was lost in HER2-enriched and Basal-like subtypes. A non-statistically significant trend was still observed in Luminal A and Luminal B tumors, which became significant when Luminal A and B samples were considered together (p = 7.57e−3). Identical results were obtained by considering both silent and non-silent mutations (Fig. S5A).
Figure 3. A high mutational load is associated with the T-helper 1 immune phenotype (ICR4) and with Basal-like and HER-2 enriched subtypes. (A) Non-silent mutation frequencies by sample, with outlier mutation numbers of > 250 have not been plotted but are included in the statistics. (B) Proportion of mutations yielding strong neoepitopes vs all mutations per sample, with outlier mutation numbers of > 25% have not been plotted but are included in the statistics. Both plots A and B are stratified by ICR cluster, IMS subtype, and ICR cluster within different subtypes, N = 904; p values determined by Kruskal–Wallis test (*without Normal-like p value: 4.75e−31); labels in the y-axis represent median (top) and average (bottom) per sample. The central line of the notched box plots shows the median of the data. The box represents the interquartile range (IQR). The wiskers add 1.5 times the IQR to the third quartile and subtract 1.5 times from the first quartile. The notch displays the 95% CI around the median. Horns in the notch plot occur when the notch is larger than the hinges of the boxplots. A skewed shape of the notched box plots is an indication of asymmetric distribution of the data. (C) Mutation type for the four ICR clusters, scaled to the log of the total number of mutations, ordered by decreasing mutation load; IMS: intrinsic molecular subtype.
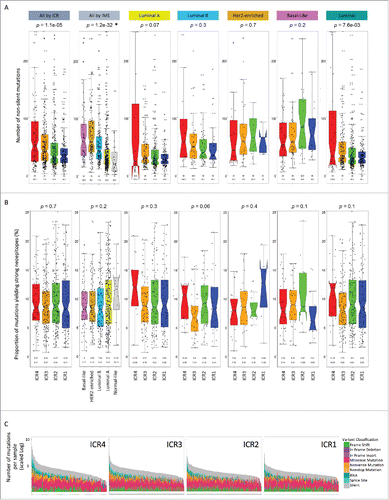
The increased responsiveness to immunotherapy of hyper mutated tumors has been attributed to enrichment in mutated antigens (neoantigens) that could be recognized by T cells.Citation25,54,55 According to such model, antitumor immune responses directed against neoantigens and counteracted by immune regulatory mechanisms might be re-activated by immunomodulatory interventions such as the administration of checkpoint inhibitors. Although the total number of predicted neoepitopes or the total number of mutations potentially yielding neoepitopes differed among ICRs (similarly to what observed for mutational load; Fig. S5B and C), variations disappeared when corrected for the total number of mutations ().
Finally, no differences in types of mutation (i.e., missense, non-sense, frameshift, etc.) were observed among the ICR subtypes ().
Specific mutations and immune phenotypes
To identify mutations specifically associated with the level of immune activations, we compared the two extreme immune phenotypes (e.g., ICR1 and ICR4) by mining exome sequencing data. We identified 64 differentially mutated genes (DMGs) by the two groups under comparison (p < 0.01, Fisher's exact test: and File S3). Five of these genes (e.g., MAP3K1, MAP2K4, TP53, RPGR, and POM121) were mutated more often than expected by chance given background mutation processes according to the MUTSIG analysis and were, therefore, considered driver mutations (highlighted in ).Citation62 The majority of the DMGs showed a higher frequency of mutations in the ICR4 cluster, in part as a consequence of the greater overall mutation rate observed in these tumors (). Among those genes, the most significantly DMG was TP53 (), with a degree of association with immune phenotype much higher than that observed by the mutational burden (p = 3.7e−16, Fisher's exact test). TTN was another DMG strongly enriched in ICR4 (p = 2.3 e−4 Fisher's exact test). TTN is the largest polypeptide encoded by the human genome and its mutations are considered to be passenger.Citation63 Consistently, the TTN mutation pattern was tightly associated with the degree of mutational load, whereas TP53 mutations were mostly linked to other variables such as IMS ().
Figure 4. Specific somatic mutations typify breast cancer immune phenotypes. (A) Specific differentially mutated genes in ICR's 1 and 4, identified using all genes showing a p value < 0.01 when applying the fisher test. Genes identified by MUTSIG are indicated in purple on top. Dark red is mutated light blue is wild type. (B) Non-silent mutation type distribution for “genes of interest” by ICR Cluster, p values determined by Cochran–Armitage test for trend. Mutation Class frequency has been scaled to represent the frequency of non-silent mutation per ICR cluster. (C) Box plot showing the distribution of the proportion of mutations yielding strong epitopes between the differentially mutated genes (DMG) and the other genes (non-DMG); This proportion is expressed as ratio of count of distinct mutations leading to strong neoepitoes over total count of distinct mutations; p value of “non-DMG” vs “DMG” = 4e−136 (Mann–Whitney test). IMS: intrinsic molecular subtype, SML: somatic mutational load, DMG: differentially mutated genes.
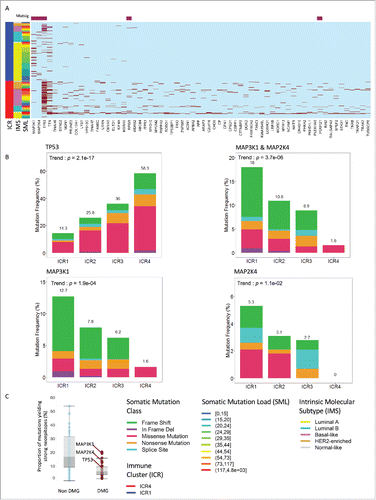
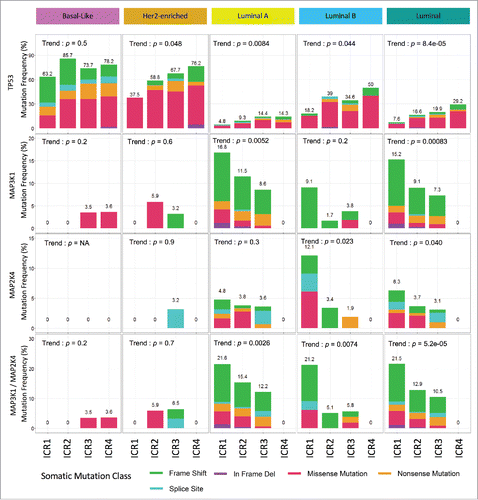
When the analysis was expanded to the other immune phenotypes, TP53 mutations displayed a coherent trend of enrichment proceeding from ICR1 to ICR4 clusters, being mutated in 14.3%, 25.7%, 36.0%, and 58.3% of ICR1, ICR2, ICR3, and ICR4 tumors, respectively (p = 2.1e−17, Cochran–Armitage test for trend; ).
The mutational frequency was higher in ICR1 over ICR4 groups only for two genes (i.e., MAP3K1 and MAP2K4, p = 0.0002 and p = 0.006, respectively, Fisher's exact test, ). Both genes are considered driver mutations and have been implicated in breast cancer oncogenesis.Citation64,65
A progressive and significant trend, in this case in the reverse direction of the one noticed for TP53, was observed between these two MAPK mutations and immune phenotypes (). MAP2K4 and MAP3K1 mutations, which occur in the same pathways, were mutually exclusive. Globally, 18% of ICR1 tumors carried either MAP3K1 or MAP2K4 mutations (MAPK-mut) vs only 1.8% of the ICR4 tumors (p = 1.13e−6, Fisher's exact test; ). An enrichment trend for MAPK-mut was noticed progressing from ICR4 to ICR1, being the MAPK-mut rate 10.8% and 8.9% in ICR2 and ICR3 tumors, respectively (p = 3.72e−6, Cochran–Armitage test for trend). The median proportion of mutations yielding strong neoepitopes was overall lower in the DMG group as compared to the other genes (, left panel). Nevertheless, regarding MAP2K4 and MAP3K1, such proportion was within the range of the non-DMGs ().
TP53 is more frequently mutated in Basal-like and HER2-enriched tumors, while MAP3K1 and MAP2K4 mutations occur almost uniquely in Luminal cancers.Citation65,60 We, therefore, performed a correlative analysis within each IMS (). As for TP53 mutations, the association with ICR phenotype was lost in Basal-like tumors (p = 0.53), but still present in HER2-enriched (p = 0.048), Luminal A (p = 0.006) and Luminal B (p = 0.044) subtypes. MAP3K1 mutations remained significantly associated with ICR in Luminal A subtypes (p = 0.005), as did MAP2K4 mutations in Luminal B tumors (p = 0.023). Globally, MAP2K4 and MAP3K1 mutations were strongly associated with ICRs in Luminal samples. In particular, no ICR4 tumors carried MAP3K1 or MAP2K4 mutations, which were present in 10.5%, 12.9% and 21.5% of ICR3, ICR2, and ICR1 tumors (p = 5.3e−5). However, both TP53 and MAPK mutations (i.e., either MAP3K1 or MAP2K4) were statistically and independently associated with the immune phenotypes when tested in a multivariate model together with the IMS, whereas the number of non-silent mutations was not (data not shown).
Figure 5. Specific somatic mutations of driver genes typify immune phenotypes of breast cancer within specific intrinsic molecular subtypes. Distribution of TP53, MAP3K1, and MAP2K mutations by ICR within each IMS. Mutation class frequency has been scaled to represent the frequency of non-silent mutation per ICR cluster and subtype; p values determined by Cochran–Armitage test for trend; IMS: intrinsic molecular subtype.
As single parameter, TP53 mutation was associated with poor OS, without, however, reaching the significant level (Fig. S6A, left panel). Quite interestingly, when the analysis was stratified according to the ICRs, the putative detrimental effect of TP53 was reverted by the immune phenotype. Indeed, both ICR4 groups (i.e., ICR4-TP53 mut and ICR4-TP53 wt) have excellent prognosis while the two ICR1 groups (i.e., ICR1-TP53 mut and ICR1-TP53 wt) had a relative poor prognosis (Fig. S6B, left panel). Similarly, no association between MAPK mutations and OS was observed (Fig. S6A, right panel). When MAPK-mut status was combined with ICR status, patients bearing the ICR1 phenotype had the worse prognosis, independently of the MAPK mutational status (Fig. S6B, right panel).
Copy number alterations and immune phenotypes
To detect genomic imbalances related to the immune-phenotypic differences among the four immune phenotypes, SNPs data were processed using GISTIC v2.0 to identify broad and focal CNAs specific for each group.
Collectively, the most frequently gained regions were detected on the chromosomal arms 1q, 8q, and 16p, whereas the regions frequently lost were on 8p, 11q, and 16q (Fig. S7). Although all four ICR groups showed a similar variation in copy number changes partially reflecting the IMSs, ICR4 had a more stable CNA pattern on chromosome 16 with less amplifications in 16p and a lower number of losses in 16q ().
Figure 6. Copy number alterations characterize opposing immune phenotypes of breast cancer. (A) Visualization of CNV profiles for ICR1 and ICR4 tumors (first annotation column) by IMS (second sample annotation column). Within the chromosome plots, red indicates DNA copy number gain; blue indicates DNA copy number loss. (B) Idiogram of genes significantly different deleted or amplified between ICR1 (blue) and ICR4 (red). Genes involved in the regulation of the immune system are indicated in green, color indicators are located below the chromosome; IMS: intrinsic molecular subtype.
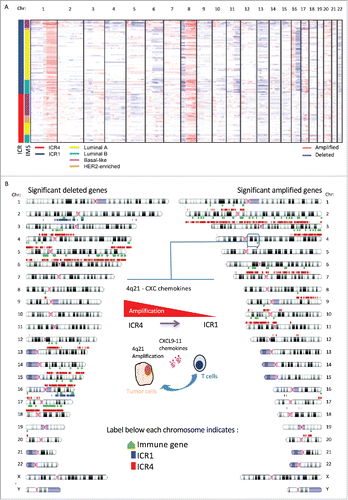
Comparative analyses of GISTIC-defined regions with frequent low and/or high level CNA in the four ICR groups revealed very similar results in terms of number of significantly (q ≤ 0.05) altered regions (16, 18, 27, and 18 gained and 24, 37, 36, and 23 lost respectively in ICR1–ICR4; File S4A and B). The comparisons showed many aberrant regions were commonly altered in all the four ICR groups. However, some were specifically and significantly altered in a single ICR cluster (specific alterations are listed in File S4C). By comparing the number of specific and significant regions involved in CNA events in each ICR group, we found that specific chromosomal losses occurred more frequently than specific gains (6, 13, 14, and 8 losses vs 3, 4, 4, and 4 gains in ICR1, ICR2, ICR3, and ICR4, respectively).
To identify significant imbalances among immune phenotypes, we compared the frequencies of losses and gains between ICR1 and ICR4 groups at the single-gene level (File S5). Globally, 3268 and 4542 genes showed enrichment respectively in amplification or deletions in ICR4 vs ICR1 tumors. Conversely, just 35 genes, many of them located on 16p, were enriched in amplifications in ICR1 vs ICR4 samples, whereas 672 genic sequences showed a strong enrichment in deletions. More than half of the latter (n = 369) mapped to 16q chromosomal arm. Interestingly, after collecting the set of 846 immune-related genes from the Immunome database,Citation66 we observed that 89 genes significantly amplified more frequently in ICR4 were involved in immune functions. Conversely, no immune-related genes showed significantly higher frequencies of amplification in ICR1 over ICR4. Analogously, ICR1 tumors included less immune-related genes with enhanced frequency of deletions compared to ICR4 (26 vs 137, ICR1 vs IRCR4, respectively). A graphical representation of this analysis is reported in .
Immune-related genes more frequently amplified in ICR4 tumors include those encoding cytokines (IL1A–ILB [2q13], IL12A [3q25.33], IL28–IL29 [19q13.2], IL17F [6p12.2], and IL17C [16q24.3]), chemokines (CXCL12 [10q11.21], CXCL9–10–11 [4q21.1]), cytokine and chemokine receptors (IL1R1 [2q12.1], ILR2 [2q11.2], IL15RA [10p15.1], IL20RA [6q23.3], IL22RA-RA2 [6q23.3], IFNGR1 [6q23.3], and CXCR4 [2q22.1]), and interferon signaling modulators (STAT1 [2q32.2], STAT4 [2q23.2], and IFI44L [1p31]). Conversely, ICR1 tumor exhibited deletions of cytokine receptors located in 2q (IL1R1–2, and IL18R1-AP [2q12.1]), and deletions of cytokines, chemokine, and chemokine receptor genes located in 16q (IL17C, CCL22 [16q13], CX3CL1 [16q21], and CCL17 [16q21]). Deletions of CC chemokines, CC receptors (CCR1–2–3–5 [3p21.31], CCRL2 [3p21.31], CCR4 [3p22.3], CCR7 [17q21.2], and CCL5–7–8 [17q12]), and some CXC chemokines (CXCL14 [5p31.1] and CXCL16 [17p31.2]) were more frequent in ICR4 tumors. Additional relevant immunomodulatory genes significantly deleted in ICR4 samples include cytokine and cytokine-receptor genes mostly located on the chromosome arm 5q (IL4 [5q31.1], IL5 [5q31.1], IL9 [5q31.1], IL12B [5q33.3] IL13 [5q31.1], IL6ST [5q11.2], IL17B [5q32], IL31RA [5q11.2]). Other immune-related genes significantly more deleted in ICR4 over ICR1 include IL17RB [3p21.1], IL17RD [3p14.3], IL32 [16p13.3], and GZMA-K [5q11.2]) and genes involved in interferon signaling (STAT3 [17q21.2], IRF1 [5q31.1], IRF2 [4q35.1], IFI27 [14q32.12], and IFI35 [17q21.31]).
To add specificity to the analysis, we intersected the results of the differentially amplified or deleted genes with those of ICR-specific regions (File S4D). Only eight immune-related genes were at the same time differentially altered in the two opposite immune phenotypes and included in ICR-specific regions. Interestingly, such genes included the CXCR3 ligands, CXCL9, CXCL10, and CXCL11 (q = 7e−4), that are involved in the recruitment of cytotoxic and Th-1 cells and are central in the immunologic-constant of rejection signature (focal amplification of 4q21in ICR4 groups is highlighted in ; distribution of CXCL9–11 amplifications and deletion according to the ICR subtype is showed in Fig. S8A). Although the effect of amplification on transcript expression was modest, the expression level of CXCL9, CXCL10, and CXCL11 was significantly higher in samples with gain compared to those with loss or no alterations (Fig. S8A and B). It should be mentioned that the interpretation of correlative analysis between CXCL9–11 copy number and transcript expression is challenging. In fact, upregulation of CXCL9–11, which are IFN-inducible transcripts, could occur in absence of amplification, for example, following production of IFNγ by activated T cell. In addition, such chemokines are also produced by stromal cells (lymphocytes and endothelial cells).Citation17,19 This microenviromental interference can therefore dilute the effect of functional amplifications or deletions on transcript expression. However, CXCL9–11 copy number was inversely correlated with survival (Fig. S8C, left panel). Nevertheless, ICR4 tumors had excellent prognosis independently of the CXCL9–11 amplification, whereas ICR1 tumors amplifying CXCL9–11 had the poorer prognosis (Fig. S8C, right panel). In ICR1 tumors, the gene amplification did not equate to upregulation of the corresponding transcripts (CXCL9–11 expression was invariably very low in such tumors, see Fig. S3), suggesting that such amplification was not functionally relevant and therefore cautioning the interpretation of the survival analysis.
In summary, the correlative analyses suggest that 4q21 amplification is implicated in modulating the expression of CXCL9, CXCL10, and CXCL11, but is not sufficient to confer the protective immune phenotype.
Transcriptional pattern of MAPK-mutated cancers
Since MAPK mutations were enriched overall and within the specific IMSs (i.e., Luminal samples), we assessed the functional relevance of MAP3K1/MAP2K4 mutations by integrating mutational with transcriptomic data. We compared genes known to be part of the MAPK pathways between MAP3K1/MAP2K4-mutated vs wild-type (wt) Luminal tumors. In order to quantify the degree of MAPK deregulation, transcripts associated with MAPK mutations (MAPK-mut transcripts) were used to generate a MAPK-mut score (see Materials and Methods section). The MAPK-mut score could perfectly segregate Luminal samples according to the ICR classification (, left panel). We then extended the same score to the entire ICR1–ICR4 TCGA dataset (Fig. S9, left panel). Strikingly, MAPK-mut transcripts precisely separated the entire cohort of samples according to the ICR classification, with coherent changes proceeding from ICR1 to ICR4 from most of the genes (Fig. S10). Moreover, the degree of the MAPK-pathway deregulation could stratify samples according to their immune orientation not only across but also within the IMSs (, left panel). Superimposable results were obtained on the validation dataset using the MAPK-mut score (, right panels, and Fig. S9, right panel). A schematic representation of the dysregulation of the MAPK pathways is proposed in .
Figure 7. The MAPK-mutation score can segregate different immune phenotypes of breast cancer within intrinsic molecular subtypes. (A) Left panel: MAPK-pathway genes differentially expressed between MAP3K1 or MAP2K4 mutated (MAPK-mut) and wild-type TCGA Luminal samples are used to segregate ICR1–ICR4 TCGA Luminal samples (N = 206). Right panel: MAPK-mut transcripts defined in the TCGA dataset are used to segregate ICR1–ICR4 Luminal samples of the validation dataset (N = 428). (B) The same transcripts are used to segregate ICR1–ICR4 Basal-like and HER2-enriched samples in the TCGA cohort (N = 74 and N = 29, respectively) and in the validation dataset (N = 140 and N = 109, respectively). Samples are ordered by MAPK-mut score, which is the average ranking of the samples in upregulated and downregulated Z-scores (see Materials and Methods section for detail). The TCGA heatmaps are based on the TCGA samples for which mutational data were available.
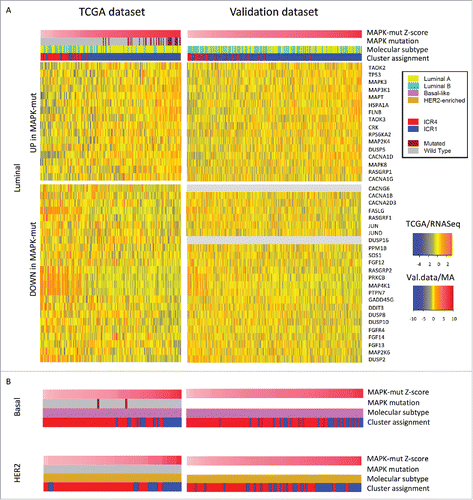
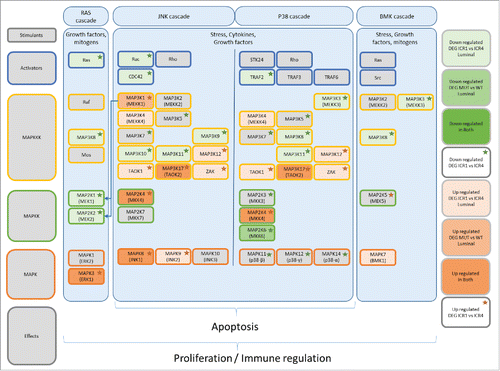
Figure 8. Deregulations of the MAPK-pathway associated with MAP3K1 and MAP2K4 mutations. Summarized representation of the MAPK pathways with the stimulants and kinase cascade from top to bottom. Key molecules are represented in the figure. The red and green color gradients indicate the downregulation or upregulation of the genes in Luminal ICR1 vs ICR4 samples or in MAP3K1/MAP2K4 mutated (mut) vs wild-type (wt) samples. The red and green stars represent genes upregulated or downregulated in ICR1 vs ICR4 regardless of the molecular subtype. “Upregulated in both” category highlights genes that are downregulated in both Luminal ICR1 vs ICR4 samples and in MAP3K1/MAP2K4 mutated vs wild-type samples. “Down-regulated in both” category was for genes that are downregulated in both Luminal ICR1 vs ICR4 samples and in MAP3K1/MAP2K4 mutated vs wild-type samples. No genes met this requirement.
Discussion
In the present study, we defined discrete breast cancer immune phenotypes according to the disposition of immune transcripts related to the presence of an active Th-1 immune response (e.g., ICR1, ICR2, ICR3, and ICR4). Using a discovery set of 1,004 tumor samples and a validation set of 1,954 samples, we confirmed that the Th-1 immune cancer phenotype, also displaying the activation of immune-regulatory mechanisms, is associated with favorable prognosis in breast cancer. Conversely, the scant immune response of the lymphocyte-depleted phenotype (ICR1) was oriented toward a Th-17 polarization, previously associated with unfavorable prognosis in other tumor types such as colon cancer.Citation18 Interestingly, ICR1 cancers were enriched in eosinophil-related transcripts, which have been recently correlated with adverse prognosis in solid tumors.Citation67
Confirmation of the prognostic significance of the immune phenotypes encouraged an analysis of genetic variables associated with and potentially determining them.
ICR4 tumors exhibited a higher frequency of amplifications and deletions as compared to ICR1 samples. These imbalances affected a considerable proportion of genes with potential immune-regulatory effect. Although it is not possible to define the net immunomodulatory impact that such alterations might have caused, some findings captured our attention. For example, ICR4 tumors were enriched in amplification of STAT1 and deletion of STAT3, which are believed to play opposing roles in the oncogenic process.Citation68 Although STAT1 orchestrates antitumor inflammatory response, STAT3 promotes tolerogenic mechanisms and tumor growth.Citation17,69-71 Moreover, ICR4 cancers uniquely displayed focal amplification on chromosome segment 4q21. This region contains the CXCR3 chemokines CXCL9, CXCL10, and CXCL11, which represent another critical component, together with STAT1, of the ICR. As these chemokines are implicated in the recruitment of cytotoxic and Th-1 cells,Citation72,73 it is reasonable to speculate that constitutive amplification of such transcripts in tumor cells can enhance the production of chemo-attractant molecules favoring immune infiltrations. Indeed, amplification of such chemokine genes was association with increased transcript expression. Similarly, Bindea et al. observed in colon cancer cases that CXCL9 expression was higher in patient who had gain.Citation59 Although increased production of such chemokines mediated by gene amplification could have influenced the recruitment of T cell, it is important to notice that such chemokines (especially CXCL10) exert both tumor-suppressing and tumor-promoting effects.Citation17,19,31 Because of their pleiotropic effects, it is possible that the amplification of such genes could have conferred a growth advantage in certain phases of the oncogenic process while at the same time having influenced T-cell chemotaxis, which however was not able to mediate a complete tumor rejection.
Even though we detected a statistically significant correlation between mutational or neoepitope burden and strength of intratumoral response, the relationship was weak and could not fully explain immune phenotypic differences. The median number of somatic mutations in ICR4 tumors overlapped significantly with that in the ICR1 ones. Thus, it is likely that other variables contribute to the development of spontaneous antitumor immunity.
A recent analysis of the TCGA datasets reported a linear correlation between the number of somatic mutations and cytolytic activity (defined as mean expression of GZMA and PRF1 transcripts) but highly differs across multiple cancers.Citation74 Although it is possible that a higher number of mutations increase the probability of generating mutated peptide sequences recognized as foreign by T cells, we did not detect an enrichment of neoepitopes in the immune favorable phenotype when the counts were normalized for the overall number of mutations. These observations suggest that mutations in the Th-1 enriched ICR4 tumors are not intrinsically more immunogenic than the ones in ICR1 cancers. We also observed that the correlation between mutational load and immune phenotypes was strongly dependent on IMS. The Th-1/ICR4 phenotype was enriched in Basal-like tumors, which had the highest mutational burden. Vice versa, the Th-1 depleted ICR1 phenotype was enriched in Luminal tumors, in which the number of somatic mutations was relatively low. The association between immune phenotypes and IMS is in line with previous findings showing that the highest level of immune infiltration is observed in HER2/Neu+ and triple negative/Basal-like breast cancers.Citation75,76
When the analysis was performed within each IMS, the number of non-silent or total mutations did not differ across the four ICR clusters in Basal-like and HER-2 tumors. However, it remained significant in the Luminal tumors, mostly influenced by the small proportion of Luminal A tumors that carry a much higher number of mutations than the median for that group, (i.e., ICR4 Luminal A plot, , third panel from the left). Such heterogeneity implies a strong and complex interaction between intrinsic genetic programs (in part captured by IMS), mutational burden, and intratumoral immune response.
A positive association was noticed between frequency of TP53 mutations and Th-1 infiltration. A possible explanation is that TP53 mutations are particularly immunogenic leading more frequently to the generation of neoepitopes. However, the observation that the proportion of mutations leading to neoepitopes was not higher for TP53 compared to other genes does not support this speculation. This was also the case for most other differentially mutated genes enriched in ICR4 but not for those enriched in ICR1. This interesting divergence might be the results of immune-selection processes.
In a multi-cancer study of the TCGA datasets, Rooney et al. found that TP53 mutations were inversely associated with cytotolytic activity in some tumors such as stomach, ovarian, cervical, and head and neck cancers.Citation74 Because mutant forms of TP53 can perturb genomic-stabilizing mechanisms,Citation77 the effect of TP53 mutations could differentially interact with other mechanisms potentially implicated with immunomodulatory functions in distinct cancer types. In breast cancer, when the analysis was carried out for each IMS, TP53 mutations were associated with the degree of the Th-1 status in Luminal samples and, to a lesser extent in HER2-enriched tumor. This was not the case for Basal-like subtypes, which displayed overall the higher frequency of TP53 mutations and the highest proportions of Th-1/ICR4 tumors. Similarly, no significant association between TP53 mutation and intratumoral immune response, as evaluated by immunohistochemistry, was observed by Kriegsmann et al.Citation78 In the analysis of the METABRIC dataset, Quigley et al. reported that the expression of representative genes related with immune infiltration (e.g., CCR7, CD2, CD3E, LY9, PRF1) was overall the highest in Basal-like tumors.Citation79 However, when samples were stratified according to IMS, TP53-mutant samples had the highest expression of immune related genes in Luminal tumors, whereas the reverse was observed for HER2-enriched and Basal-like tumors.Citation79 It is tempting to speculate that globally, in breast cancer, TP53 mutations associate with perturbations that increase the likelihood to develop an antitumor immune response. Yet, in specific breast cancer subtypes, such as Basal-like and HER-2 tumors, other factors might significantly influence the development of intratumoral immune response, attenuating, or perhaps reverting, the putative immunomodulatory effect induced by TP53 mutations.
In addition to TP53, all but two differentially mutated genes were enriched in the ICR4 group. Although this enrichment could have occurred by chance as a consequence of the higher mutational load of ICR4 samples, mutations of two genes (e.g., MAP3K1 and MAP2K4) were absent in the ICR4 group, with a gradual and significant enrichment trend proceeding from ICR4 to ICR1 tumors. Most of these alterations include frame shift deletions or insertions and missense or nonsense mutations, and are predicted to be deleterious.Citation64 Interestingly, MAP3K1 and MAP2K4 mutations were accompanied by the upregulation of their corresponding transcripts, possibly as the result of compensatory mechanisms. MAP3K1 and MAP2K4 mutations were almost exclusively observed in Luminal A and Luminal B samples, and their correlation with immune phenotypes was present within these specific subtypes. When the association with ICR was tested in a multivariate analysis together with IMS, both MAPK and TP53 mutations were retained in the model, whereas the mutational load was not.
The MAPK pathway is classically divided in four distinct MAPK cascades (e.g., ERK, JNK, p38, and BMK), which modulate a wide spectrum of cellular responses from basis to highly complex programs such as differentiation, proliferation, and apoptosis ().Citation80,81 MAP3K1 (MEKK1) stimulates both MAP2K1/2-ERK1/2 and MAP2K4/7-JNK.Citation82,83 Originally described as oncosuppressor genes, in vitro and in vivo experiments have demonstrated that MAP2K4 and MAP3K1 have both tumorigenic and tumor suppressive functions depending on cell type and experimental condition.Citation82,83 Our transcriptomic analysis revealed that MAP2K4 and MAP3K1 mutations associate with a profound deregulation of the MAPK pathway. Importantly, the degree of MAPK-mut driven perturbations of the MAPK pathways was tightly connected with the tumor immune orientation. MAPK-mutation related transcripts could precisely segregate not only the Luminal cohorts but also the other subtypes according to the ICR status. The direction of such deregulation proceeded gradually from MAPK-mut Luminal ICR1 to wt HER2-enriched and Basal-like ICR4 tumors.
Since MAPK mutations were extremely rare in non-Luminal samples, it is possible that, in other IMSs, the described MAPK perturbations are sustained by other mechanisms. As for the different MAPK-cascades, MAPK-mutant/ICR1 samples display upregulation of the downstream mediator of the ERK and JNK cascades, (e.g., MAPK3 [or ERK1], MAPK8 [or JNK1], and MAPK9 [or JNK3]) together with overexpression of the effector of the BMK cascade, which has similar effect to that of the ERK cascade ().Citation81 Activation of the JNK cascade has been shown to modulate the production of several pro-inflammatory cytokines.Citation84 Notably, activation of the ERK cascade is critical for the production of IL-10 and implicated in the negative regulation of IL-12,Citation85-87 with consequent impediment of Th-1 differentiation. The p38 cascade, which was also differentially deregulated in MAPK-mut and wt samples, is involved in the induction of IL-12 production, and therefore in the modulation of Th-1 polarization.Citation85,87,88 Studies in melanoma patients have reported that ERK-cascade inhibition through BRAF-targeted therapy decreases the production of immune suppressive factors including IL-6, IL-10, and TGF-β,Citation89 whereas BRAF-related transcripts could segregate Th-1 vs Th-17 immune phenotypes.Citation90 Moreover, the double blockade of the ERK cascade through combined BRAF and MEK inhibition was able to upregulate the expression of tumor-associated antigens, MHC, as well as those of several others immune-related genes.Citation91 These combinations demonstrated synergy with anti-PD1 therapy in melanoma mouse models.Citation91 Similar results have been recently described in triple negative breast cancer, where genomic activation of the ERK cascade was associated with lower frequency of TILs after neoadjuvant chemotherapy.Citation92
As perturbations of the MAPK pathway are linked with different immune dispositions, our findings suggest that MAPK modulation might enhance the therapeutic efficacy of immunomodulatory approaches in breast cancer. This approach could possibly broaden the benefit of immunotherapy to Luminal samples, which are in general excluded from immunotherapeutic trials.
By unveiling the putative immunomodulatory proprieties of MAP3K1 and MAP2K4 mutations, our study adds to the growing evidence that cancer genetic programs influence the development of intratumoral immune response.Citation30 Our results may also provide indication on potential subpopulation of patients with breast cancer who may benefit from immune therapeutics. Further studies are needed to validate the determinism of our findings and give mechanist insights into the immunomodulatory proprieties of MAP3K1 and MAP2K4 in breast cancer.
Materials and methods
Data acquisition and filtering
TCGA dataset: All data acquisition and analysis was accomplished using R (3.2.2) unless mentioned otherwise. Packages used are mentioned throughout article sections. RNA-seq, clinical and copy SNP data were downloaded using TCGA assembler and our TCGAbioloinks R/Bioconductor package.Citation93,94 Mutation data (genome.wustl.edu__IlluminaGA_curated_DNA_sequencing_level2.maf) were downloaded using the TCGA portal (N = 1,097). Data were filtered to exclude patients without RNA-seq data or clinical information. Other exclusion criteria were male gender, an unclear histology, use of neo-adjuvant therapy, and a history of other malignancy (N = 3, 9, 1, 13, 66, 12). After exclusion, analysis was performed on a dataset of 1,004 patients, 903 of which also have mutation data, 995 have CNA data, and 953 have available survival data. Normalization of TCGA RNA-seq data was performed within lanes, between lanes, and per quantile using the EDASeq package. This normalization accounts for gene-specific effects on read counts within lanes, such as those related to gene length or GC-content, and for differences between lanes in the distribution of read counts (e.g., sequencing depth). Tumor IMS (i.e., Basal-like, HER-2/neu enriched, Luminal A, and Luminal B) based on RNA-seq data were determined using the method described by Ciriello et al.Citation95
Validation dataset: Validation cohort comprised of 1,954 tumor expression profiles of primary invasive breast cancer not receiving neo-adjuvant chemotherapy profiled with Affymetrix microarray platforms (i.e., U133A, U133A2, and U133 PLUS 2.0). Data represent different patients' populations from 16 medical centers in the USA, Europe, and Asia. Construction of this dataset is described in detail elsewhere.Citation43,96 Briefly, raw data (CEL files) were extracted from Gene Expression Omnibus (GSE1456, GSE2034, GSE5327, GSE12093, GSE7390, GSE6532, GSE9195, GSE2603, GSE7378, GSE8193, GSE4922, GSE11121, and GSE45255), NCI's caArray database (accession: mille-00271), and the EMBL-EBI's ArrayExpress database (accession: E-TABM-158). Transcripts analyzed included the 22,268 probe sets common to the U133A, U133A2, and U133 PLUS 2.0 array platforms. Data were MAS5.0 normalized using the justMAS function in the simpleaffy library from BioconductorCitation97 using a trimmed mean target intensity of 600 without background correction. COMBAT empirical Bayes method was used to correct for batch effects.Citation98 IMS (i.e., Basal-like, HER2-enriched, Luminal A, and Luminal B) were defined using the Single Sample Predictor (SSP) algorithm by Hu et al.Citation99 utilized by Fan et al.Citation100 Claudin-low tumors were identified by using the method of Prat et al.Citation101 Because the algorithm used to classify the TCGA samples did not include the Claudin-low subtype, such samples were omitted in the heatmap representation of the validation dataset ( and S9).
Correlation matrix and consensus clustering
The correlation matrix was calculated using Spearman test and plotted using corrplot 0.73, with genes being ordered by first principal component. The consensus matrix plots were generated using the ConsensusClusterPlus Citation102 1.24.0 package with the following parameters: 5000 repeats, a maximum of 7 clusters, and agglomerative hierarchical clustering with ward criterion (Ward.D2) inner and complete outer linkage. Genes used for consensus clustering analyses are the 20 a priori selected immune genes (listed in ).
Heat maps and Kaplan–Meier survival plots
For the heatmaps, gplots 2.17.0 was used, and a modified version of the ggkm Citation103 function was created to generate the Kaplan–Meier survival curves. OS data was available for TCGA dataset and distant DMFS data for the validation data sets and were used to generate Kaplan–Meier curves. Normal-like samples, and those with missing IMS assignment or with less than 1 d follow-up, were excluded from survival analysis. To minimize population-specific bias due to patient follow-up duration, survival analysis was limited to a 10-y window; p values are based on Log-rank test. The MAPK-mut score was calculated as follows: first the Z-score of the differentially upregulated and downregulated genes between MAP3K1/MAP2K4 Luminal mutant vs Luminal wt samples belonging to the MAPK pathway (as for KEGG http://www.genome.jp/kegg/) is calculated separately. Then the up and down rank of the samples is determined based on the Z-scores. The mean of the up and down ranks for each sample is then defined as the MAPK-mut score. Finally, by using the same genes, MAPK-mut score is portrayed to the other samples.
Differential gene expression and functional analysis
Differential gene expression analysis was carried out using the Bioconductor edgeR analysis package,Citation104 which uses a generalized linear model with a logarithmic link function and a negative binomial error distribution in the analysis. To minimize spurious statistical tests, gene counts with low expression values were filtered out. The threshold cutoffs to identify significant DEGs were False Discovery Rate (FDR)-adjusted p value (q value) < 0.05 and absolute log-fold change (log FC) > 0.5 Gene Ontology (GO) term enrichment analysis was performed using GSEA Citation105 (1,000 permutations; genes ranked according to ICR4 vs ICR1 absolute log FC) and visualized by the Enrichment Map tool (The Bader lab, University of Toronto) as a plug-in of Cytoscape.Citation106 In order to identify possible enriched molecular networks and canonical pathways, functional characterization of the DEGs with absolute log FC > 1 was performed using Ingenuity® Pathway Analysis (IPA®, QIAGEN Redwood City, www.qiagen.com/ingenuity).
Cell type deconvolution
To estimate the enrichment of various immune cell types, gene expression deconvolution analyses were performed with single sample GSEACitation58 implemented in the GSVA package using the 24 immune-signatures reported in Bindea et al. Citation59 Hierarchical clustering with ward criterion (Ward.D2) was then applied to the matrix of the ES, in order to segregate the samples based on their immune cell composition. Differentially expressed ESs between ICR1 and ICR4 were calculated through t-test, using a cut-off of FDR-adjusted p value (q value) < 0.05.
Somatic mutations
The distribution of somatic mutations and neoepitopes among classes in comparisons was tested by Kruskal–Wallis test. DMGs between ICR1 and ICR4 were identified by Fisher's exact test for those 5,037 genes that have at least 1% mutation in one of the four CR cluster (cut-off p value = 0.01). We used the Cochran–Armitage test for trend to exclude the presence of a linear trend between the proportions of mutated samples within each ICR subtype.
Neoepitope analysis
Predicted patient-specific HLA class I binding peptides resulting from somatic mutations for individual tumor samples were obtained from Rooney et al.Citation74 For a given mutation, the pipeline calculated binding affinities of all possible 9- and 10-mer mutant amino acid peptides overlapping the mutation site using NetMHCpan (v2.4) Citation107 either in the presence or absence of the somatic mutation. The corresponding germline four-digit HLA class I alleles for each sample was inferred using POLYSOLVER Bayesian classifier genotype.Citation108 To minimize false positives, investigators considered only peptides that originate from expressed genes (median > 10 TPM in the tumor type) and show a binding affinity of < 500 nM. Using this dataset, we defined high affinity peptides as those predicted to have IC50 ≤ 50 nm or Rank score ≤ 0.5% (default cutoffs of NetMHCpan). For alleles distant to the MHC molecules included in the training of the method, Rank score is calculated as the percentage rank relative to a set of 200,000 random natural peptides. If a peptide harboring a given mutation is predicted to be a high affinity binder, whereas the original unmutated germline peptide is not predicted as such, this mutated peptide was defined as a potential strong neoepitope. We calculated immunogenic profiles for individual samples or genes as the ratio between the distinct count of mutations that lead to at least one putative strong neoepitope and the total number of distinct mutations observed in the sample or gene.
Copy number alterations
Significant genomic imbalances were based on Affymetrix SNP6.0 GeneChip arrays and processed using Genomic Identification of Significant Targets in Cancer (GISTIC) version 2.0 algorithmCitation109 to identify broad and focal CNAs specific for each group. GISTIC computes, for each segment through the genome, a score based on the frequency of CNA combined with its amplitude, with bootstrapping to calculate the significance level in terms of FDR-adjusted p values (q values). GISTIC thresholds for calling gain and loss were set to absolute log 2 ratio > 0.1 and only CNAs with a q value < 0.05 were considered relevant for further analysis. For the generation of the ideogram plot, we made use of NCBI's Genome Decoration Page (GDP, source: http://www.ncbi.nlm.nih.gov/genome/tools/gdp). BED files were generated for significant (FDR-adjusted p value (q value) ≤ 0.001, χ2 test) differently amplified or deleted genes between ICR1 and ICR4 and uploaded to the GDP tool to create an ideogram for amplification and deletion. The Immunone databaseCitation66 (846 genes) was used to filter the “immune-related” genes among the all genes differentially amplified or deleted between ICR1 and ICR4.
Disclosure of potential conflicts of interest
No potential conflicts of interest were disclosed.
KONI_A_1253654_supplementary_data.zip
Download Zip (58.7 MB)References
- Fridman WH, Pagès F, Sautès-Fridman C, Galon J. The immune contexture in human tumours: impact on clinical outcome. Nat Rev Cancer 2012; 12:298-306; PMID:22419253; http://dx.doi.org/10.1038/nrc3245
- Galon J, Mlecnik B, Marliot F, Ou F-S, Carlo Bruno B, Lugli A, Zlobec I, Rau TT, Hartmann A, Masucci GV et al. Validation of the Immunoscore (IM) as a prognostic marker in stage I/II/III colon cancer: Results of a worldwide consortium-based analysis of 1,336 patients. J Clin Oncol 2016.
- Adams S, Gray RJ, Demaria S, Goldstein L, Perez EA, Shulman LN, Martino S, Wang M, Jones VE, Saphner TJ et al. Prognostic value of tumor-infiltrating lymphocytes in triple-negative breast cancers from two phase III randomized adjuvant breast cancer trials: ECOG 2197 and ECOG 1199. J Clin Oncol 2014; 32:2959-66; PMID:25071121; http://dx.doi.org/10.1200/JCO.2013.55.0491
- Loi S, Sirtaine N, Piette F, Salgado R, Viale G, Eenoo FV, Rouas G, Francis P, Crown JPA, Hitre E et al. Prognostic and predictive value of tumor-infiltrating lymphocytes in a phase III randomized adjuvant breast cancer trial in node-positive breast cancer comparing the addition of docetaxel to doxorubicin with doxorubicin-based chemotherapy: BIG 02-98. J Clin Oncol 2013; 31:860-7; PMID:23341518; http://dx.doi.org/10.1200/JCO.2011.41.0902
- Loi S, Michiels S, Salgado R, Sirtaine N, Jose V, Fumagalli D, Kellokumpu-Lehtinen P-L, Bono P, Kataja V, Desmedt C et al. Tumor infiltrating lymphocytes are prognostic in triple negative breast cancer and predictive for trastuzumab benefit in early breast cancer: results from the FinHER trial. Ann Oncol 2014; 25:1544-50; PMID:24608200; http://dx.doi.org/10.1093/annonc/mdu112
- Salgado R, Denkert C, Demaria S, Sirtaine N, Klauschen F, Pruneri G, Wienert S, Eynden GV den, Baehner FL, Penault-Llorca F et al. The evaluation of tumor-infiltrating lymphocytes (TILs) in breast cancer: recommendations by an International TILs Working Group 2014. Ann Oncol 2015; 26:259-71; PMID:25214542; http://dx.doi.org/10.1093/annonc/mdu450
- Denkert C, Loibl S, Noske A, Roller M, Muller BM, Komor M, Budczies J, Darb-Esfahani S, Kronenwett R, Hanusch C et al. Tumor-associated lymphocytes as an independent predictor of response to neoadjuvant chemotherapy in breast cancer. J Clin Oncol 2010; 28:105-13; PMID:19917869; http://dx.doi.org/10.1200/JCO.2009.23.7370
- Denkert C, Minckwitz G von, Brase JC, Sinn BV, Gade S, Kronenwett R, Pfitzner BM, Salat C, Loi S, Schmitt WD et al. Tumor-infiltrating lymphocytes and response to neoadjuvant chemotherapy with or without carboplatin in human epidermal growth factor receptor 2–positive and triple-negative primary breast cancers. J Clin Oncol 2015; 33:983-91; PMID:2553437; http://dx.doi.org/10.1200/JCO.2014.58.1967
- Bedognetti D, Wang E, Sertoli MR, Marincola FM. Gene expression profiling in vaccine therapy and immunotherapy for cancer. Expert Rev Vaccines 2010; 9:555-65; PMID:20518712; http://dx.doi.org/10.1586/erv.10.55
- Carretero R, Wang E, Rodriguez AI, Reinboth J, Ascierto ML, Engle AM, Liu H, Camacho FM, Marincola FM, Garrido F et al. Regression of melanoma metastases after immunotherapy is associated with activation of antigen presentation and interferon-mediated rejection genes. Int J Cancer 2012; 131:387-95; PMID:21964766; http://dx.doi.org/10.1002/ijc.26471
- Panelli MC, Wang E, Phan G, Puhlmann M, Miller L, Ohnmacht GA, Klein HG, Marincola FM. Gene-expression profiling of the response of peripheral blood mononuclear cells and melanoma metastases to systemic IL-2 administration. Genome Biol 2002; 3:RESEARCH0035; PMID:12184809; http://dx.doi.org/10.1186/gb-2002-3-7-research0035
- Panelli MC, Stashower ME, Slade HB, Smith K, Norwood C, Abati A, Fetsch P, Filie A, Walters S-A, Astry C et al. Sequential gene profiling of basal cell carcinomas treated with imiquimod in a placebo-controlled study defines the requirements for tissue rejection. Genome Biol 2007; 8:R8; PMID:17222352; http://dx.doi.org/10.1186/gb-2007-8-1-r8
- Wang E, Miller LD, Ohnmacht GA, Mocellin S, Perez-Diez A, Petersen D, Zhao Y, Simon R, Powell JI, Asaki E et al. Prospective molecular profiling of melanoma metastases suggests classifiers of immune responsiveness. Cancer Res 2002; 62:3581-6; PMID:12097256
- Weiss GR, Grosh WW, Chianese-Bullock KA, Zhao Y, Liu H, Slingluff CL, Marincola FM, Wang E. Molecular insights on the peripheral and intra-tumoral effects of systemic high dose rIL-2 (Aldesleukin) administration for the treatment of metastatic melanoma. Clin Cancer Res 2011; 17:7440-50; PMID:21976537; http://dx.doi.org/10.1158/1078-0432.CCR-11-1650
- Ascierto ML, Kmieciak M, Idowu MO, Manjili R, Zhao Y, Grimes M, Dumur C, Wang E, Ramakrishnan V, Wang X-Y et al. A signature of immune function genes associated with recurrence-free survival in breast cancer patients. Breast Cancer Res Treat 2012; 131:871-80; PMID:21479927; http://dx.doi.org/10.1007/s10549-011-1470-x
- Galon J, Costes A, Sanchez-Cabo F, Kirilovsky A, Mlecnik B, Lagorce-Pagès C, Tosolini M, Camus M, Berger A, Wind P et al. Type, density, and location of immune cells within human colorectal tumors predict clinical outcome. Science 2006; 313:1960-4; PMID:17008531; http://dx.doi.org/10.1126/science.1129139
- Galon J, Angell HK, Bedognetti D, Marincola FM. The continuum of cancer immunosurveillance: prognostic, predictive, and mechanistic signatures. Immunity 2013; 39:11-26; PMID:23890060; http://dx.doi.org/10.1016/j.immuni.2013.07.008
- Tosolini M, Kirilovsky A, Mlecnik B, Fredriksen T, Mauger S, Bindea G, Berger A, Bruneval P, Fridman W-H, Pagès F et al. Clinical impact of different classes of infiltrating T cytotoxic and helper cells (Th1, Th2, Treg, Th17) in patients with colorectal cancer. Cancer Res 2011; 71:1263-71; PMID:21303976; http://dx.doi.org/10.1158/0008-5472.CAN-10-2907
- Bedognetti D, Spivey TL, Zhao Y, Uccellini L, Tomei S, Dudley ME, Ascierto ML, De Giorgi V, Liu Q, Delogu LG et al. CXCR3/CCR5 pathways in metastatic melanoma patients treated with adoptive therapy and interleukin-2. Br J Cancer 2013; 109:2412-23; PMID:24129241; http://dx.doi.org/10.1038/bjc.2013.557
- Ulloa-Montoya F, Louahed J, Dizier B, Gruselle O, Spiessens B, Lehmann FF, Suciu S, Kruit WHJ, Eggermont AMM, Vansteenkiste J et al. Predictive gene signature in MAGE-A3 antigen-specific cancer immunotherapy. J Clin Oncol 2013; 31:2388-95; PMID:23715562; http://dx.doi.org/10.1200/JCO.2012.44.3762
- Wang E, Bedognetti D, Marincola FM. Prediction of response to anticancer immunotherapy using gene signatures. J Clin Oncol 2013; 31:2369-71; PMID:23715576; http://dx.doi.org/10.1200/JCO.2013.49.2157
- Herbst RS, Soria J-C, Kowanetz M, Fine GD, Hamid O, Gordon MS, Sosman JA, McDermott DF, Powderly JD, Gettinger SN et al. Predictive correlates of response to the anti-PD-L1 antibody MPDL3280A in cancer patients. Nature 2014; 515:563-7; PMID:25428504; http://dx.doi.org/10.1038/nature14011
- Ji R-R, Chasalow SD, Wang L, Hamid O, Schmidt H, Cogswell J, Alaparthy S, Berman D, Jure-Kunkel M, Siemers NO et al. An immune-active tumor microenvironment favors clinical response to ipilimumab. Cancer Immunol Immunother 2011; 61:1019-31; PMID:22146893; http://dx.doi.org/10.1007/s00262-011-1172-6
- Ribas A, Robert C, Hodi FS, Wolchok JD, Joshua AM, Hwu W-J, Weber JS, Zarour HM, Kefford R, Loboda A et al. Association of response to programmed death receptor 1 (PD-1) blockade with pembrolizumab (MK-3475) with an interferon-inflammatory immune gene signature. J Clin Oncol 2015
- Van Allen EM, Miao D, Schilling B, Shukla SA, Blank C, Zimmer L, Sucker A, Hillen U, Geukes Foppen MH, Goldinger SM et al. Genomic correlates of response to CTLA-4 blockade in metastatic melanoma. Science 2015; 350:207-11; PMID:26359337; http://dx.doi.org/10.1126/science.aad0095
- Imanguli MM, Swaim WD, League SC, Gress RE, Pavletic SZ, Hakim FT. Increased T-bet+ cytotoxic effectors and type I interferon-mediated processes in chronic graft-versus-host disease of the oral mucosa. Blood 2009; 113:3620-30; PMID:19168793; http://dx.doi.org/10.1182/blood-2008-07-168351
- Saint-Mezard P, Berthier CC, Zhang H, Hertig A, Kaiser S, Schumacher M, Wieczorek G, Bigaud M, Kehren J, Rondeau E et al. Analysis of independent microarray datasets of renal biopsies identifies a robust transcript signature of acute allograft rejection. Transpl Int 2009; 22:293-302; PMID:19017305; http://dx.doi.org/10.1111/j.1432-2277.2008.00790.x
- Spivey TL, Uccellini L, Ascierto ML, Zoppoli G, De Giorgi V, Delogu LG, Engle AM, Thomas JM, Wang E, Marincola FM et al. Gene expression profiling in acute allograft rejection: challenging the immunologic constant of rejection hypothesis. J Transl Med 2011; 9:174; PMID:21992116; http://dx.doi.org/10.1186/1479-5876-9-174
- Yoshida S, Arakawa F, Higuchi F, Ishibashi Y, Goto M, Sugita Y, Nomura Y, Niino D, Shimizu K, Aoki R et al. Gene expression analysis of rheumatoid arthritis synovial lining regions by cDNA microarray combined with laser microdissection: up-regulation of inflammation-associated STAT1, IRF1, CXCL9, CXCL10, and CCL5. Scand J Rheumatol 2012; 41:170-9; PMID:22401175; http://dx.doi.org/10.3109/03009742.2011.623137
- Bedognetti D, Hendrickx W, Ceccarelli M, Miller LD, Seliger B. Disentangling the relationship between tumor genetic programs and immune responsiveness. Curr Opin Immunol 2016; 39:150-8; PMID:26967649; http://dx.doi.org/10.1016/j.coi.2016.02.001
- Mantovani A, Romero P, Palucka AK, Marincola FM. Tumour immunity: effector response to tumour and role of the microenvironment. Lancet Lond Engl 2008; 371:771-83; PMID:18275997; http://dx.doi.org/10.1016/S0140-6736(08)60241-X
- Wang E, Worschech A, Marincola FM. The immunologic constant of rejection. Trends Immunol 2008; 29:256-62; PMID:18457994; http://dx.doi.org/10.1016/j.it.2008.03.002
- Spranger S, Spaapen RM, Zha Y, Williams J, Meng Y, Ha TT, Gajewski TF. Up-regulation of PD-L1, IDO, and T(regs) in the melanoma tumor microenvironment is driven by CD8(+) T cells. Sci Transl Med 2013; 5:200ra116; PMID:23986400; http://dx.doi.org/10.1126/scitranslmed.3006504
- Sunshine J, Taube JM. PD-1/PD-L1 inhibitors. Curr Opin Pharmacol 2015; 23:32-8; PMID:26047524; http://dx.doi.org/10.1016/j.coph.2015.05.011
- Ascierto ML, Idowu MO, Zhao Y, Khalak H, Payne KK, Wang X-Y, Dumur CI, Bedognetti D, Tomei S, Ascierto PA et al. Molecular signatures mostly associated with NK cells are predictive of relapse free survival in breast cancer patients. J Transl Med 2013; 11:145; PMID:23758773; http://dx.doi.org/10.1186/1479-5876-11-145
- Bedognetti D, Wang E, Marincola FM. Meta-analysis and metagenes: CXCL-13-driven signature as a robust marker of intratumoral immune response and predictor of breast cancer chemotherapeutic outcome. OncoImmunology 2014; 3:e28727; PMID:25340012; http://dx.doi.org/10.4161/onci.28727
- Bertucci F, Ueno NT, Finetti P, Vermeulen P, Lucci A, Robertson FM, Marsan M, Iwamoto T, Krishnamurthy S, Masuda H et al. Gene expression profiles of inflammatory breast cancer: correlation with response to neoadjuvant chemotherapy and metastasis-free survival. Ann Oncol 2014; 25:358-65; PMID:24299959; http://dx.doi.org/10.1093/annonc/mdt496
- Burstein MD, Tsimelzon A, Poage GM, Covington KR, Contreras A, Fuqua SAW, Savage MI, Osborne CK, Hilsenbeck SG, Chang JC et al. Comprehensive genomic analysis identifies novel subtypes and targets of triple-negative breast cancer. Clin Cancer Res 2015; 21:1688-98; PMID:25208879; http://dx.doi.org/10.1158/1078-0432.CCR-14-0432
- Desmedt C, Haibe-Kains B, Wirapati P, Buyse M, Larsimont D, Bontempi G, Delorenzi M, Piccart M, Sotiriou C. Biological processes associated with breast cancer clinical outcome depend on the molecular subtypes. Clin Cancer Res 2008; 14:5158-65; PMID:18698033; http://dx.doi.org/10.1158/1078-0432.CCR-07-4756
- Gu-Trantien C, Loi S, Garaud S, Equeter C, Libin M, de Wind A, Ravoet M, Le Buanec H, Sibille C, Manfouo-Foutsop G et al. CD4+ follicular helper T cell infiltration predicts breast cancer survival. J Clin Invest 2013; 123:2873-92; PMID:23778140; http://dx.doi.org/10.1172/JCI67428
- Ignatiadis M, Singhal SK, Desmedt C, Haibe-Kains B, Criscitiello C, Andre F, Loi S, Piccart M, Michiels S, Sotiriou C. Gene modules and response to neoadjuvant chemotherapy in breast cancer subtypes: a pooled analysis. J Clin Oncol 2012; 30:1996-2004; PMID:22508827; http://dx.doi.org/10.1200/JCO.2011.39.5624
- Lee HJ, Lee J-J, Song IH, Park IA, Kang J, Yu JH, Ahn J-H, Gong G. Prognostic and predictive value of NanoString-based immune-related gene signatures in a neoadjuvant setting of triple-negative breast cancer: relationship to tumor-infiltrating lymphocytes. Breast Cancer Res Treat 2015; 151:619-27; PMID:26006068; http://dx.doi.org/10.1007/s10549-015-3438-8
- Miller LD, Chou JA, Black MA, Print C, Chifman J, Alistar A, Putti T, Zhou X, Bedognetti D, Hendrickx W et al. Immunogenic subtypes of breast cancer delineated by gene classifiers of immune responsiveness. Cancer Immunol Res 2016; 4:600-10; PMID:27197066; http://dx.doi.org/10.1158/2326-6066
- Perez EA, Thompson EA, Ballman KV, Anderson SK, Asmann YW, Kalari KR, Eckel-Passow JE, Dueck AC, Tenner KS, Jen J et al. Genomic analysis reveals that immune function genes are strongly linked to clinical outcome in the North Central cancer treatment group N9831 adjuvant trastuzumab trial. J Clin Oncol 2015; 33:701-8; PMID:25605861; http://dx.doi.org/10.1200/JCO.2014.57.6298
- Sistigu A, Yamazaki T, Vacchelli E, Chaba K, Enot DP, Adam J, Vitale I, Goubar A, Baracco EE, Remédios C et al. Cancer cell-autonomous contribution of type I interferon signaling to the efficacy of chemotherapy. Nat Med 2014; 20:1301-9; PMID:25344738; http://dx.doi.org/10.1038/nm.3708
- Stoll G, Enot D, Mlecnik B, Galon J, Zitvogel L, Kroemer G. Immune-related gene signatures predict the outcome of neoadjuvant chemotherapy. OncoImmunology 2014; 3:e27884; PMID:24790795; http://dx.doi.org/10.4161/onci.27884
- Bedognetti D, Hendrickx W, Marincola FM, Miller LD. Prognostic and predictive immune gene signatures in breast cancer. Curr Opin Oncol 2015; 27:433-44; PMID:26418235; http://dx.doi.org/10.1097/CCO.0000000000000234
- Bedognetti D, Maccalli C, Bader SBJA, Marincola FM, Seliger B. Checkpoint inhibitors and their application in breast cancer. Breast Care (Basel) 2016; 11:108-15; PMID:27239172; http://dx.doi.org/10.1159/000445335
- Emens LA, Braiteh FS, Cassier P, DeLord J-P, Eder JP, Shen X, Xiao Y, Wang Y, Hegde PS, Chen DS et al. Abstract PD1-6: Inhibition of PD-L1 by MPDL3280A leads to clinical activity in patients with metastatic triple-negative breast cancer. Cancer Res 2015; http://dx.doi.org/10.1158/1538-7445
- Nanda R, Chow LQ, Dees EC, Berger R, Gupta S, Geva R, Pusztai L, Dolled-Filhart M, Emancipator K, Gonzalez EJ et al. Abstract S1-09: A phase Ib study of pembrolizumab (MK-3475) in patients with advanced triple-negative breast cancer. Cancer Res 2015; http://dx.doi.org/10.1158/1538-7445
- Spranger S, Bao R, Gajewski TF. Melanoma-intrinsic β-catenin signalling prevents anti-tumour immunity. Nature 2015; 523:231-5; PMID:25970248; http://dx.doi.org/10.1038/nature14404
- Bittner M, Meltzer P, Chen Y, Jiang Y, Seftor E, Hendrix M, Radmacher M, Simon R, Yakhini Z, Ben-Dor A et al. Molecular classification of cutaneous malignant melanoma by gene expression profiling. Nature 2000; 406:536-40; PMID:10952317; http://dx.doi.org/10.1038/35020115
- Spivey TL, De Giorgi V, Zhao Y, Bedognetti D, Pos Z, Liu Q, Tomei S, Ascierto ML, Uccellini L, Reinboth J et al. The stable traits of melanoma genetics: an alternate approach to target discovery. BMC Genomics 2012; 13:156; PMID:22537248; http://dx.doi.org/10.1186/1471-2164-13-156
- Rizvi NA, Hellmann MD, Snyder A, Kvistborg P, Makarov V, Havel JJ, Lee W, Yuan J, Wong P, Ho TS et al. Mutational landscape determines sensitivity to PD-1 blockade in non-small cell lung cancer. Science 2015; 348:124-8; PMID:25765070; http://dx.doi.org/10.1126/science.aaa1348
- Snyder A, Makarov V, Merghoub T, Yuan J, Zaretsky JM, Desrichard A, Walsh LA, Postow MA, Wong P, Ho TS et al. Genetic basis for clinical response to CTLA-4 blockade in Melanoma. N Engl J Med 2014; 371:2189-99; PMID:25409260; http://dx.doi.org/10.1056/NEJMoa1406498
- Casey SC, Tong L, Li Y, Do R, Walz S, Fitzgerald KN, Gouw AM, Baylot V, Gütgemann I, Eilers M et al. MYC regulates the antitumor immune response through CD47 and PD-L1. Science 2016; 352:227-31; PMID:26966191; http://dx.doi.org/10.1126/science.aac9935
- Peng W, Chen JQ, Liu C, Malu S, Creasy C, Tetzlaff MT, Xu C, McKenzie JA, Zhang C, Liang X et al. Loss of PTEN promotes resistance to T cell-mediated immunotherapy. Cancer Discov 2016; 6:202-16; PMID:26645196; http://dx.doi.org/10.1158/2159-8290.CD-15-0283
- Barbie DA, Tamayo P, Boehm JS, Kim SY, Moody SE, Dunn IF, Schinzel AC, Sandy P, Meylan E, Scholl C et al. Systematic RNA interference reveals that oncogenic KRAS-driven cancers require TBK1. Nature 2009; 462:108-12; PMID:19847166; http://dx.doi.org/10.1038/nature08460
- Bindea G, Mlecnik B, Tosolini M, Kirilovsky A, Waldner M, Obenauf AC, Angell H, Fredriksen T, Lafontaine L, Berger A et al. Spatiotemporal dynamics of intratumoral immune cells reveal the immune landscape in human cancer. Immunity 2013; 39:782-95; PMID:24138885; http://dx.doi.org/10.1016/j.immuni.2013.10.003
- Cancer Genome Atlas Network. Comprehensive molecular portraits of human breast tumours. Nature 2012; 490:61-70; PMID:23000897; http://dx.doi.org/10.1038/nature11412
- Peddi PF, Ellis MJ, Ma C, Peddi PF, Ellis MJ, Ma C. Molecular basis of triple negative breast cancer and implications for therapy, molecular basis of triple negative breast cancer and implications for therapy. Int J Breast Cancer 2011; 2012:e217185; PMID:22295242; http://dx.doi.org/10.1155/2012/217185
- Lawrence MS, Stojanov P, Polak P, Kryukov GV, Cibulskis K, Sivachenko A, Carter SL, Stewart C, Mermel CH, Roberts SA et al. Mutational heterogeneity in cancer and the search for new cancer-associated genes. Nature 2013; 499:214-8; PMID:23770567; http://dx.doi.org/10.1038/nature12213
- Greenman C, Stephens P, Smith R, Dalgliesh GL, Hunter C, Bignell G, Davies H, Teague J, Butler A, Stevens C et al. Patterns of somatic mutation in human cancer genomes. Nature 2007; 446:153-8; PMID:17344846; http://dx.doi.org/10.1038/nature05610
- Ellis MJ, Ding L, Shen D, Luo J, Suman VJ, Wallis JW, Van Tine BA, Hoog J, Goiffon RJ, Goldstein TC et al. Whole-genome analysis informs breast cancer response to aromatase inhibition. Nature 2012; 486:353-60; PMID:22722193; http://dx.doi.org/10.1038/nature11143
- Ma CX, Ellis MJ. The Cancer Genome Atlas: clinical applications for breast cancer. Oncology (Williston Park) 2013; 27:1263-9, 1274-9; PMID:24624545.
- Ortutay C, Vihinen M. Immunome: A reference set of genes and proteins for systems biology of the human immune system. Cell Immunol 2006; 244:87-9; PMID:17434156; http://dx.doi.org/10.1016/j.cellimm.2007.01.012
- Gentles AJ, Newman AM, Liu CL, Bratman SV, Feng W, Kim D, Nair VS, Xu Y, Khuong A, Hoang CD et al. The prognostic landscape of genes and infiltrating immune cells across human cancers. Nat Med 2015; 21:938-45; PMID:26193342; http://dx.doi.org/10.1038/nm.3909
- Avalle L, Pensa S, Regis G, Novelli F, Poli V. STAT1 and STAT3 in tumorigenesis: A matter of balance. JAK-STAT 2012; 1:65-72; PMID:24058752; http://dx.doi.org/10.4161/jkst.20045
- Koromilas AE, Sexl V. The tumor suppressor function of STAT1 in breast cancer. JAK-STAT 2013; 2:e23353; PMID:24058806; http://dx.doi.org/10.4161/jkst.23353
- Sonnenblick A, Brohée S, Fumagalli D, Vincent D, Venet D, Ignatiadis M, Salgado R, Eynden GV, den Rothé F, Desmedt C et al. Constitutive phosphorylated STAT3-associated gene signature is predictive for trastuzumab resistance in primary HER2-positive breast cancer. BMC Med 2015; 13:177; PMID:26234940; http://dx.doi.org/10.1186/s12916-015-0416-2
- Yu H, Pardoll D, Jove R. STATs in cancer inflammation and immunity: a leading role for STAT3. Nat Rev Cancer 2009; 9:798-809; PMID:19851315; http://dx.doi.org/10.1038/nrc2734
- Chen DS, Mellman I. Oncology meets immunology: the cancer-immunity cycle. Immunity 2013; 39:1-10; PMID:23890059; http://dx.doi.org/10.1016/j.immuni.2013.07.012
- Franciszkiewicz K, Boissonnas A, Boutet M, Combadière C, Mami-Chouaib F. Role of chemokines and chemokine receptors in shaping the effector phase of the antitumor immune response. Cancer Res 2012; 72:6325-32; PMID:23222302; http://dx.doi.org/10.1158/0008-5472.CAN-12-2027
- Rooney MS, Shukla SA, Wu CJ, Getz G, Hacohen N. Molecular and genetic properties of tumors associated with local immune cytolytic activity. Cell 2015; 160:48-61; PMID:25594174; http://dx.doi.org/10.1016/j.cell.2014.12.033
- Loi S. Tumor-infiltrating lymphocytes, breast cancer subtypes and therapeutic efficacy. OncoImmunology 2013; 2:e24720; PMID:24073365; http://dx.doi.org/10.4161/onci.24720
- Tsang JYS, Ni Y-B, Chan S-K, Yamaguchi R, Tanaka M, Tan P-H, Tse GM. Increased lymphocytic infiltration in breast cancer correlated with molecular subtypes and HER2 gene amplification. Histopathology 2013; 62:963-5; PMID:23551496; http://dx.doi.org/10.1111/his.12085
- Hanel W, Moll UM. Links between mutant p53 and genomic instability. J Cell Biochem 2012; 113:433-9; PMID:22006292; http://dx.doi.org/10.1002/jcb.23400
- Kriegsmann M, Endris V, Wolf T, Pfarr N, Stenzinger A, Loibl S, Denkert C, Schneeweiss A, Budczies J, Sinn P et al. Mutational profiles in triple-negative breast cancer defined by ultradeep multigene sequencing show high rates of PI3K pathway alterations and clinically relevant entity subgroup specific differences. Oncotarget 2014; 5:9952-65; PMID:25296970; http://dx.doi.org/10.18632/oncotarget.2481
- Quigley D, Silwal-Pandit L, Dannenfelser R, Langerød A, Vollan HKM, Vaske C, Siegel JU, Troyanskaya O, Chin S-F, Caldas C et al. Lymphocyte invasion in IC10/Basal-like breast tumors is associated with Wild-type TP53. Mol Cancer Res 2015; 13:493-501; PMID:25351767; http://dx.doi.org/10.1158/1541-7786.MCR-14-0387
- Bogoyevitch MA, Court NW. Counting on mitogen-activated protein kinases—ERKs 3, 4, 5, 6, 7 and 8. Cell Signal 2004; 16:1345-54; PMID:15381250; http://dx.doi.org/10.1016/j.cellsig.2004.05.004
- Shaul YD, Seger R. The MEK/ERK cascade: From signaling specificity to diverse functions. Biochim Biophys Acta – Mol Cell Res 2007; 1773:1213-26; PMID:17112607; http://dx.doi.org/10.1016/j.bbamcr.2006.10.005
- Pavese JM, Ogden IM, Voll EA, Huang X, Xu L, Jovanovic B, Bergan RC. Mitogen-activated protein kinase kinase 4 (MAP2K4) promotes human prostate cancer metastasis. PLoS One 2014; 9:e102289; PMID:25019290; http://dx.doi.org/10.1371/journal.pone.0102289
- Pham TT, Angus SP, Johnson GL. MAP3K1 genomic alterations in cancer and function in promoting cell survival or apoptosis. Genes Cancer 2013; (11-12):419-26; PMID:24386504; http://dx.doi.org/10.1177/1947601913513950
- Liu Y, Shepherd EG, Nelin LD. MAPK phosphatases—regulating the immune response. Nat Rev Immunol 2007; 7:202-12; PMID:17318231; http://dx.doi.org/10.1038/nri2035
- Arthur JSC, Ley SC. Mitogen-activated protein kinases in innate immunity. Nat Rev Immunol 2013; 13:679-92; PMID:23954936; http://dx.doi.org/10.1038/nri3495
- Iyer SS, Cheng G. Role of interleukin 10 transcriptional regulation in inflammation and autoimmune disease. Crit Rev Immunol 2012; 32:23-63; PMID:22428854; http://dx.doi.org/10.1615/CritRevImmunol.v32.i1.30
- Jackson AM, Mulcahy LA, Porte J, Franks HA, El Refaee M, Wang Q, Shah S, Zhu X, Patel PM. Role of mitogen-activated protein kinase and PI3K pathways in the regulation of IL-12-family cytokines in dendritic cells and the generation of T H-responses. Eur Cytokine Netw 2010; 21:319-28; PMID:21112826; http://dx.doi.org/10.1684/ecn.2010.0219
- Soares-Silva M, Diniz FF, Gomes GN, Bahia D. The mitogen-activated protein kinase (MAPK) pathway: role in immune evasion by trypanosomatids. Front Microbiol 2016; 24;7:183; PMID:26941717; http://dx.doi.org/10.3389/fmicb.2016.00183
- Frederick DT, Piris A, Cogdill AP, Cooper ZA, Lezcano C, Ferrone CR, Mitra D, Boni A, Newton LP, Liu C et al. BRAF inhibition is associated with enhanced melanoma antigen expression and a more favorable tumor microenvironment in patients with metastatic melanoma. Clin Cancer Res 2013; 19:1225-31; PMID:23307859; http://dx.doi.org/10.1158/1078-0432.CCR-12-1630
- Tomei S, Bedognetti D, De Giorgi V, Sommariva M, Civini S, Reinboth J, Al Hashmi M, Ascierto ML, Liu Q, Ayotte BD et al. The immune-related role of BRAF in melanoma. Mol Oncol 2015; 9:93-104; PMID:25174651; http://dx.doi.org/10.1016/j.molonc.2014.07.014
- Hu-Lieskovan S, Mok S, Moreno BH, Tsoi J, Robert L, Goedert L, Pinheiro EM, Koya RC, Graeber TG, Comin-Anduix B et al. Improved antitumor activity of immunotherapy with BRAF and MEK inhibitors in BRAFV600E melanoma. Sci Transl Med 2015; 7:279ra41-279ra41; PMID:25787767; http://dx.doi.org/10.1126/scitranslmed.aaa4691
- Loi S. Host antitumor immunity plays a role in the survival of patients with newly diagnosed triple-negative breast cancer. J Clin Oncol 2014; 32:2935-7; PMID:25071115; http://dx.doi.org/10.1200/JCO.2014.56.7677
- Ceccarelli M, Barthel FP, Malta TM, Sabedot TS, Salama SR, Murray BA, Morozova O, Newton Y, Radenbaugh A, Pagnotta SM et al. Molecular profiling reveals biologically discrete subsets and pathways of progression in diffuse glioma. Cell 2016; 164:550-63; PMID:26824661; http://dx.doi.org/10.1016/j.cell.2015.12.028
- Colaprico A, Silva TC, Olsen C, Garofano L, Cava C, Garolini D, Sabedot TS, Malta TM, Pagnotta SM, Castiglioni I et al. TCGAbiolinks: an R/Bioconductor package for integrative analysis of TCGA data. Nucleic Acids Res 2016; 44:e71; PMID:26704973; http://dx.doi.org/10.1093/nar/gkv1507
- Ciriello G, Gatza ML, Beck AH, Wilkerson MD, Rhie SK, Pastore A, Zhang H, McLellan M, Yau C, Kandoth C et al. Comprehensive molecular portraits of invasive lobular breast cancer. Cell 2015; 163:506-19; PMID:26451490; http://dx.doi.org/10.1016/j.cell.2015.09.033
- Nagalla S, Chou JW, Willingham MC, Ruiz J, Vaughn JP, Dubey P, Lash TL, Hamilton-Dutoit SJ, Bergh J, Sotiriou C et al. Interactions between immunity, proliferation and molecular subtype in breast cancer prognosis. Genome Biol 2013; 14:R34; PMID:23618380; http://dx.doi.org/10.1186/gb-2013-14-4-r34
- Gentleman RC, Carey VJ, Bates DM, Bolstad B, Dettling M, Dudoit S, Ellis B, Gautier L, Ge Y, Gentry J et al. Bioconductor: open software development for computational biology and bioinformatics. Genome Biol 2004; 5:R80; PMID:15461798; http://dx.doi.org/10.1186/gb-2004-5-10-r80
- Johnson WE, Li C, Rabinovic A. Adjusting batch effects in microarray expression data using empirical Bayes methods. Biostatistics 2007; 8:118-27; PMID:16632515; http://dx.doi.org/10.1093/biostatistics/kxj037
- Hu Z, Fan C, Oh DS, Marron JS, He X, Qaqish BF, Livasy C, Carey LA, Reynolds E, Dressler L et al. The molecular portraits of breast tumors are conserved across microarray platforms. BMC Genomics 2006; 7:96; PMID:16643655; http://dx.doi.org/10.1186/1471-2164-7-96
- Fan C, Oh DS, Wessels L, Weigelt B, Nuyten DSA, Nobel AB, van't Veer LJ, Perou CM. Concordance among gene-expression–based predictors for breast cancer. N Engl J Med 2006; 355:560-9; PMID:16899776; http://dx.doi.org/10.1056/NEJMoa052933
- Prat A, Parker JS, Karginova O, Fan C, Livasy C, Herschkowitz JI, He X, Perou CM. Phenotypic and molecular characterization of the claudin-low intrinsic subtype of breast cancer. Breast Cancer Res 2010; 12:R68; PMID:20813035; http://dx.doi.org/10.1186/bcr2635
- Wilkerson MD, Hayes DN. ConsensusClusterPlus: a class discovery tool with confidence assessments and item tracking. Bioinformatics 2010; 26:1572-3; PMID:20427518; http://dx.doi.org/10.1093/bioinformatics/btq170
- Abhijit . An enhanced Kaplan-Meier plot. Stat Bandit Available from: https://statbandit.wordpress.com/2011/03/08/an-enhanced-kaplan-meier-plot/
- Robinson MD, McCarthy DJ, Smyth GK. edgeR: a Bioconductor package for differential expression analysis of digital gene expression data. Bioinformatics 2010; 26:139-40; PMID:19910308; http://dx.doi.org/10.1093/bioinformatics/btp616
- Subramanian A, Tamayo P, Mootha VK, Mukherjee S, Ebert BL, Gillette MA, Paulovich A, Pomeroy SL, Golub TR, Lander ES et al. Gene set enrichment analysis: a knowledge-based approach for interpreting genome-wide expression profiles. Proc Natl Acad Sci USA 2005; 102:15545-50; PMID:16199517; http://dx.doi.org/10.1073/pnas.0506580102
- Merico D, Isserlin R, Stueker O, Emili A, Bader GD. Enrichment map: a network-based method for gene-set enrichment visualization and interpretation. PLoS One 2010; 5:e13984; PMID:21085593; http://dx.doi.org/10.1371/journal.pone.0013984
- Nielsen M, Lundegaard C, Blicher T, Lamberth K, Harndahl M, Justesen S, Røder G, Peters B, Sette A, Lund O et al. NetMHCpan, a method for quantitative predictions of peptide binding to any HLA-A and -B locus protein of known sequence. PLoS One 2007; 2:e796; PMID:17726526; http://dx.doi.org/10.1371/journal.pone.0000796
- Shukla SA, Rooney MS, Rajasagi M, Tiao G, Dixon PM, Lawrence MS, Stevens J, Lane WJ, Dellagatta JL, Steelman S et al. Comprehensive analysis of cancer-associated somatic mutations in class I HLA genes. Nat Biotechnol 2015; 33:1152-8; PMID:26372948; http://dx.doi.org/10.1038/nbt.3344
- Mermel CH, Schumacher SE, Hill B, Meyerson ML, Beroukhim R, Getz G. GISTIC2.0 facilitates sensitive and confident localization of the targets of focal somatic copy-number alteration in human cancers. Genome Biol 2011; 12:R41; PMID:21527027; http://dx.doi.org/10.1186/gb-2011-12-4-r41